Leukemia Therapeutics Market by Type (CLL, ALL, CML, AML), Treatment Type (Chemotherapy & Targeted Drugs by (CLL, ALL, CML, AML)), Mode of Administration (Oral, Injectable), Molecule Type (Small Molecules, Biologics), Gender, and Region - Global Forecast to 2024


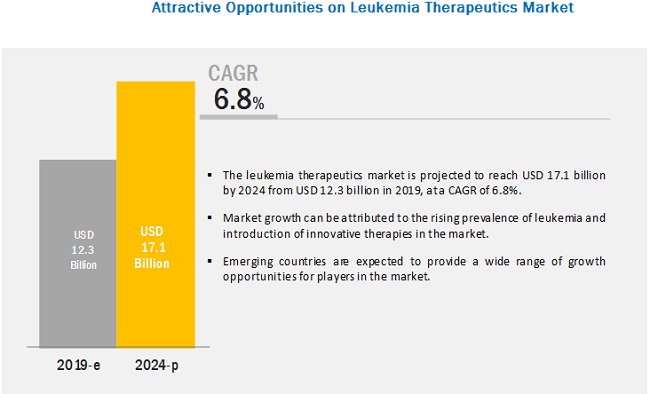
The leukemia therapeutics market is projected to reach USD 17.1 billion by 2024, at a CAGR of 6.8%. Market growth is largely driven by the rising prevalence of acute lymphocytic leukemia (ALL), chronic lymphocytic leukemia (CLL), acute myeloid leukemia (AML), and chronic myeloid leukemia (CML) and increasing approvals of novel & innovative drugs and immunotherapies.
Chronic myeloid leukemia accounted for the largest share of the market, by type of leukemia, in 2018
Factors such as the large number of treatment options available for the treatment of CML and high incidence rate of CML are significantly driving the growth of this market. For instance, in the US, there were 20,940 CML new cases, as compared to 20,110 in 2017. In addition, the growth of this market segment is driven by the rising geriatric population and increasing funding for cancer research and the development of new therapies.
Targeted drugs & immunotherapy dominated the leukemia therapeutics market, by treatment type, in 2018
Owing to the surging demand for targeted drugs, this segment likely to dominate the market during the forecast period. Targeted drugs are most widely used owing to their fewer side effects and higher efficacy and success rate as compared to chemotherapy Owing to these factors, their sales have increased in recent years. For instance, the first FDA-approved immunotherapy for ALL by Novartis registered sales of USD 76 million in 2018 as compared to USD 6 million in 2017. Similarly, the sales for BLINCYTO by Amgen indicated for ALL increased by 37% in the fourth quarter of 2018.
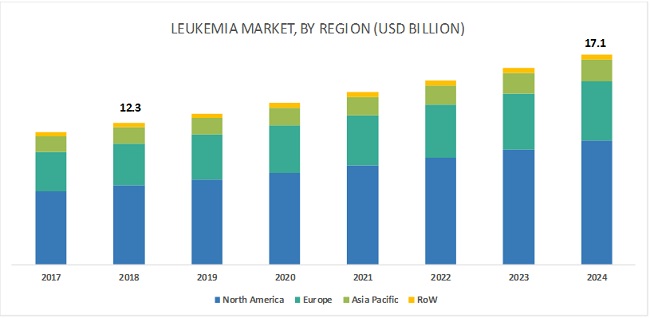
North America to grow at the highest rate during the forecast period (2019�2024)
There has been a tremendous increase in cell-based research activities over the past decade. Increasing research in the field of regenerative medicine for the treatment of leukemia and growing awareness on personalized medicine have also resulted in the growth of this market. In addition to it, the growth in this market is driven by the high prevalence and incidence of leukemia and the rising geriatric population. According to the Leukemia & Lymphoma Society, an estimated 381,774 people are living with or in remission from leukemia in the US.
The Canadian government is taking various initiatives to support leukemia research and develop novel immunotherapies. For instance, in January 2016, the Canadian government announced the provision of USD 20 million to the Centre for Commercialization of Regenerative Medicine (CCRM) to help establish a stem cell therapy development facility in Toronto (Canada).
Key Market Players
The major players in this market are AbbVie (US), Bristol-Myers Squibb (US), Novartis (Switzerland, F. Hoffmann-La Roche (Switzerland), Pfizer (US), Sanofi (France), Amgen (US), Gilead Sciences (US), Takeda Pharmaceutical (Japan), and Celgene (US). Product approvals are a key strategy adopted by key players in order to enhance their dominance in this market.
Novartis is leading the global leukemia therapeutics market, owing to its strong sales channel and innovative therapies. The company invested ~17.5% of its revenue for its R&D activities. In May 2018, Novartis launched its CAR-T cell therapy for the second indication�treatment of adult patients with relapsed or refractory (r/r) large B-cell lymphoma. With the innovative launch of Kymriah, Novartis is now a pioneer of leukemia immunotherapies.
Scope of the Report
|
Report Metric |
Details |
|
Market Size Available for Years |
2017�2024 |
|
Base Year Considered |
2018 |
|
Forecast Period |
2019�2024 |
|
Forecast Units |
Value (USD) |
|
Segments Covered |
Leukemia therapeutics market by treatment type, type of leukemia, gender, molecule type, mode of administration, and region |
|
Geographies Covered |
North America (US, Canada), Europe (Germany, France, UK, and the RoE), APAC (Japan, China, Australia, and the RoAPAC), and the RoW |
|
Companies Covered |
Major 10 players covered�Novartis (Switzerland), AbbVie (US), Bristol-Myers Squibb (US), F. Hoffmann-La Roche (Switzerland), Sanofi (France), Pfizer (US), Amgen (US), Gilead Sciences (US), Takeda Pharmaceutical (Japan), and Celgene (US) |
This research report categorizes the leukemia therapeutics market into the following segments and subsegments:
Leukemia Therapeutics Market, By Type of Leukemia
- Acute lymphocytic leukemia (ALL)
- Chronic lymphocytic leukemia (CLL)
- Acute myeloid leukemia (AML)
- Chronic myeloid leukemia (CML)
- Leukemia Therapeutics Market, By Treatment Type
- Targeted drugs & immunotherapy
- Chemotherapy
- Leukemia Therapeutics Market, By Molecule Type
- Small Molecules
- Biologics
Leukemia Therapeutics Market, By Mode of Administration
- Injectable
- Oral
Leukemia Therapeutics Market, By Gender
- Male
- Female
Leukemia Therapeutics Market, By Region
- North America
- US
- Canada
- Europe
- Germany
- UK
- France
- Rest of Europe
- Asia Pacific
- China
- Japan
- India
- Rest of Asia Pacific
- Rest of the World
Recent Developments:
- In January 2019, the EU approved BLINCYTO (blinatumomab) in patients with Philadelphia chromosome negative minimal residual disease-positive B-cell precursor acute lymphoblastic leukemia. BLINCYTO is the first and only therapy for a minimal residual disease that has been approved by the EU.
- In September 2018, blinatumomab received approval in Japan for the treatment of relapsed or refractory B-cell acute lymphoblastic leukemia.
- In July 2017, Celgene Corporation entered into a strategic partnership to develop and commercialize BeiGene�s investigational anti-programmed cell death protein 1 (PD-1) inhibitor, BGB-A317, for patients with solid tumor cancers. In addition to it, BeiGene acquired Celgene's commercial operations in China and gained an exclusive license to commercialize Celgene China�s cancer portfolio, inclusive of Vidaza.
Key Questions Addressed in the Report:
- What are the growth opportunities in the leukemia therapeutics market across major regions in the future?
- Emerging countries have immense opportunities for the growth and adoption of leukemia therapeutics market drugs and immunotherapies. Will this scenario continue during the next five years?
- Where will all the advancements in products offered by various companies take the industry in the mid- to long-term?
- What are the various leukemia drugs types and treatment type and their respective market shares in the overall market?
- What are the new trends and advancements in the leukemia therapeutics market?
To speak to our analyst for a discussion on the above findings, click Speak to Analyst
 Exclusive indicates content/data unique to MarketsandMarkets and not available with any competitors.
Table of Contents
1 Introduction (Page No. - 14)
1.1 Objectives of the Study
1.2 Market Definition
1.2.1 Markets Covered
1.2.2 Years Considered for the Study
1.3 Currency
1.4 Limitations
1.5 Stakeholders
2 Research Methodology (Page No. - 17)
2.1 Research Data
2.2 Secondary Data
2.2.1 Key Data From Secondary Sources
2.3 Primary Data
2.3.1 Key Data From Primary Sources
2.4 Market Size Estimation
2.4.1 Bottom-Up Approach
2.4.2 Top-Down Approach
2.5 Market Breakdown and Data Triangulation
2.6 Assumptions for the Study
3 Executive Summary (Page No. - 25)
4 Premium Insights (Page No. - 29)
4.1 Leukemia Therapeutics: Market Overview
4.2 Leukemia Therapeutics Market, By Treatment Type & Mode of Administration (2019)
4.3 Geographical Snapshot of the Leukemia Therapeutics Market
5 Market Overview (Page No. - 32)
5.1 Introduction
5.2 Market Dynamics
5.2.1 Drivers
5.2.1.1 Rising Prevalence of Leukemia
5.2.1.1.1 Growth in Geriatric Population
5.2.1.1.2 Rising Cancer Occurrence Among Children
5.2.1.2 Introduction of Innovative Therapies
5.2.2 Restraints
5.2.2.1 Complexities in Manufacturing
5.2.3 Opportunities
5.2.3.1 Growth Opportunities in Emerging Economies
6 Leukemia Therapeutics Market, By Type of Leukemia (Page No. - 36)
6.1 Introduction
6.2 Chronic Myeloid Leukemia
6.2.1 Chronic Myeloid Leukemia Accounts for the Largest Share of the Leukemia Therapeutics Market Primarily Due to the High Incidence of This Disease Worldwide
6.3 Chronic Lymphocytic Leukemia
6.3.1 The Incidence of Chronic Lymphocytic Leukemia Increases With Age and is More Common in Men Than Women
6.4 Acute Lymphocytic Leukemia
6.4.1 Acute Lymphocytic Leukemia Mostly Affects Children Between 3 and 7 Years of Age
6.5 Acute Myeloid Leukemia
6.5.1 Acute Myeloid Leukemia is the Most Common Acute Leukemia Affecting Adults
7 Leukemia Therapeutics Market, By Treatment Type (Page No. - 41)
7.1 Introduction
7.2 Targeted Drugs & Immunotherapy
7.2.1 Targeted Drugs & Immunotherapy Segment Accounts for the Larger Market Share Due to the Higher Efficacy & Success Rate Associated With Them as Compared to Chemotherapy
7.3 Chemotherapy
7.3.1 Chemotherapy is Effective and Essential for Cancers Such as Leukemia That have Spread Throughout the Body
8 Leukemia Therapeutics Market, By Molecule Type (Page No. - 50)
8.1 Introduction
8.2 Small Molecules
8.2.1 The Small Structure and Chemical Composition of Small Molecules Help Them to Easily Penetrate Cell Membranes
8.3 Biologics
8.3.1 This Segment is Expected to Grow at the Highest Growth Rate During the Forecast Period
9 Leukemia Therapeutics Market, By Mode of Administration (Page No. - 54)
9.1 Introduction
9.2 Oral Mode
9.2.1 Drugs Administered Orally have Lesser Complications
9.3 Injectable Mode
9.3.1 Injectable Mode of Administration is Less Preferred Than the Oral Mode of Administration
10 Leukemia Therapeutics Market, By Gender (Page No. - 57)
10.1 Introduction
10.2 Males
10.2.1 Men are at Higher Risk of Developing Leukemia Than Women
10.3 Females
10.3.1 Acute Lymphocytic Leukemia Remains Common Among Women
11 Leukemia Therapeutics Market, By Region (Page No. - 61)
11.1 Introduction
11.2 North America
11.2.1 US
11.2.1.1 US Accounted for the Largest Share of the North American Market Due to the High Prevalence of Leukemia in the Country
11.2.2 Canada
11.2.2.1 Government Initiatives to Support Leukemia Research and Develop Novel Immunotherapies is Expected to Support the Growth of the Canadian Leukemia Therapeutics Market
11.3 Europe
11.3.1 Germany
11.3.1.1 Germany has A Strong Foundation for R&D, Including Over 1,000 Public and Private Institutions
11.3.2 UK
11.3.2.1 Rising Geriatric Population in the Country to Drive Market Growth as the Incidence of Cancer is Higher in the Geriatric Population
11.3.3 France
11.3.3.1 Rising R&D Expenditure is A Major Growth Driver in France
11.3.4 Rest of Europe
11.4 Asia Pacific
11.4.1 Japan
11.4.1.1 Comparatively Lenient Regulations and Rising Geriatric Population Will Drive Market Growth
11.4.2 China
11.4.2.1 Favorable Investments and Government Support Will Contribute to the Growth of the Chinese Market
11.4.3 India
11.4.3.1 Shortage of Skilled Professionals May Restrain the Growth of the Indian Market
11.4.4 RoAPAC
11.5 Rest of the World
12 Competitive Landscape (Page No. - 90)
12.1 Overview
12.2 Market Ranking Analysis, 2018
12.3 Key Strategies
12.3.1 Regulatory Approvals/Launches
12.3.2 Acquisitions
12.3.3 Agreements, Collaborations, and Partnerships
12.4 Competitive Leadership Mapping (2018)
12.4.1 Vendor Inclusion Criteria
12.4.2 Visionary Leaders
12.4.3 Innovators
12.4.4 Dynamic Differentiators
12.4.5 Emerging Companies
12.5 Competitive Leadership Mapping for Start-Ups (2018)
12.5.1 Progressive Companies
12.5.2 Starting Blocks
12.5.3 Responsive Companies
12.5.4 Dynamic Companies
13 Company Profiles (Page No. - 98)
(Business Overview, Products Offered, Recent Developments, Regulatory Approvals, and MnM View)*
13.1 Novartis AG
13.2 AbbVie
13.3 Bristol-Myers Squibb
13.4 F. Hoffmann-La Roche
13.5 Sanofi
13.6 Pfizer
13.7 Amgen
13.8 Gilead Sciences
13.9 Takeda
13.10 Celgene
* Business Overview, Products Offered, Recent Developments, Regulatory Approvals, and MnM View Might Not Be Captured in Case of Unlisted Companies.
14 Appendix (Page No. - 118)
14.1 Insights From Industry Experts
14.2 Discussion Guide
14.3 Knowledge Store: Marketsandmarkets� Subscription Portal
14.4 Available Customizations
14.5 Related Reports
14.6 Author Details
List of Tables (90 Tables)
Table 1 Number of New Leukemia Cases, By Region
Table 2 Acute Lymphocytic Leukemia Patients in Us
Table 3 Leukemia Therapeutics Market, By Leukemia Type, 2017�2024 (USD Million)
Table 4 Chronic Myeloid Leukemia Market, By Region, 2017�2024 (USD Million)
Table 5 Chronic Lymphocytic Leukemia Market, By Region, 2017�2024 (USD Million)
Table 6 Acute Lymphocytic Leukemia Market, By Region, 2017�2024 (USD Million )
Table 7 Acute Myeloid Leukemia Market, By Region, 2017�2024 (USD Million)
Table 8 Leukemia Therapeutics Market, By Treatment Type, 2017�2024 (USD Million)
Table 9 Targeted Drugs and Immunotherapy Market for Leukemia, By Region, 2017�2024 (USD Million)
Table 10 Targeted Drugs and Immunotherapy Market, By Leukemia Type, 2017�2024 (USD Million)
Table 11 Targeted Drugs and Immunotherapy Market for Acute Lymphocytic Leukemia, By Region, 2017�2024 (USD Million)
Table 12 Targeted Drugs and Immunotherapy Market for Chronic Lymphocytic Leukemia, By Region, 2017�2024 (USD Million)
Table 13 Targeted Drugs and Immunotherapy Market for Chronic Myeloid Leukemia, By Region, 2017�2024 (USD Million)
Table 14 Targeted Drugs and Immunotherapy Market for Acute Myeloid Leukemia, By Region, 2017�2024 (USD Million)
Table 15 Few Examples of Chemotherapy Drugs
Table 16 Chemotherapy Market for Leukemia, By Region, 2017�2024 (USD Million)
Table 17 Chemotherapy Market, By Leukemia Type, 2017�2024 (USD Million)
Table 18 Chemotherapy Market for Acute Lymphocytic Leukemia, By Region, 2017�2024 (USD Million)
Table 19 Chemotherapy Market for Chronic Lymphocytic Leukemia, By Region, 2017�2024 (USD Million)
Table 20 Chemotherapy Market for Chronic Myeloid Leukemia, By Region, 2017�2024 (USD Million)
Table 21 Chemotherapy Market for Acute Myeloid Leukemia, By Region, 2017�2024 (USD Million)
Table 22 Leukemia Therapeutics Market, By Molecule Type, 2017�2024 (USD Million)
Table 23 Few Important Small Molecules Used to Treat Different Leukemia Type
Table 24 Leukemia Therapeutics Market for Small Molecules, By Region, 2017�2024 (USD Million)
Table 25 Few Important Biologics for the Treatment of Different Leukemia Type
Table 26 Leukemia Therapeutics Market for Biologics, By Region, 2017�2024 (USD Million)
Table 27 Leukemia Therapeutics Market, By Mode of Administration, 2017�2024 (USD Million)
Table 28 Leukemia Therapeutics Market for Oral Mode of Administration, By Region, 2017�2024 (USD Million)
Table 29 Leukemia Therapeutics Market for Injectable Mode of Administration, By Region, 2017�2024 (USD Million)
Table 30 Leukemia at A Glance (US)
Table 31 Global Leukemia Cases (2018), By Country and Gender & Forecast (2020)
Table 32 Leukemia Incidence and Deaths, By Gender (2018)
Table 33 Leukemia Therapeutics Market, By Gender, 2017�2024 (USD Million)
Table 34 Leukemia Therapeutics Market for Males, By Region, 2017�2024 (USD Million)
Table 35 Leukemia Therapeutics Market for Females, By Region, 2017�2024 (USD Million)
Table 36 Leukemia Therapeutics Market, By Region, 2017�2024 (USD Million)
Table 37 North America: Leukemia Therapeutics Market, By Country, 2017�2024 (USD Million)
Table 38 North America: Leukemia Therapeutics Market, By Leukemia Type, 2017�2024 (USD Million)
Table 39 North America: Leukemia Therapeutics Market, By Treatment Type, 2017�2024 (USD Million)
Table 40 North America: Leukemia Therapeutics Market, By Gender, 2017�2024 (USD Million)
Table 41 US: Leukemia at A Glance
Table 42 US: Leukemia, By Type (2017 vs 2018)
Table 43 US: Leukemia New Cases & Deaths, By State (2019)
Table 44 US: Leukemia Therapeutics Market, By Leukemia Type, 2017�2024 (USD Million)
Table 45 US: Leukemia Therapeutics Market, By Treatment Type, 2017�2024 (USD Million)
Table 46 US: Leukemia Therapeutics Market, By Gender, 2017�2024 (USD Million)
Table 47 Canada: Leukemia Therapeutics Market, By Leukemia Type, 2017�2024 (USD Million)
Table 48 Canada: Leukemia Therapeutics Market, By Treatment Type, 2017�2024 (USD Million)
Table 49 Canada: Leukemia Therapeutics Market, By Gender, 2017�2024 (USD Million)
Table 50 Research Funding: European Overview
Table 51 Europe: Leukemia Therapeutics Market, By Country, 2017�2024 (USD Million)
Table 52 Europe: Leukemia Therapeutics Market, By Leukemia Type, 2017�2024 (USD Million)
Table 53 Europe: Leukemia Therapeutics Market, By Treatment Type, 2017�2024 (USD Million)
Table 54 Europe: Leukemia Therapeutics Market, By Gender, 2017�2024 (USD Million)
Table 55 Germany: Leukemia Therapeutics Market, By Leukemia Type, 2017�2024 (USD Million)
Table 56 Germany: Leukemia Therapeutics Market, By Treatment Type, 2017�2024 (USD Million)
Table 57 Germany: Leukemia Therapeutics Market, By Gender, 2017�2024 (USD Million)
Table 58 UK: Number of New Cases, Crude, and Age-Standardized (AS) Incidence Rate Per 100,000 Population (Acute Lymphocytic Leukemia)
Table 59 UK: Number of New Cases, Crude, and Age-Standardized (AS) Incidence Rates Per 100,000 Population (Chronic Lymphocytic Leukemia)
Table 60 UK: Number of New Cases, Crude, and Age-Standardized (AS) Incidence Rates Per 100,000 Population (Acute Myeloid Leukemia)
Table 61 UK: Number of New Cases, Crude, and Age-Standardized (AS) Incidence Rates Per 100,000 Population (Chronic Myeloid Leukemia)
Table 62 UK: Leukemia Therapeutics Market, By Leukemia Type, 2017�2024 (USD Million)
Table 63 UK: Leukemia Therapeutics Market, By Treatment Type, 2017�2024 (USD Million)
Table 64 UK: Leukemia Therapeutics Market, By Gender, 2017�2024 (USD Million)
Table 65 France: Leukemia Therapeutics Market, By Leukemia Type, 2017�2024 (USD Million)
Table 66 France: Leukemia Therapeutics Market, By Treatment Type, 2017�2024 (USD Million)
Table 67 France: Leukemia Therapeutics Market, By Gender, 2017�2024 (USD Million)
Table 68 RoE: Leukemia Therapeutics Market, By Leukemia Type, 2017�2024 (USD Million)
Table 69 RoE: Leukemia Therapeutics Market, By Treatment Type, 2017�2024 (USD Million)
Table 70 RoE: Leukemia Therapeutics Market, By Gender, 2017�2024 (USD Million)
Table 71 APAC: Leukemia Therapeutics Market, By Country, 2017�2024 (USD Million)
Table 72 APAC: Leukemia Therapeutics Market, By Leukemia Type, 2017�2024 (USD Million)
Table 73 APAC: Leukemia Therapeutics Market, By Treatment Type, 2017�2024 (USD Million)
Table 74 APAC: Leukemia Therapeutics Market, By Gender, 2017�2024 (USD Million)
Table 75 Japan: Leukemia Therapeutics Market, By Leukemia Type, 2017�2024 (USD Million)
Table 76 Japan: Leukemia Therapeutics Market, By Treatment Type, 2017�2024 (USD Million)
Table 77 Japan: Leukemia Therapeutics Market, By Gender, 2017�2024 (USD Million)
Table 78 China: Leukemia Therapeutics Market, By Leukemia Type, 2017�2024 (USD Million)
Table 79 China: Leukemia Therapeutics Market, By Treatment Type, 2017�2024 (USD Million)
Table 80 China: Leukemia Therapeutics Market, By Gender, 2017�2024 (USD Million)
Table 81 India: Leukemia Therapeutics Market, By Leukemia Type, 2017�2024 (USD Million)
Table 82 India: Leukemia Therapeutics Market, By Treatment Type, 2017�2024 (USD Million)
Table 83 India: Leukemia Therapeutics Market, By Gender, 2017�2024 (USD Million)
Table 84 RoAPAC: Leukemia Therapeutics Market, By Leukemia Type, 2017�2024 (USD Million)
Table 85 RoAPAC: Leukemia Therapeutics Market, By Treatment Type, 2017�2024 (USD Million)
Table 86 RoAPAC: Leukemia Therapeutics Market, By Gender, 2017�2024 (USD Million)
Table 87 RoW: Leukemia Therapeutics Market, By Leukemia Type, 2017�2024 (USD Million)
Table 88 RoW: Leukemia Therapeutics Market, By Treatment Type, 2017�2024 (USD Million)
Table 89 RoW: Leukemia Therapeutics Market, By Gender, 2017�2024 (USD Million)
Table 90 Leukemia Therapeutics Market Ranking By Key Player, 2018
List of Figures (29 Figures)
Figure 1 Research Design
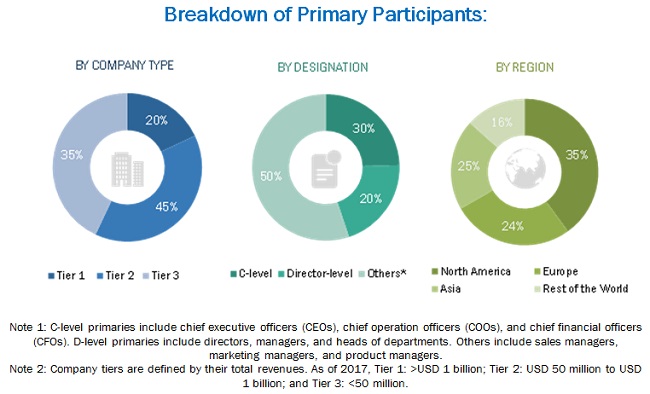
Figure 2 Breakdown of Primary Interviews: By Company Type, Designation, and Region
Figure 3 Leukemia Therapeutics Market: Bottom-Up Approach
Figure 4 Leukemia Therapeutics Market: Top-Down Approach
Figure 5 Data Triangulation Methodology
Figure 6 Leukemia Therapeutics Market, By Treatment Type, 2019 vs 2024 (USD Million)
Figure 7 Leukemia Therapeutics Market, By Leukemia Type, 2019 vs 2024 (USD Million)
Figure 8 Leukemia Therapeutics Market, By Mode of Administration, 2019 vs 2024 (USD Million)
Figure 9 Leukemia Therapeutics Market, By Molecule Type, 2019 vs 2024 (USD Million)
Figure 10 Leukemia Therapeutics Market, By Gender, 2019 vs 2024 (USD Million)
Figure 11 Leukemia Therapeutics Market, By Region, 2019 vs 2024 (USD Million)
Figure 12 High Prevalence Rate of Leukemia to Drive Market Growth
Figure 13 Oral and Targeted Drugs & Immunotherapy Segments to Dominate the Market in 2019
Figure 14 US to Register A Higher Growth Rate During the Forecast Period
Figure 15 Leukemia Therapeutics Market: Drivers, Restraints, and Opportunities
Figure 16 North America: Leukemia Therapeutics Market Snapshot
Figure 17 Key Developments in the Leukemia Therapeutics Market (2016-2018)
Figure 18 MnM Dive-Vendor Comparison Matrix: Leukemia Therapeutics Market
Figure 19 MnM Dive-Vendor Comparison Matrix for Start-Ups: Leukemia Therapeutics Market
Figure 20 Novartis: Company Snapshot (2018)
Figure 21 AbbVie Inc.: Company Snapshot (2018)
Figure 22 Bristol-Myers Squibb: Company Snapshot (2018)
Figure 23 F. Hoffmann-La Roche: Company Snapshot (2018)
Figure 24 Sanofi: Company Snapshot (2018)
Figure 25 Pfizer: Company Snapshot (2018)
Figure 26 Amgen: Company Snapshot (2018)
Figure 27 Gilead Sciences: Company Snapshot (2018)
Figure 28 Takeda: Company Snapshot (2018)
Figure 29 Celgene: Company Snapshot (2018)
The study involved four major activities in estimating the current size of the leukemia therapeutics market. Exhaustive secondary research was done to collect information on the market and its subsegments. The next step was to validate these findings, assumptions, and sizing with industry experts across the value chain through primary research. Both top-down and bottom-up approaches were employed to estimate the complete market size. Thereafter, market breakdown and data triangulation procedures were used to estimate the market size of the segments and subsegments.
Secondary Research
In the secondary research process, various secondary sources such as annual reports, press releases & investor presentations of companies, white papers, certified publications, articles by recognized authors, gold-standard & silver-standard websites, regulatory bodies, and databases (such as D&B Hoovers, Bloomberg Business, and Factiva) were referred to in order to identify and collect information for this study.
Primary Research
Several stakeholders such as leukemia drug manufacturers, vendors, distributors and scientists, researchers, oncologist, and doctors from hospitals and clinics were consulted for this report. The demand side of this market is characterized by the significant use of immunotherapies and targeted drugs for leukemia treatment owing to the increasing incidence rate of leukemia across the globe. Various primary sources from both the supply and demand sides of the market were interviewed to obtain qualitative and quantitative information. The following is a breakdown of the primary respondents:
To know about the assumptions considered for the study, download the pdf brochure
Market Size Estimation
Both top-down and bottom-up approaches were used to estimate and validate the total size of the leukemia therapeutics market. These methods were also used extensively to estimate the size of various subsegments in the market. The research methodology used to estimate the market size includes the following:
- The key players in the industry and markets have been identified through extensive secondary research
- The industry�s supply chain and market size, in terms of value, have been determined through primary and secondary research processes
- All percentage shares, splits, and breakdowns have been determined using secondary sources and verified through primary sources
Data Triangulation
After arriving at the overall market size�using the market size estimation processes�the market was split into several segments and subsegments. To complete the overall market engineering process and arrive at the exact statistics of each market segment and subsegment, the data triangulation and market breakdown procedures were employed, wherever applicable. The data was triangulated by studying various factors and trends from both the demand and supply sides in the leukemia industry.
Report Objectives
- To define, describe, and forecast the leukemia therapeutics market on the basis of type, application, and region
- To provide detailed information regarding the major factors influencing market growth (such as drivers, restraints, and opportunities)
- To strategically analyze micromarkets with respect to individual growth trends, prospects, and contributions to the overall leukemia therapeutics market
- To analyze market opportunities for stakeholders and provide details of the competitive landscape for key players
- To forecast the size of the market segments in four geographical regions�North America, Europe, the Asia Pacific, and the Rest of the World (RoW)
- To profile the key players and comprehensively analyze their product portfolios, market positions, and core competencies
- To track and analyze competitive developments such as product launches, partnerships, expansions, and acquisitions in the leukemia therapeutics market
Available Customizations:
With the given market data, MarketsandMarkets offers customizations as per the company�s specific needs. The following customization options are available for the report:
- Product Analysis: Product matrix, which gives a detailed comparison of the product portfolios of each company
- Geographic Analysis: Further breakdown of the European, Asia Pacific, and the Rest of the World segments into their respective countries for this market
- Company Information: Detailed analysis and profiling of additional market players (up to 5)
- Volume Data: Customization options for volume data (number of units sold) and customization options for volume data (number of tests)
- Opportunities Assessment: A detailed report underlining the various growth opportunities presented in the marke

 Generating Response ...


Growth opportunities and latent adjacency in Leukemia Therapeutics Market