Clean-in-Place Market by System Type (Single-Use and Reuse CIP Systems), Offering (Single-Tank Systems; Two-Tank Systems; Multi-Tank Systems), End-User Industry (Food; Dairy; Pharmaceuticals), and Geography - Global Forecast 2035


The Clean in Place market is witnessing significant transformation driven by technological advancements, increasing emphasis on hygiene, and regulatory mandates across industries such as food, dairy, and pharmaceuticals. Clean in Place systems are designed to automatically clean and sanitize equipment and process pipelines without the need for manual disassembly. These systems are essential in industries that require stringent cleaning protocols to prevent contamination and ensure product quality. Over the forecast period from 2025 to 2035, the Clean in Place market is projected to grow steadily as manufacturers adopt more advanced systems to enhance operational efficiency and comply with global hygiene standards.
The market is segmented by system type into single use and reuse systems, by offering into single tank systems, two tank systems, and multi tank systems, by end user industry into food, dairy, and pharmaceuticals, and by geography. Each of these segments plays a critical role in shaping the future trajectory of the Clean in Place market.
Market Overview and Growth Drivers
The global Clean in Place market is experiencing robust growth due to a combination of regulatory pressure, technological innovation, and the need for efficient cleaning processes in production environments. As manufacturing facilities expand and automation becomes a central component of modern production, Clean in Place systems are increasingly preferred over manual cleaning methods. These systems reduce downtime, ensure consistent cleaning performance, and minimize the risk of contamination.
One of the primary growth drivers is the increasing focus on food safety and hygiene. Regulatory agencies across the world are implementing stricter norms for cleanliness in production facilities, particularly in sectors like food and pharmaceuticals where contamination can have serious consequences. Manufacturers are investing in advanced Clean in Place systems to meet these standards and maintain certifications.
Technological advancements in sensors, flow control, and data analytics are also driving market growth. Modern Clean in Place systems can be integrated with control systems to provide real time monitoring, automated cleaning cycles, and data logging for compliance purposes. These innovations improve efficiency, reduce water and chemical usage, and lower operational costs, making Clean in Place systems more attractive to end users.
Additionally, sustainability concerns are encouraging companies to adopt systems that reduce water and energy consumption. Reuse systems, in particular, allow manufacturers to recycle cleaning solutions, leading to significant cost savings and environmental benefits. This focus on resource efficiency is expected to boost demand across industries.
Market Segmentation by System Type
Single Use Systems
Single use Clean in Place systems are designed to use cleaning solutions once and then discard them. These systems are relatively simple and cost effective, making them ideal for smaller facilities or applications where cleaning requirements are not highly complex. They are commonly used in industries where batch production is prevalent and where the risk of cross contamination between product runs is low.
Single use systems are valued for their ease of installation and low upfront cost. They require minimal infrastructure and can be integrated into existing production lines with relative ease. However, the drawback of single use systems lies in their higher operating costs over time due to the continuous need for fresh cleaning solutions and water. In addition, the environmental impact of disposing of cleaning chemicals after each use is a concern in regions with strict waste disposal regulations.
Reuse Systems
Reuse Clean in Place systems, on the other hand, are designed to collect, filter, and reuse cleaning solutions multiple times. These systems are more complex and require larger infrastructure investments, but they offer significant long term savings. Reuse systems are particularly advantageous in large production facilities where cleaning cycles are frequent and water and chemical consumption can be substantial.
The ability to recycle cleaning solutions makes reuse systems highly sustainable. They are equipped with filtration and treatment mechanisms to ensure the cleaning solution remains effective over multiple cycles. This reduces both water consumption and chemical waste, aligning with sustainability goals and regulatory standards. Industries such as dairy and pharmaceuticals, where hygiene standards are extremely high, often prefer reuse systems due to their reliability, cost efficiency, and environmental benefits.
As global industries increasingly prioritize sustainability, reuse systems are expected to capture a larger share of the market over the forecast period.
Market Segmentation by Offering
Single Tank Systems
Single tank Clean in Place systems are the simplest configuration, consisting of a single tank that stores the cleaning solution. They are typically used in applications with basic cleaning requirements where a single cleaning solution is sufficient for the entire cycle. Single tank systems are compact, easy to maintain, and well suited for small production facilities or specific cleaning tasks within larger operations.
The growing number of small and medium sized enterprises in the food and beverage industry is contributing to the demand for single tank systems. These businesses require reliable cleaning solutions without the complexity or cost of multi tank configurations.
Two Tank Systems
Two tank Clean in Place systems include separate tanks for cleaning solutions and rinse water. This allows for more efficient cleaning cycles as the system can switch between cleaning and rinsing phases without the need for manual intervention. Two tank systems provide improved cleaning performance compared to single tank systems and are suitable for medium sized facilities with moderate cleaning requirements.
The use of two tank systems is increasing in dairy and food processing plants where thorough rinsing is essential to prevent residue buildup and contamination. These systems strike a balance between cost, performance, and operational flexibility, making them a popular choice for many manufacturers.
Multi Tank Systems
Multi tank Clean in Place systems represent the most advanced configuration. They include multiple tanks for various cleaning agents, rinse water, and sometimes recovery solutions. These systems allow for highly efficient and automated cleaning cycles tailored to specific equipment and product types. Multi tank systems are commonly used in large scale production facilities with complex cleaning requirements, such as pharmaceutical manufacturing plants and large dairy processing facilities.
The advantage of multi tank systems lies in their ability to handle different cleaning solutions for different stages of the cleaning process, resulting in thorough and consistent cleaning. They also support advanced features such as solution recovery and reconditioning, further reducing water and chemical usage. Although the initial investment is higher, the operational savings and performance benefits often justify the cost for large operations.
Market Segmentation by End User Industry
Food Industry
The food industry is one of the largest end users of Clean in Place systems. Ensuring hygiene and preventing contamination are critical in food processing, where even minor lapses can lead to product recalls, regulatory action, and damage to brand reputation. Clean in Place systems allow food manufacturers to automate their cleaning processes, ensuring consistent results and compliance with food safety standards.
Rising consumer awareness about food safety, combined with regulatory pressure from agencies such as the Food and Drug Administration and European Food Safety Authority, is driving investments in advanced cleaning technologies. The expansion of the processed food sector in emerging economies is also boosting demand for Clean in Place systems as new facilities adopt modern hygiene practices from the outset.
Dairy Industry
The dairy industry has some of the most stringent hygiene requirements due to the perishable nature of its products. Contamination can quickly lead to spoilage, making thorough cleaning essential. Clean in Place systems are integral to dairy processing operations, ensuring that equipment such as pasteurizers, storage tanks, and pipelines remain free of residue and bacteria.
Reuse systems and multi tank configurations are particularly common in the dairy industry because of their ability to handle frequent cleaning cycles efficiently. As dairy production expands globally, especially in regions like Asia Pacific and Latin America, the adoption of modern Clean in Place systems is expected to accelerate.
Pharmaceutical Industry
The pharmaceutical industry requires an exceptionally high level of cleanliness to ensure product safety and efficacy. Any contamination in pharmaceutical manufacturing can compromise product quality and lead to severe regulatory consequences. Clean in Place systems are widely used in pharmaceutical plants to clean reactors, fermenters, and other process equipment between production runs.
Pharmaceutical companies typically invest in advanced multi tank and reuse systems that offer precise control over cleaning parameters and full validation capabilities. Integration with automation systems and compliance with Good Manufacturing Practices are critical factors in the design and implementation of pharmaceutical Clean in Place systems.
The increasing production of biologics and sterile products is further driving the need for sophisticated cleaning solutions in the pharmaceutical sector.
Market Segmentation by Geography
The Clean in Place market is geographically diverse, with varying adoption rates and growth drivers across regions.
North America
North America holds a significant share of the Clean in Place market, driven by strict regulatory frameworks and advanced manufacturing practices. The food, dairy, and pharmaceutical industries in the region are mature and highly automated, creating strong demand for efficient cleaning systems. Additionally, the presence of leading equipment manufacturers and technological innovators contributes to the growth of the market in this region.
Europe
Europe is another major market for Clean in Place systems, supported by stringent hygiene regulations and a strong focus on sustainability. European manufacturers are increasingly adopting reuse systems and multi tank configurations to minimize water and chemical consumption. The dairy and food processing sectors are particularly influential in driving demand.
Asia Pacific
The Asia Pacific region is expected to witness the fastest growth during the forecast period. Rapid industrialization, expanding food and beverage production, and increasing regulatory emphasis on hygiene are driving the adoption of Clean in Place systems. Countries such as China, India, and Southeast Asian nations are investing in modern manufacturing facilities equipped with advanced cleaning technologies.
The growing pharmaceutical industry in the region also presents significant opportunities for Clean in Place system suppliers, as companies upgrade their facilities to meet international standards.
Latin America and Middle East and Africa
Latin America and the Middle East and Africa are emerging markets for Clean in Place systems. Growth in these regions is driven by expanding food and dairy industries and increasing awareness of hygiene standards. While adoption rates are currently lower compared to developed regions, rising investments in manufacturing infrastructure are expected to fuel steady growth in the coming years.
Competitive Landscape
The Clean in Place market is competitive, with numerous global and regional players offering a wide range of systems and solutions. Leading companies are focusing on innovation, sustainability, and integration capabilities to differentiate their offerings. Key strategies include the development of energy efficient and water saving systems, integration with digital monitoring platforms, and customization to meet specific industry requirements.
Mergers and acquisitions, strategic partnerships, and expansion into emerging markets are common strategies as companies seek to strengthen their market positions. The growing emphasis on smart manufacturing and the Industrial Internet of Things is also leading to the development of intelligent Clean in Place systems capable of predictive maintenance and performance optimization.
Future Outlook
The future of the Clean in Place market looks promising as industries continue to prioritize hygiene, efficiency, and sustainability. Technological innovations will play a crucial role in shaping the next generation of systems. Developments in sensors, data analytics, and control systems will enable more precise and automated cleaning processes.
Sustainability will remain a central theme, with manufacturers focusing on reducing water and chemical usage through advanced reuse systems and recovery technologies. Regulatory frameworks are expected to become even more stringent, further driving demand for reliable and compliant cleaning solutions.
Emerging markets will offer significant growth opportunities as industries modernize their facilities and adopt global hygiene standards. Companies that can provide cost effective, scalable, and sustainable Clean in Place solutions will be well positioned to capitalize on these opportunities.
Key Market Players
Tetra Pak International (Switzerland), GEA Group (Germany), Sani-Matic (US), Alfa Laval (Sweden), SPX FLOW (US), Krones AG (Germany), KHS GmbH (Germany), Melegari Manghi (Italy), Centec GmbH (Germany), and Millitec Food Systems (UK) are among a few major players in the clean-in-place market. These players are increasingly undertaking acquisitions and product launches to develop and introduce new technologies and products in the market.
Clean-in-Place Market Report Scope:
This research report categorizes the clean-in-place market by System Type, Offering, End-user Industry, and Region.
Based on System Type, the Clean-in-Place Market been Segmented as below:
- Single-use CIP Systems
- Reuse CIP Systems
Based on Offering, the Clean-in-Place Market been Segmented as below:
- Single-Tank Systems
- Two-Tank Systems
- Multi-Tank Systems
- Sensors
- Spray Balls, Tank Washers, And Nozzles
- Others (CIP Air Eliminators and Air Vents)
Based on End-User Industry, the Clean-in-Place Market been Segmented as below:
- Food
- Dairy
- Pharmaceuticals
- Brewery and Beverages
- Others (Cosmetics, Industrial Wastewater, and Oil and Petrochemicals)
Based on Region, the Clean-in-Place Market been Segmented as below:
-
North America
- US
- Canada
- Mexico
-
Europe
- Germany
- UK
- France
- Italy
- Rest of Europe (Spain, Russia, Greece, Switzerland, and the Netherlands, and other Eastern European countries,)
-
Asia Pacific (APAC)
- China
- Japan
- India
- South Korea
- Rest of APAC (Australia, Singapore, Indonesia, the Philippines, Thailand, and Malaysia)
-
Rest of the World (RoW)
- Middle East and Africa
- South America
Recent Developments
- In July 2018, SPX FLOW (US) launched a new range of mix proof hygienic valves. This next-generation D4 Series allows extensive cleaning of product contact surfaces and helps reduce operational cost by minimizing CIP losses.
- In February 2018, GEA Group (Germany) developed double-seat valves, which can be used in dairy processing and are integrated with electronic low-emission flip-flop (LEFF) water-economizing function. This flip-flop control in GEA valve heads can save 90% of CIP media.
- In May 2017, Krones AG (Germany) acquired Javlyn (US), a provider of process systems for the food, dairy, chemicals, pharmaceuticals, and beverages industries. With this acquisition, Krones strengthened its process technology footprint in the US.
Critical questions would be as follows:
- Where will all these developments take the industry in the mid-to-long term?
- What are the upcoming industry applications for clean-in-place?
- Which region provides good opportunities for the growth of the clean-in-place market?
- What are new end-use application areas that companies in the clean-in-place market can explore?
- Who are the key market players, and how intense is the competition?
To speak to our analyst for a discussion on the above findings, click Speak to Analyst
 Exclusive indicates content/data unique to MarketsandMarkets and not available with any competitors.
Table of Contents
1 Introduction (Page No. - 15)
1.1 Study Objectives
1.2 Definition
1.3 Study Scope
1.3.1 Geographic Scope
1.4 Years Considered
1.5 Currency
1.6 Stakeholders
2 Research Methodology (Page No. - 18)
2.1 Research Data
2.1.1 Secondary Data
2.1.1.1 Secondary Sources
2.1.2 Primary Data
2.1.2.1 Breakdown of Primary Interviews
2.1.2.2 Sampling Techniques and Data Collection Methods
2.1.2.3 Primary Sources
2.1.2.4 Key Industry Insights
2.2 Market Size Estimation
2.2.1 Bottom-Up Approach
2.2.2 Top-Down Approach
2.3 clean-in-place Market Breakdown and Data Triangulation
2.4 Research Assumptions
3 Executive Summary (Page No. - 26)
4 Premium Insights (Page No. - 30)
4.1 Attractive Opportunities in CIP Market
4.2 CIP Market, By End-User Industry and Region
4.3 CIP Market, By Offering
4.4 CIP Market in APAC, By End-User Industry and Country
4.5 Geographic Analysis
5 clean-in-place Market Overview (Page No. - 33)
5.1 Introduction
5.2 Value Chain Analysis
5.3 clean-in-place Market Dynamics
5.3.1 Drivers
5.3.1.1 Advantages of CIP Systems
5.3.1.2 Increased Use of CIP Systems in Pharma Industry
5.3.1.3 High Demand for Processed and Convenience Food and Dairy Products, as Well as for Beverages
5.3.2 Restraints
5.3.2.1 High Cost of Operation
5.3.3 Opportunities
5.3.3.1 Rapid Automation of Processing Plants
5.3.3.2 Stringent Government Policies for Manufacturing Companies to Comply With Food Hygiene and Safety Standards
5.3.4 Challenges
5.3.4.1 Physical Limitation of Processing Equipment
5.3.4.2 Dearth of Qualified and Experienced Operators
6 CIP Market, By System Type (Page No. - 38)
6.1 Introduction
6.2 Single-Use CIP Systems
6.2.1 The Cleaning Media in Single-Use CIP Systems is Used Only Once and Then Discharged to Drain After the Cleaning Process
6.3 Reuse CIP Systems
6.3.1 The Cleaning Media in Reuse CIP Systems is Recirculated as Required Until the Cleaning Cycle is Complete
7 CIP Market, By Offering (Page No. - 43)
7.1 Introduction
7.2 Single-Tank Systems
7.2.1 Single-Tank Systems are Typically Designed to Minimize Risk of Cross-Contamination
7.3 Two-Tank Systems
7.3.1 Two-Tank Systems Reduce Water Consumption as These Use Optimum Quantity of Water
7.4 Multi-Tank Systems
7.4.1 Multi-Tank Systems are Highly Efficient, Economical, and Sustainable Solutions
7.5 Sensors
7.5.1 Sensors Help Simplify CIP Process
7.6 Spray Balls, Tank Washers, and Nozzles
7.6.1 Spray Balls, Tank Washers, and Nozzles Offer Better Cleanability and Reduction in Operating Cost
7.7 Others
8 CIP Market, By End-User Industry (Page No. - 48)
8.1 Introduction
8.2 Food Industry
8.2.1 CIP Systems in Food Industry Ensure Physical, Chemical, Bacteriological, and Sterile Cleanliness
8.3 Dairy Industry
8.3.1 CIP in Dairy Industry Helps in Removing Organic Contamination
8.4 Pharmaceuticals Industry
8.4.1 CIP Systems Automate Essential Cleaning and Disinfection Processes in Pharmaceuticals Industry
8.5 Brewery and Beverages Industry
8.5.1 CIP Systems Remove Product Residues and Harmful Microorganisms
8.6 Others
9 Geographic Analysis (Page No. - 67)
9.1 Introduction
9.2 North America
9.2.1 Us
9.2.1.1 US Account for Largest Size of CIP Market in North America
9.2.2 Canada
9.2.2.1 Increasing Food Processing Industry in Canada Supports Growth of Canadian CIP Market
9.2.3 Mexico
9.2.3.1 Food Processing Sector in Mexico Drives CIP Market
9.3 Europe
9.3.1 Germany
9.3.1.1 Stringent Government Regulations Drive CIP Market Growth in Germany
9.3.2 Uk
9.3.2.1 Increasing Demand for Food Processing Equipment in UK Would Propel CIP Demand
9.3.3 France
9.3.3.1 Rising Demand for Packaged Food Propels Machinery and Equipment Demand for Food Processing in France
9.3.4 Italy
9.3.4.1 Major CIP Providers and Native Companies in Italy Drives CIP Market
9.3.5 Rest of Europe
9.4 APAC
9.4.1 China
9.4.1.1 China is World's Second-Largest Market for Pharmaceuticals
9.4.2 India
9.4.2.1 Vast Use of CIP Systems in Food, Dairy, and Pharma Industries to Boost CIP Market Growth in India
9.4.3 Japan
9.4.3.1 Government Standards and Laws Drive Adoption of CIP Systems in Japan
9.4.4 South Korea
9.4.4.1 Strong Food Processing Industry in South Korea Helps in CIP Market Growth
9.4.5 Rest of APAC
9.5 RoW
9.5.1 South America
9.5.1.1 CIP Market to Grow at Significant Rate in the Near Future Due to Economic Developments in South American Countries
9.5.2 Middle East and Africa
9.5.2.1 Increasing Demand for Processed Food, Dairy, and Pharma Products to Provide A Huge Opportunity for CIP Market Growth
10 Competitive Landscape (Page No. - 90)
10.1 Introduction
10.2 Ranking Analysis of Players, 2017
10.3 Competitive Scenario
10.3.1 Product Launches/Developments
10.3.2 Acquisitions
10.3.3 Expansions
11 Company Profiles (Page No. - 94)
11.1 Key Companies
(Business Overview, Products Offered, Recent Developments, SWOT Analysis, and MnM View)*
11.1.1 Tetra Pak International
11.1.2 GEA Group
11.1.3 Sani-Matic
11.1.4 Alfa Laval
11.1.5 SPX Flow
11.1.6 Krones Ag
11.1.7 KHS GmbH
11.1.8 Melegari Manghi
11.1.9 Centec GmbH
11.1.10 Millitec Food Systems
11.2 Other Key Companies
11.2.1 Filamatic
11.2.2 Sysbiotech
11.2.3 Bionet
11.2.4 Solaris Biotech Usa
11.2.5 Handtmann Armaturenfabrik
11.2.6 E. Bachiller B
11.2.7 Axomatic
11.2.8 Scanjet Systems
11.2.9 Azbil Telstar
11.2.10 GD Process Design
*Details on Business Overview, Products Offered, Recent Developments, SWOT Analysis, and MnM View Might Not Be Captured in Case of Unlisted Companies.
12 Appendix (Page No. - 121)
12.1 Insights of Industry Experts
12.2 Discussion Guide
12.3 Knowledge Store: Marketsandmarkets’ Subscription Portal
12.4 Available Customizations
12.5 Related Reports
12.6 Author Details
List of Tables (68 Tables)
Table 1 CIP Market, By System Type, 2015–2023 (USD Billion)
Table 2 CIP Market, By System Type, 2015–2023 (Thousand Units)
Table 3 Single-Use CIP Market, By End-User Industry, 2015–2023 (USD Million)
Table 4 Reuse CIP Market, By End-User Industry, 2015–2023 (USD Million)
Table 5 CIP Market, By Offering, 2015–2023 (USD Million)
Table 6 CIP Market, By End-User Industry, 2015–2023 (USD Billion)
Table 7 CIP Market for Food Industry, By System Type, 2015–2023 (USD Million)
Table 8 CIP Market for Food Industry, By Offering, 2015–2023 (USD Million)
Table 9 CIP Market for Food Industry, By Region, 2015–2023 (USD Million)
Table 10 CIP Market in North America for Food Industry, By Country, 2015–2023 (USD Million)
Table 11 CIP Market in Europe for Food Industry, By Country, 2015–2023 (USD Million)
Table 12 CIP Market in APAC for Food Industry, By Country, 2015–2023 (USD Million)
Table 13 CIP Market in RoW for Food Industry, By Region, 2015–2023 (USD Million)
Table 14 CIP Market for Dairy Industry, By System Type, 2015–2023 (USD Million)
Table 15 CIP Market for Dairy Industry, By Offering, 2015–2023 (USD Million)
Table 16 CIP Market for Dairy Industry, By Region, 2015–2023 (USD Million)
Table 17 CIP Market in North America for Dairy Industry, By Country, 2015–2023 (USD Million)
Table 18 CIP Market in Europe for Dairy Industry, By Country, 2015–2023 (USD Million)
Table 19 CIP Market in APAC for Dairy Industry, By Country, 2015–2023 (USD Million)
Table 20 CIP Market in RoW for Dairy Industry, By Region, 2015–2023 (USD Million)
Table 21 CIP Market for Pharmaceuticals Industry, By System Type, 2015–2023 (USD Million)
Table 22 CIP Market for Pharmaceuticals Industry, By Offering, 2015–2023 (USD Million)
Table 23 CIP Market for Pharmaceuticals Industry, By Region, 2015–2023 (USD Million)
Table 24 CIP Market in North America for Pharmaceuticals Industry, By Country, 2015–2023 (USD Million)
Table 25 CIP Market in Europe for Pharmaceuticals Industry, By Country, 2015–2023 (USD Million)
Table 26 CIP Market in APAC for Pharmaceuticals Industry, By Country, 2015–2023 (USD Million)
Table 27 CIP Market in RoW for Pharmaceuticals Industry, By Region, 2015–2023 (USD Million)
Table 28 CIP Market for Brewery and Beverages Industry, By System Type, 2015–2023 (USD Million)
Table 29 CIP Market for Brewery and Beverages Industry, By Offering, 2015–2023 (USD Million)
Table 30 CIP Market for Brewery and Beverages Industry, By Region, 2015–2023 (USD Million)
Table 31 CIP Market in North America for Brewery and Beverages Industry, By Country, 2015–2023 (USD Million)
Table 32 CIP Market in Europe for Brewery and Beverages Industry, By Country, 2015–2023 (USD Million)
Table 33 CIP Market in APAC for Brewery and Beverages Industry, By Country, 2015–2023 (USD Million)
Table 34 CIP Market in RoW for Brewery and Beverages Industry, By Region, 2015–2023 (USD Million)
Table 35 CIP Market for Other Industries, By System Type, 2015–2023 (USD Million)
Table 36 CIP Market for Other Industries, By Offering, 2015–2023 (USD Million)
Table 37 CIP Market for Other Industries, By Region, 2015–2023 (USD Million)
Table 38 CIP Market in North America for Other Industries, By Country, 2015–2023 (USD Million)
Table 39 CIP Market in Europe for Other Industries, By Country, 2015–2023 (USD Million)
Table 40 CIP Market in APAC for Other Industries, By Country, 2015–2023 (USD Million)
Table 41 CIP Market in RoW for Other Industries, By Region, 2015–2023 (USD Million)
Table 42 CIP Market, By Region, 2015–2023 (USD Billion)
Table 43 CIP Market in North America, By Country, 2015–2023 (USD Million)
Table 44 CIP Market in North America, By End-User Industry, 2015–2023 (USD Million)
Table 45 CIP Market in US, By End-User Industry, 2015–2023 (USD Million)
Table 46 CIP Market in Canada, By End-User Industry, 2015–2023 (USD Million)
Table 47 CIP Market in Mexico, By End-User Industry, 2015–2023 (USD Million)
Table 48 CIP Market in Europe, By Country, 2015–2023 (USD Million)
Table 49 clean-in-place Market in Europe, By End-User Industry, 2015–2023 (USD Million)
Table 50 clean-in-place Market in Germany, By End-User Industry, 2015–2023 (USD Million)
Table 51 clean-in-place Market in UK, By End-User Industry, 2015–2023 (USD Million)
Table 52 clean-in-place Market in France, By End-User Industry, 2015–2023 (USD Million)
Table 53 clean-in-place Market in Italy, By End-User Industry, 2015–2023 (USD Million)
Table 54 clean-in-place Market in RoE, By End-User Industry, 2015–2023 (USD Million)
Table 55 CIP Market in APAC, By Country, 2015–2023 (USD Million)
Table 56 clean-in-place Market in APAC, By End-User Industry, 2015–2023 (USD Million)
Table 57 clean-in-place Market in China, By End-User Industry, 2015–2023 (USD Million)
Table 58 clean-in-place Market in India, By End-User Industry, 2015–2023 (USD Million)
Table 59 clean-in-place Market in Japan, By End-User Industry, 2015–2023 (USD Million)
Table 60 clean-in-place Market in South Korea, By End-User Industry, 2015–2023 (USD Million)
Table 61 clean-in-place Market in RoAPAC, By End-User Industry, 2015–2023 (USD Million)
Table 62 clean-in-place Market in RoW, By Region, 2015–2023 (USD Million)
Table 63 clean-in-place Market in RoW, By End-User Industry, 2015–2023 (USD Million)
Table 64 clean-in-place Market in South America, By End-User Industry, 2015–2023 (USD Million)
Table 65 clean-in-place Market in Middle East and Africa, By End-User Industry, 2015–2023 (USD Million)
Table 66 Product Launches/Developments (2017–2018)
Table 67 Acquisitions (2016–2018)
Table 68 Expansions (2018)
List of Figures (39 Figures)
Figure 1 Markets Covered
Figure 2 Clean-In-Place Market: Research Design
Figure 3 Bottom-Up Approach
Figure 4 Top-Down Approach
Figure 5 Market Breakdown and Data Triangulation
Figure 6 Process Flow of Market Size Estimation
Figure 7 CIP Market Size Analysis (2015–2023)
Figure 8 Food Industry to Exhibit Highest CAGR in CIP Market During Forecast Period
Figure 9 Multi-Tank Systems to Hold Largest Share of CIP Market, Based on Offering, By 2023
Figure 10 APAC to Exhibit Highest CAGR From 2018 to 2023
Figure 11 Use of CIP in Food and Pharmaceuticals Industries Drives Market Growth
Figure 12 North America Held Largest Share of CIP Market for Pharmaceuticals Industry in 2017
Figure 13 Multi-Tank Systems to Hold Largest Size of CIP Market During Forecast Period
Figure 14 China Held Largest Share of CIP Market in APAC in 2017
Figure 15 China to Witness Highest CAGR in CIP Market From 2018 to 2023
Figure 16 Value Chain Analysis: CIP Market
Figure 17 CIP Market Growth is Driven By Advantages Offered By CIP Systems
Figure 18 Reuse Systems to Dominate CIP Market, in Terms of Value, During Forecast Period
Figure 19 Market for Reuse CIP Systems Used in Pharmaceuticals Industry to Grow at Highest CAGR During Forecast Period
Figure 20 Multi-Tank CIP Systems to Hold Largest Market Size During Forecast Period
Figure 21 Food Industry to Command CIP Market During Forecast Period
Figure 22 China to Lead CIP Market in APAC for Food Industry During Forecast Period
Figure 23 APAC to Exhibit Highest CAGR in CIP Market for Dairy Industry During Forecast Period
Figure 24 Multi-Tank Systems to Lead CIP Market for Brewery and Beverages Industry During Forecast Period
Figure 25 APAC to Exhibit Highest CAGR in CIP Market During 2018–2023
Figure 26 Snapshot of CIP Market in North America
Figure 27 Pharmaceuticals Industry to Dominate CIP Market in US From 2018 to 2023
Figure 28 Snapshot of CIP Market in Europe
Figure 29 Food Industry to Lead CIP Market in France Between 2018 and 2023
Figure 30 Snapshot of CIP Market in APAC
Figure 31 Dairy Industry to Hold Largest Size of Indian CIP Market By 2023
Figure 32 Key Developments in Clean-In-Place Market (2015–2018)
Figure 33 Ranking of Top 5 Players in Clean-In-Place Market in 2017
Figure 34 Tetra Pak International: Company Snapshot
Figure 35 GEA Group: Company Snapshot
Figure 36 Alfa Laval: Company Snapshot
Figure 37 SPX Flow: Company Snapshot
Figure 38 Krones AG: Company Snapshot
Figure 39 KHS GmbH: Company Snapshot
The study involved 4 major activities in estimating the current market size for clean-in-place. Exhaustive secondary research was done to collect information on the market, peer market, and parent market. The next step was to validate these findings, assumptions, and sizing with industry experts across value chain through primary research. Both top-down and bottom-up approaches have been employed to estimate the complete market size. After that market breakdown and data triangulation methods have been used to estimate the market size of segments and subsegments. Two basic sources of information—secondary and primary—have been used to identify and collect information for an extensive technical and commercial study of the clean-in-place market.
Secondary Research
The research methodology used to estimate and forecast the clean-in-place market begins with capturing data on revenues of key vendors in the market through secondary research. The secondary sources include company websites, magazines, industry news, associations, and databases (Factiva and Bloomberg). Vendor offerings have also been considered to determine the market segmentation. These secondary sources include annual reports, press releases and investor presentations of companies, white papers, certified publications, articles by recognized authors, gold standard and silver standard websites, food safety organizations, regulatory bodies, trade directories, and databases.
Primary Research
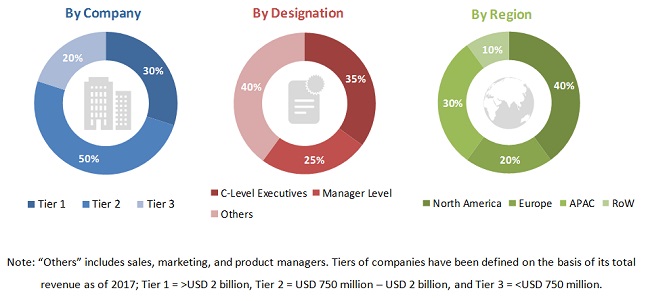
Primary sources mainly consist of several experts from the core and related industries, along with preferred suppliers, manufacturers, distributors, technology developers, alliances, standards, and certification organizations related to various segments of this industry’s value chain. They have been interviewed to understand, obtain, and verify critical information, as well as assess future market trends and prospects. Key players in the clean-in-place market have been identified through secondary research, and their market ranking has been determined through primary and secondary research. This research involves the study of the annual reports of market players for the identification of the top players and interviews with key opinion leaders, such as CEOs, and directors. The breakdown of primary respondents is provided below.
To know about the assumptions considered for the study, download the pdf brochure
Market Size Estimation
Both top-down and bottom-up approaches have been used to estimate and validate the total size of the clean-in-place market. These methods have been also used extensively to estimate the size of various subsegments in the market. The following research methodology has been used to estimate the market size:
- Key players in major industry and markets were identified through extensive secondary research.
- The CIP is offered in the market majorly from food processing and packaging equipment manufacturer such as Alfa Laval, TetraPak, and GEA Group, among others. There are also private companies offering CIP system such as Melegari Manghi, Bachiller, Handtmannn, and Axomatic, among others.
- The industry’s value chain and market size (in terms of value) have been determined through primary and secondary research processes.
- All percentage shares, splits, and breakdowns have been determined using secondary sources and verified through primary sources.
Data Triangulation
After arriving at the overall market size—using the estimation processes as explained above—the market was split into several segments and subsegments. To complete the overall market engineering process and arrive at the exact statistics for all the segments, subsegment, data triangulation, and market breakdown procedures were employed, wherever applicable. The data have been triangulated by studying various factors and trends from both demand and supply sides. The market has also been validated using both top-down and bottom-up approaches.
Report Objectives
- To describe and forecast the clean-in-place (CIP) market, in terms of value, segmented on the basis of system type, offering, end-user industry, and geography
- To describe and forecast the market, in terms of value, with regard to 4 main regions: Asia Pacific (APAC), Europe, North America, and Rest of the World (RoW) along with their respective countries
- To forecast the clean-in-place market for system types in terms of volume
- To provide detailed information regarding drivers, restraints, opportunities, and challenges pertaining to the said market
- To strategically analyze micromarkets with respect to individual growth trends, prospects, and contribution to the overall market
- To provide a detailed overview of the clean-in-place value chain
- To analyze opportunities in the market for stakeholders by identifying the high-growth segments of the clean-in-place ecosystem
- To profile key players in the clean-in-place market and comprehensively analyze their market ranking on the basis of revenue and core competencies
- To analyze competitive developments such as product launches, expansions, acquisitions, adopted by key market players in the clean-in-place
Available Customizations
Based on the given market data, MarketsandMarkets offers customizations in the reports according to the client’s specific requirements. The available customization options are as follows:
Geographic Analysis
- Further country-wise breakdown of the market in APAC, based on end-user industry, other than provided in the report
Company Information
- Detailed analysis and profiling of additional market players (Up to 5)


Growth opportunities and latent adjacency in Clean-in-Place Market