[190 Pages Report] The closed system transfer devices market is projected to reach USD 982 million by 2024 from USD 390 million in 2019, at a CAGR of 20.3%. Growth in this market is mainly driven by the rising prevalence of cancer, increasing number of oncology drug approvals, increasing use of closed system transfer devices to combat the harmful effects of cytotoxic or antineoplastic drugs, and improving regulatory guidelines regarding the safe handling and use of hazardous drugs.
On the basis of type, the membrane-to-membrane systems segment is expected to account for the largest share of the market in 2019. The large share and high growth of this segment can be attributed to their ease of operation and the lower risk of contamination associated with double-membrane containment systems. Also, these systems use a double membrane junction between the syringe and the medication vial or container to help isolate medications. This double membrane containment system provides an added layer of protection compared to needleless membranes, which boosts growth in this segment.
Based on technology, the diaphragm-based devices segment accounted for the largest share of the market. The large share of this segment is mainly due to the ease of operation and safety provided by these devices. The compartmentalized devices segment is expected to grow at the highest CAGR of 23.6% during the forecast period due to their lower cost.
Based on end user, the hospitals segment is expected to account for the largest share of the market in 2019. The large share and high growth of this segment are mainly due to the strong financial capabilities of hospitals for purchasing high-priced CSTDs as compared to oncology centers and clinics, large cancer patient pool, and the increasing need to comply with the regulatory guidelines established by the FDA and NIOSH regarding the safety of healthcare providers.
The market in the Asia Pacific is expected to grow at the highest CAGR during the forecast period. This is due to the rising incidence of cancer and the increasing demand for better healthcare services in developing economies such as India and China. In addition, the increasing focus of international players on emerging markets is further expected to drive the growth of this market in the APAC.
Prominent players in the global closed system transfer devices industry are Becton, Dickinson and Company (US), ICU Medical, Inc. (US), Equashield LLC. (US), B. Braun Melsungen AG (Germany), Corvida Medical (US), Yukon Medical (US), JMS Co., Ltd. (US), CODAN Medizinische Gerδte GmbH & Co KG (Germany), Baxter International, Inc. (US), VICTUS (US), and Caragen Ltd. (Ireland).
Report Metric |
Details |
Market Size Available for Years |
20172024 |
Base Year Considered |
2018 |
Forecast Period |
20192024 |
Forecast Units |
Value (USD) |
Segments Covered |
Closing Mechanism, Type, Component, Technology, End User, and Region |
Geographies Covered |
North America, Europe, APAC, Latin America, the Middle East, and Africa |
Companies Covered |
Becton, Dickinson and Company (US), ICU Medical, Inc. (US), Equashield LLC. (US), B. Braun Melsungen AG (Germany), Corvida Medical (US), Yukon Medical (US), JMS Co., Ltd. (US), CODAN Medizinische Gerδte GmbH & Co KG (Germany), Baxter International, Inc. (US), VICTUS (US), and Caragen Ltd. (Ireland) |
The research report categorizes the market into the following segments and subsegments:
Which is the leading product type of closed system transfer devices (CSTD)?
Based on the product type, the global closed system transfer devices (CSTD) market is segmented broadly into membrane-to-membrane systems and needleless systems. The membrane-to-membrane systems segment is expected to account for the largest share of the market in 2018. The large share and high growth of this segment can be attributed to their ease of operation and the lower risk of contamination associated with double-membrane containment systems. Also, these systems use a double membrane junction between the syringe and the medication vial or container to help isolate medications. This double membrane containment system provides an added layer of protection compared to needleless membranes, which boosts growth in this segment.
Which is the leading technology for closed system transfer devices?
Based on technology, the closed system transfer devices market is segmented into diaphragm-based devices, compartmentalized device and air cleaning/filtration devices. In 2018, the diaphragm-based devices segment accounted for the largest share of the market. The large share of this segment is mainly due to the ease of operation and safety provided by these devices.
Which is the leading end user for closed system transfer devices?
The end users of the closed system transfer devices market is segmented into hospitals, oncology centers and clinics and other end users. The hospitals segment is expected to account for the largest share of the market in 2018. The large share and high growth of this segment are mainly due to the strong financial capabilities of hospitals for purchasing high-priced CSTDs as compared to oncology centers and clinics, large cancer patient pool, and the increasing need to comply with the regulatory guidelines established by the FDA and NIOSH regarding the safety of healthcare providers.
Who are the key players operating in the closed system transfer devices market?
The prominent players operating in the closed system transfer devices market include Becton, Dickinson and Company (US), ICU Medical, Inc. (US), Equashield LLC. (US), B. Braun Melsungen AG (Germany), Corvida Medical (US), Yukon Medical (US), JMS Co., Ltd. (US), CODAN Medizinische Gerδte GmbH & Co KG (Germany), Baxter International, Inc. (US), VICTUS (US), and Caragen Ltd. (Ireland).
To speak to our analyst for a discussion on the above findings, click Speak to Analyst
Table of Contents
1 Introduction (Page No. - 20)
1.1 Objectives of the Study
1.2 Market Definition
1.3 Market Scope
1.3.1 Markets Covered
1.3.2 Years Considered for the Study
1.4 Currency
1.5 Limitations
1.6 Stakeholders
2 Research Methodology (Page No. - 23)
2.1 Research Data
2.1.1 Secondary Data
2.1.1.1 Key Data From Secondary Sources
2.1.2 Primary Data
2.1.2.1 Key Data From Primary Sources
2.1.2.2 Key Industry Insights
2.2 Market Size Estimation
2.2.1 Bottom-Up Approach
2.2.2 Top-Down Approach
2.3 Market Breakdown and Data Triangulation
2.4 Assumptions for the Study
3 Executive Summary (Page No. - 34)
4 Premium Insights (Page No. - 40)
4.1 Closed System Transfer Devices Market Overview
4.2 Asia Pacific: Market, By Technology
4.3 Geographic Snapshot of the Market (2018)
4.4 Geographic Mix: Market, 20192024 (USD Million)
4.5 Closed System Transfer Devices Market: Developing vs Developed Markets, 2019 vs 2024 (USD Million)
5 Market Overview (Page No. - 44)
5.1 Introduction
5.2 Market Dynamics: Impact Analysis
5.2.1 Drivers
5.2.1.1 Rising Incidence of Cancer
5.2.1.2 Increasing Number of Oncology Drug Approvals
5.2.1.3 Increasing Use of Closed System Transfer Devices to Combat the Harmful Effects of Cytotoxic Or Antineoplastic Drugs
5.2.1.4 Improving Regulatory Guidelines Regarding the Safe Handling and Use of Hazardous Drugs
5.2.2 Restraints
5.2.2.1 High Cost of Implementation of CSTDs and Lack of Reimbursement
5.2.2.2 Lack of Compliance With Regulatory Guidelines in Developing Countries
5.2.3 Opportunities
5.2.3.1 Use of CSTDs in Other Therapeutic Areas
5.2.3.2 Rapid Growth in Emerging Markets
5.2.4 Challenges
5.2.4.1 Gaps With Existing CSTDs
5.2.4.2 Low Awareness Among Nurses About CSTDs
6 Industry Insights (Page No. - 54)
6.1 Introduction
6.2 Industry Trends
6.2.1 Automation in CSTD
6.3 Product Features and Pricing Analysis
6.4 Utilization/Adoption of CSTD, By Region
6.5 Regulatory Guidelines
6.5.1 Usp <800> Regulations
6.5.2 National Institute for Occupational Safety and Health (NIOSH)
6.5.3 American Society of Health-System Pharmacists (ASHP)
6.5.4 International Society of Oncology Pharmacy Practitioners (ISOPP)
6.6 Regulatory Analysis
7 Closed System Transfer Devices Market, By Closing Mechanism (Page No. - 62)
7.1 Introduction
7.2 Push-To-Turn Systems
7.2.1 High Adoption Of Phaseal, A Pioneer In the CSTD MarketA Key Market Driver
7.3 Color-To-Color Alignment Systems
7.3.1 Low System Cost, Along With the Advantages Offered, Increases the Adoption of These Systems Among Pharmacists, Oncologists, and Nurses
7.4 Luer-Lock Systems
7.4.1 Luer-Lock Mechanisms Reduce the Risk of Exposure, Require Fewer Components, and Generate Less Biohazardous WasteKey Advantages Driving Growth
7.5 Click-To-Lock Systems
7.5.1 The User-Friendly Nature of Click-To-Lock Mechanisms Drives Their Adoption Among End Users
8 Closed System Transfer Devices Market, By Type (Page No. - 69)
8.1 Introduction
8.2 Membrane-To-Membrane Systems
8.2.1 Membrane-To-Membrane Systems Provide A Double Layer of Protection for the Safe Transfer of Hazardous Drugs
8.3 Needleless Systems
8.3.1 Chemolock is the First Fda Approved Needleless CSTD System
9 Closed System Transfer Devices Market, By Component (Page No. - 73)
9.1 Introduction
9.2 Vial Access Devices
9.2.1 Increasing Regulatory Compliance to Drive the Adoption of Vial Access Devices in Hospitals & Oncology Centers
9.3 Syringe Safety Devices
9.3.1 Advantages Such as Ease of Use and Leak Prevention are Driving the Adoption of These Devices Globally
9.4 Bag/Line Access Devices
9.4.1 Compatibility of Bag/Line Access Devices With Both Types of CSTDs Drives Market Growth
9.5 Accessories
9.5.1 Major CSTDs Such as Phaseal, Onguard, and Chemoclave Require Dedicated Administration Sets, Which Drives Growth in the Accessories Market
10 Closed System Transfer Devices Market, By Technology (Page No. - 82)
10.1 Introduction
10.2 Diaphragm-Based Devices
10.2.1 Diaphragm-Based Devices Dominate the Market Due to the Ease of Use & Safety Provided During the Handling of Hazardous Drugs
10.3 Compartmentalized Devices
10.3.1 Compartmentalized Devices to Witness the Highest Growth in the Market During the Forecast Period
10.4 Air Cleaning/Filtration Devices
10.4.1 Air Cleaning Devices Incorporate an Activated Carbon Or Hydrophobic Filter to Help Reduce the Outflow of Contaminants
11 Closed System Transfer Devices Market, By End User (Page No. - 88)
11.1 Introduction
11.2 Hospitals
11.2.1 Hospitals Form the Largest End-User Segment of the Market
11.3 Oncology Centers & Clinics
11.3.1 Increasing Regulatory Mandates to Drive the Adoption of CSTDs in Oncology Centers & Clinics
11.4 Other End Users
12 Closed System Transfer Devices Market, By Region (Page No. - 94)
12.1 Introduction
12.2 North America
12.2.1 US
12.2.1.1 US Dominates the North American Market Primarily Due to the Presence of Leading CSTD Manufacturing Companies & High Burden of Cancer
12.2.2 Canada
12.2.2.1 Increasing Prevalence of Cancer to Drive the Growth of the Canadian Market
12.3 Europe
12.3.1 Germany
12.3.1.1 Germany to Witness the Highest Growth in the European Closed System Transfer Devices Market
12.3.2 UK
12.3.2.1 High Cost of CSTDs to Restrain Market Growth
12.3.3 France
12.3.3.1 High Cancer Prevalence and the High Healthcare Expenditure in the Country to Drive Market Growth in France
12.3.4 Spain
12.3.4.1 Lack of Specific Regulations About CSTDs is Restraining the Growth of This Market
12.3.5 Italy
12.3.5.1 Increasing Geriatric Population and the Subsequent Increase in the Prevalence of Cancer to Drive the Market for Closed System Transfer Devices in Italy
12.3.6 Rest of Europe
12.4 Asia Pacific
12.4.1 Japan
12.4.1.1 Japan to Dominate the APAC Market
12.4.2 China
12.4.2.1 Untapped China Market With Large Patient Pool Provides Significant Growth Opportunities for Market
12.4.3 India
12.4.3.1 Low Manufacturing Cost and Skilled Workforce are Attracting Outsourcing and Investment to India
12.4.4 Rest of APAC
12.5 Latin America
12.5.1 Rising Cancer Incidence to Drive Market Growth in Latam
12.6 Middle East and Africa
12.6.1 MEA Market to Grow at A Slower Rate Than Latin America
13 Competitive Landscape (Page No. - 149)
13.1 Overview
13.2 Market Share Analysis
13.3 Competitive Leadership Mapping, 2018
13.4 Vendor Inclusion Criteria
13.5 Vendor Dive
13.5.1 Visionary Leaders
13.5.2 Innovators
13.5.3 Emerging Companies
13.5.4 Dynamic Differentiators
13.6 Competitive Situations and Trends
13.6.1 Partnerships and Agreements
13.6.2 Product Launches and Approvals
13.6.3 Acquisitions
14 Company Profiles (Page No. - 157)
(Introduction, Products & Services, Strategy, & Analyst Insights, Developments, MnM View)*
14.1 Becton, Dickinson and Company (BD)
14.2 ICU Medical, Inc.
14.3 B. Braun Melsungen
14.4 JMS Co., Ltd.
14.5 Equashield LLC.
14.6 Teva Pharmaceutical Industries Ltd.
14.7 Corvida Medical
14.8 Yukon Medical
14.9 Codan Medizinische Gerδte GmbH & Co Kg
14.10 Victus, Inc.
14.11 Caragen Ltd.
14.12 Baxter International Inc.
*Details on Marketsandmarkets View, Introduction, Product & Services, Strategy, & Analyst Insights, New Developments Might Not Be Captured in Case of Unlisted Companies.
15 Appendix (Page No. - 180)
15.1 Insights of Industry Experts
15.2 Discussion Guide
15.3 Knowledge Store: Marketsandmarkets Subscription Portal
15.4 Available Customizations
15.5 Related Reports
15.6 Author Details
List of Tables (147 Tables)
Table 1 Standard Currency Conversion Rates
Table 2 Market Snapshot, 2019 vs 2024
Table 3 Cancer Rates, By Country (2018)
Table 4 New Cancer Cases in the US (20152018)
Table 5 List of National/Local Regulatory Bodies Recommending the Use of CSTDs for the Safe Handling of Hazardous Drugs, By Country
Table 6 Average Annual Costs Associated With the Implementation of Various CSTD Systems (USD)
Table 7 Issues, Challenges, and Potential Solutions Regarding the Safe Handling of Hazardous Drugs
Table 8 Comparative Analysis of Commercially Available CSTDs Based on Product Features
Table 9 Intensity of Utilization/Adoption of Various Types of CSTDs, By Region
Table 10 Stringency of Regulations for Adoption of CSTD, By Region
Table 11 NIOSH Classification of Hazardous Drugs
Table 12 NIOSH Hazardous Drug Administration Recommendations and
Table 13 NIOSH and ASHP Definitions of Hazardous Drugs
Table 14 Types of Closing Mechanisms in the Currently Available CSTDs
Table 15 Market, By Closing Mechanism, 20172024 (USD Million)
Table 16 Push-To-Turn Closed System Transfer Devices Market, By Country, 20172024 (USD Million)
Table 17 Color-To-Color Alignment Market, By Country, 20172024 (USD Million)
Table 18 Luer-Lock Market, By Country, 20172024 (USD Million)
Table 19 Click-To-Lock Market, By Country, 20172024 (USD Million)
Table 20 Market, By Type, 20172024 (USD Million)
Table 21 Leading Manufacturers of Membrane-To-Membrane Systems
Table 22 Membrane-To-Membrane Systems Market, By Country, 20172024 (USD Million)
Table 23 Leading Manufacturers of Needleless Systems
Table 24 Needleless Systems Market, By Country, 20172024 (USD Million)
Table 25 Market, By Component, 20172024 (USD Million)
Table 26 Vial Access Components for Closed System Transfer Devices
Table 27 Market for Vial Access Devices, By Country, 20172024 (USD Million)
Table 28 Syringe Safety Components for Closed System Transfer Devices
Table 29 Market for Syringe Safety Devices, By Country, 20172024 (USD Million)
Table 30 Bag/Line Access Components for Closed System Transfer Devices
Table 31 Market for Bag/Line Access Devices, By Country, 20172024 (USD Million)
Table 32 Accessories for Closed System Transfer Devices
Table 33 Market for Accessories, By Country, 20172024 (USD Million)
Table 34 Market, By Technology, 20172024 (USD Million)
Table 35 Diaphragm-Based CSTDs Available in the Market
Table 36 Diaphragm-Based Market, By Country, 20172024 (USD Million)
Table 37 Compartmentalized CSTDs Available in the Market
Table 38 Compartmentalized Market, By Country, 20172024 (USD Million)
Table 39 Air Cleaning/Filtration Market, By Country, 20172024 (USD Million)
Table 40 Market, By End User, 20172024 (USD Million)
Table 41 Market for Hospitals, By Country, 20172024 (USD Million)
Table 42 Market for Oncology Centers & Clinics, By Country, 20172024 (USD Million)
Table 43 Market for Other End Users, By Country, 20172024 (USD Million)
Table 44 Market, By Region, 20172024 (USD Million)
Table 45 North America: Market, By Country, 20172024 (USD Million)
Table 46 North America: Market, By Closing Mechanism, 20172024 (USD Million)
Table 47 North America: Market, By Type, 20172024 (USD Million)
Table 48 North America: Market, By Technology, 20172024 (USD Million)
Table 49 North America: Market, By Component, 20172024 (USD Million)
Table 50 North America: Market, By End User, 20172024 (USD Million)
Table 51 US: Key Macroindicators
Table 52 US: Market, By Closing Mechanism, 20172024 (USD Million)
Table 53 US: Market, By Type, 20172024 (USD Million)
Table 54 US: Market, By Technology, 20172024 (USD Million)
Table 55 US: Market, By Component, 20172024 (USD Million)
Table 56 US: Market, By End User, 20172024 (USD Million)
Table 57 Canada: Key Macroindicators
Table 58 Canada: Market, By Closing Mechanism, 20172024 (USD Million)
Table 59 Canada: Market, By Type, 20172024 (USD Million)
Table 60 Canada: Market, By Technology, 20172024 (USD Million)
Table 61 Canada: Market, By Component, 20172024 (USD Million)
Table 62 Canada: Market, By End User, 20172024 (USD Million)
Table 63 Europe: Market, By Country, 20172024 (USD Million)
Table 64 Europe: Market, By Closing Mechanism, 20172024 (USD Million)
Table 65 Europe: Market, By Type, 20172024 (USD Million)
Table 66 Europe: Market, By Technology, 20172024 (USD Million)
Table 67 Europe: Market, By Component, 20172024 (USD Million)
Table 68 Europe: Market, By End User, 20172024 (USD Million)
Table 69 Germany: Key Macroindicators
Table 70 Germany: Market, By Closing Mechanism, 20172024 (USD Million)
Table 71 Germany: Market, By Type, 20172024 (USD Million)
Table 72 Germany: Market, By Technology, 20172024 (USD Million)
Table 73 Germany: Market, By Component, 20172024 (USD Million)
Table 74 Germany: Market, By End User, 20172024 (USD Million)
Table 75 UK: Key Macroindicators
Table 76 UK: Market, By Closing Mechanism, 20172024 (USD Million)
Table 77 UK: Market, By Type, 20172024 (USD Million)
Table 78 UK: Market, By Technology, 20172024 (USD Million)
Table 79 UK: Market, By Component, 20172024 (USD Million)
Table 80 UK: Market, By End User, 20172024 (USD Million)
Table 81 France: Key Macroindicators
Table 82 France: Market, By Closing Mechanism, 20172024 (USD Million)
Table 83 France: Market, By Type, 20172024 (USD Million)
Table 84 France: Market, By Technology, 20172024 (USD Million)
Table 85 France: Market, By Component, 20172024 (USD Million)
Table 86 France: Market, By Component, 20172024 (USD Million)
Table 87 Spain: Key Macroindicators
Table 88 Spain: Market, By Closing Mechanism, 20172024 (USD Million)
Table 89 Spain: Market, By Type, 20172024 (USD Million)
Table 90 Spain: Market, By Technology, 20172024 (USD Million)
Table 91 Spain: Market, By Component, 20172024 (USD Million)
Table 92 Spain: Market, By End User, 20172024 (USD Million)
Table 93 Italy: Key Macroindicators
Table 94 Italy: Market, By Closing Mechanism, 20172024 (USD Million)
Table 95 Italy: Market, By Type, 20172024 (USD Million)
Table 96 Italy: Market, By Technology, 20172024 (USD Million)
Table 97 Italy: Market, By Component, 20172024 (USD Million)
Table 98 Italy: Market, By End User, 20172024 (USD Million)
Table 99 RoE: Market, By Closing Mechanism, 20172024 (USD Million)
Table 100 RoE: Market, By Type, 20172024 (USD Million)
Table 101 RoE: Market, By Technology, 20172024 (USD Million)
Table 102 RoE: Market, By Component, 20172024 (USD Million)
Table 103 RoE: Market, By End User, 20172024 (USD Million)
Table 104 APAC: Market, By Country, 20172024 (USD Million)
Table 105 APAC: Market, By Closing Mechanism, 20172024 (USD Million)
Table 106 APAC: Market, By Type, 20172024 (USD Million)
Table 107 APAC: Market, By Technology, 20172024 (USD Million)
Table 108 APAC: Market, By Component, 20172024 (USD Million)
Table 109 APAC: Market, By End User, 20172024 (USD Million)
Table 110 Japan: Key Macroindicators
Table 111 Japan: Market, By Closing Mechanism, 20172024 (USD Million)
Table 112 Japan: Market, By Type, 20172024 (USD Million)
Table 113 Japan: Market, By Technology, 20172024 (USD Million)
Table 114 Japan: Market, By Component, 20172024 (USD Million)
Table 115 Japan: Market, By End User, 20172024 (USD Million)
Table 116 China: Key Macroindicators
Table 117 China: Market, By Closing Mechanism, 20172024 (USD Million)
Table 118 China: Market, By Type, 20172024 (USD Million)
Table 119 China: Market, By Technology, 20172024 (USD Million)
Table 120 China: Market, By Component, 20172024 (USD Million)
Table 121 China: Market, By End User, 20172024 (USD Million)
Table 122 India: Key Macroindicators
Table 123 India: Market, By Closing Mechanism, 20172024 (USD Million)
Table 124 India: Market, By Type, 20172024 (USD Million)
Table 125 India: Market, By Technology, 20172024 (USD Million)
Table 126 India: Market, By Component, 20172024 (USD Million)
Table 127 India: Market, By End User, 20172024 (USD Million)
Table 128 RoAPAC: Market, By Closing Mechanism, 20172024 (USD Million)
Table 129 RoAPAC: Market, By Type, 20172024 (USD Million)
Table 130 RoAPAC: Market, By Technology, 20172024 (USD Million)
Table 131 RoAPAC: Market, By Component, 20172024 (USD Million)
Table 132 RoAPAC: Market, By End User, 20172024 (USD Million)
Table 133 Latin America: Market, By Closing Mechanism, 20172024 (USD Million)
Table 134 Latin America: Market, By Type, 20172024 (USD Million)
Table 135 Latin America: Market, By Technology, 20172024 (USD Million)
Table 136 Latin America: Market, By Component, 20172024 (USD Million)
Table 137 Latin America: Market, By End User, 20172024 (USD Million)
Table 138 Middle East & Africa: Market, By Closing Mechanism, 20172024 (USD Million)
Table 139 Middle East & Africa: Market, By Type, 20172024 (USD Million)
Table 140 Middle East & Africa: Market, By Technology, 20172024 (USD Million)
Table 141 Middle East & Africa: Market, By Component, 20172024 (USD Million)
Table 142 Middle East & Africa: Market, By End User, 20172024 (USD Million)
Table 143 Growth Strategy Matrix (20152018)
Table 144 Expansions, 2015-2018
Table 145 Partnerships and Agreements, 20152018
Table 146 Product Launches and Approvals, 20152018
Table 147 Acquisitions, 20152018
List of Figures (33 Figures)
Figure 1 Research Design
Figure 2 Primary Sources
Figure 3 Breakdown of Primary Interviews (Supply-Side): By Company Type, Designation, and Region
Figure 4 Breakdown of Primary Interviews (Demand-Side): By End User, Designation, and Region
Figure 5 Data Triangulation Methodology
Figure 6 Market, By Closing Mechanism, 2019 vs 2024 (USD Million)
Figure 7 Market, By Type, 2019 vs 2024 (USD Million)
Figure 8 Market, By Technology, 2019 vs 2024 (USD Million)
Figure 9 Market, By Component, 2019 vs 2024 (USD Million)
Figure 10 Market, By End User, 2019 vs 2024 (USD Million)
Figure 11 Geographic Snapshot: Closed System Transfer Devices Market
Figure 12 Rising Incidence of Cancer is Driving the Growth of the Closed System Transfer Devices Market
Figure 13 Diaphragm-Based Devices Accounted for the Largest Share of the APAC Market in 2018
Figure 14 US Accounted for the Largest Share of the Market in 2018
Figure 15 APAC to Grow at the Highest CAGR During the Forecast Period
Figure 16 Developing Markets to Register Higher Growth During the Forecast Period
Figure 17 Global Cancer Incidence (20082030)
Figure 18 Share of Geriatric Individuals Among New Cancer Cases (20122030)
Figure 19 Evolutionary Timeline of Key CSTD Developments
Figure 20 Closed System Transfer Devices Market: Geographic Growth Opportunities
Figure 21 North America: Market Snapshot
Figure 22 Europe: Market Snapshot
Figure 23 Asia Pacific: Market Snapshot
Figure 24 Key Developments of Major Players Between January 2015 and November 2018
Figure 25 Closed System Transfer Devices Market Share Analysis, By Key Player, 2018
Figure 26 Competitive Leadership Mapping, Market (2018)
Figure 27 Expansions Was the Key Growth Strategy Adopted By Major Players Between 2015 & 2018
Figure 28 Becton, Dickinson and Company: Company Snapshot
Figure 29 ICU Medical: Company Snapshot
Figure 30 B. Braun Melsungen: Company Snapshot
Figure 31 JMS Co., Ltd.: Company Snapshot
Figure 32 Teva Pharmaceuticals: Company Snapshot
Figure 33 Baxter International Inc.: Company Snapshot
This study involved the extensive use of both primary and secondary sources. The research process involved the study of various factors affecting the industry to identify the segmentation types, industry trends, key players, competitive landscape, competitive leadership mapping, key market dynamics, and key player strategies.
The secondary research process involves the widespread use of secondary sources, directories, databases (such as Bloomberg Business, Factiva, and D&B Hoovers), white papers, annual reports, company house documents, investor presentations, and SEC filings of companies. Secondary research was used to identify and collect information useful for the extensive, technical, market-oriented, and commercial study of the closed system transfer devices market. It was also used to obtain important information about the key players and market classification & segmentation according to industry trends to the bottom-most level, and key developments related to market and technology perspectives. A database of the key industry leaders was also prepared using secondary research.
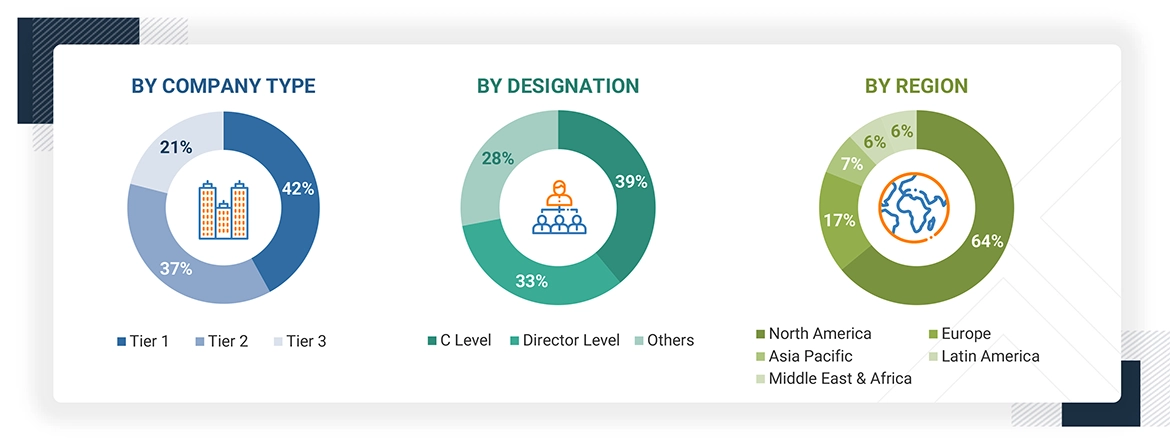
In the primary research process, industry experts from both the supply and demand sides were interviewed to obtain qualitative and quantitative information for this report. Industry experts from the supply side include CEOs, vice presidents, marketing and sales directors, business development managers, and technology and innovation directors of closed system transfer devices product providers, whereas, industry experts from the demand side include cancer care providers, oncologists, nurses, oncology pharmacists, healthcare professionals, payers, researchers, and other related key opinion leaders.
A breakdown of the primary respondents is provided below:
To know about the assumptions considered for the study, download the pdf brochure
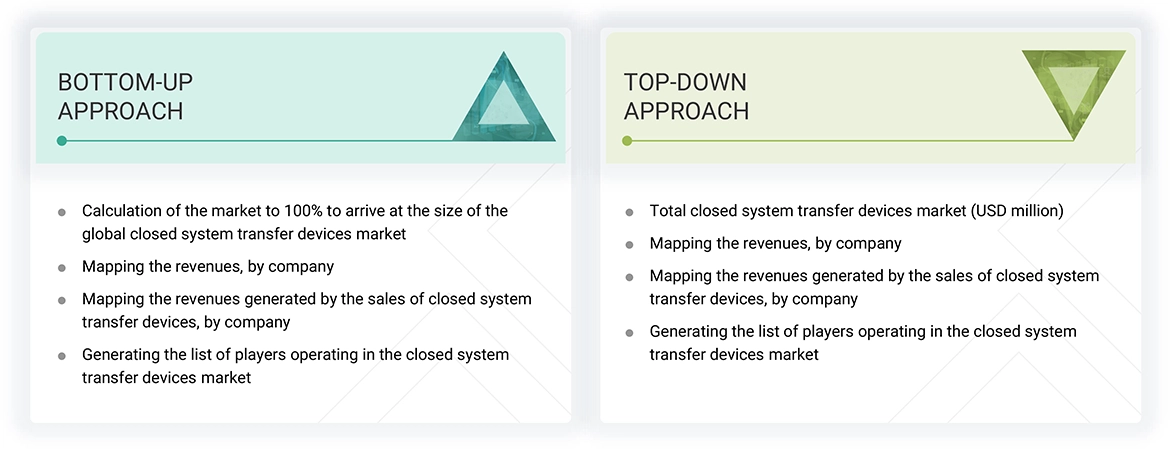
The market size estimates and forecasts provided in this study are derived through a mix of the bottom-up approach (revenue share analysis of leading players) and top-down approach (assessment of utilization/adoption/penetration trends, by closing mechanism, type, component, technology, end user, and region).
After arriving at the market size, the total closed system transfer devices market was divided into several segments and subsegments. To complete the overall market engineering process and arrive at the exact statistics for all segments & subsegments, data triangulation and market breakdown procedures were employed, wherever applicable.
With the given market data, MarketsandMarkets offers customizations as per the companys specific needs. The following customization options are available for the report:
Benchmarking the rapid strategy shifts of the Top 100 companies in the Closed System Transfer Devices Market
Request For Special Pricing
Growth opportunities and latent adjacency in Closed System Transfer Devices Market