The study involves four major activities for estimating the size of the CNC market. Exhaustive secondary research has been conducted to collect information related to the market. The next step has been validating these findings, assumptions, and sizing with the industry experts across the value chain through primary research. Both top-down and bottom-up approaches have been employed to estimate the overall size of the CNC market. After that, market breakdown and data triangulation procedures have been used to determine the extent of different segments and subsegments of the market.
Secondary Research
Secondary sources in this research study include corporate filings (such as annual reports, investor presentations, and financial statements); trade, business, and professional associations; white papers, certified publications, articles from recognized authors; directories; and databases. The secondary data has been collected and analyzed to determine the overall market size estimations, further validated by primary research.
Primary Research
In the primary research process, several sources from both supply and demand sides were interviewed to obtain qualitative and quantitative information about this report. Several primary interviews have been conducted with market experts from both demand and supply sides across four major regions—North America, Europe, Asia Pacific, and the Rest of the World. This primary data has been collected through questionnaires, emails, and telephonic interviews. Approximately 60% of the primary interviews have been conducted with the demand side and 40% with the supply side. This primary data has been collected mainly through telephonic interviews, which accounted for 80% of the total primary interviews. Additionally, questionnaires and emails were used to collect the data.
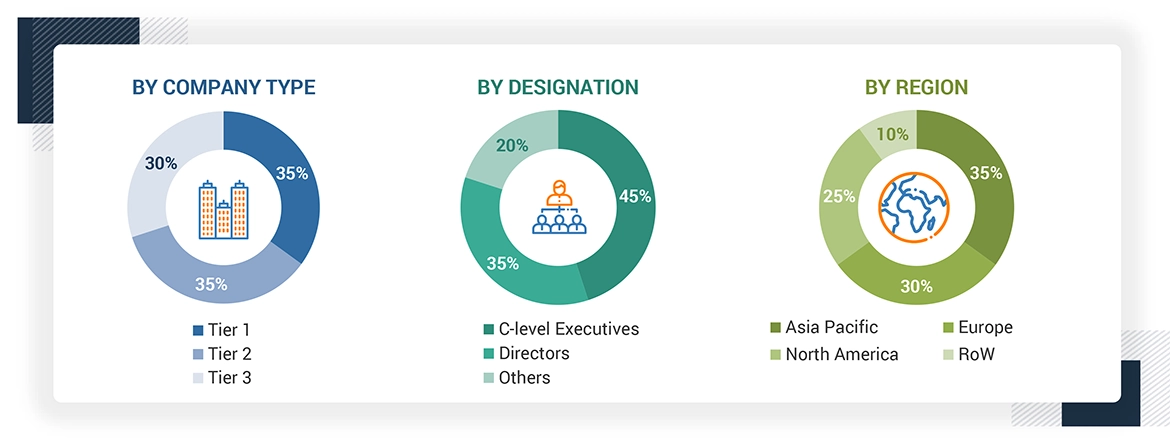
Note: Three tiers of the companies were defined based on their total/segmental revenue as of 2022; Tier 1 = >USD 1 billion, Tier 2 = USD 1 billion–USD 500 million, and Tier 3 = <USD 500 million. Others include sales, marketing, and product managers.
About the assumptions considered for the study, To know download the pdf brochure
Market Size Estimation
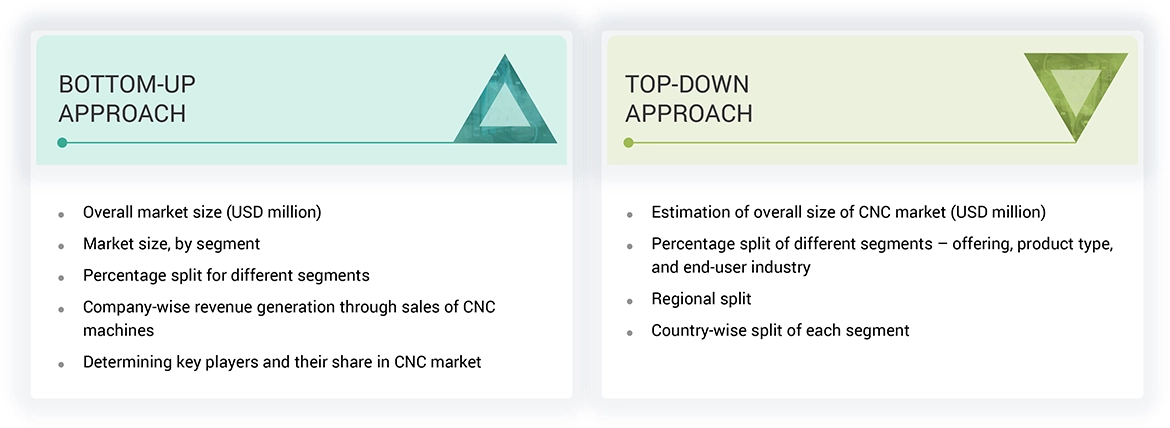
In the complete market engineering process, both top-down and bottom-up approaches have been implemented, along with several data triangulation methods, to estimate and validate the size of the CNC market and other dependent submarkets listed in this report.
Data Triangulation
After arriving at the overall market size, the total market has been split into several segments. To complete the overall market engineering process and arrive at exact statistics for all segments, the market breakdown and data triangulation procedures have been employed wherever applicable. The data has been triangulated by studying various factors and trends from both the demand and supply sides. The market has also been validated using both top-down and bottom-up approaches.
Market Definition
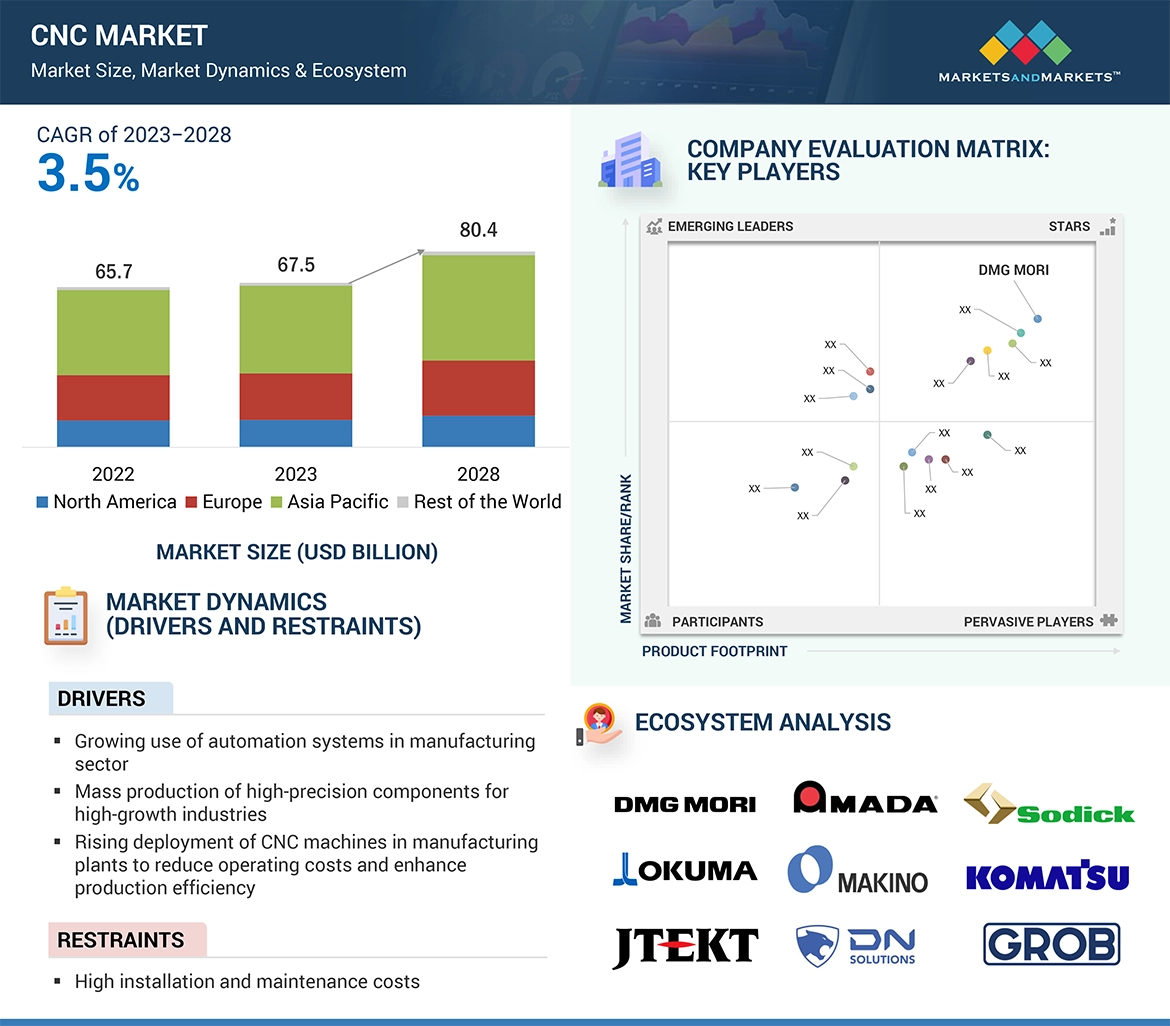
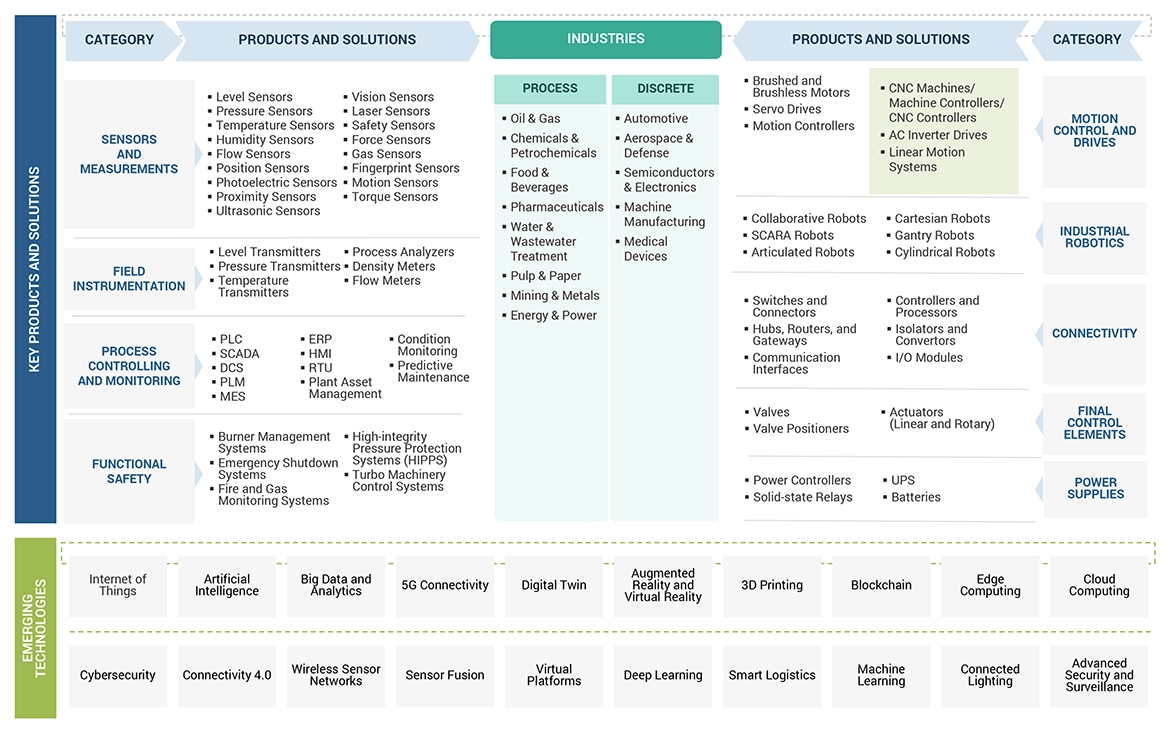
CNC or computer numerical control machines are sophisticated tools a computer system controls, allowing for precise operation. These machines are versatile and can work with various materials, such as metals, plastics, wood, and composites. The operation of CNC machines relies on a pre-programmed set of instructions that dictate their movements and material removal processes. These instructions dictate tool movements and material removal quantities, often achieving tolerances of less than one-thousandth of an inch. CNC machines play a pivotal role across diverse industries, such as automotive, aerospace, medical, semiconductor, capital goods, and energy & power, contributing to the production of various components, such as engines, gears, circuit boards, and medical implants.
Stakeholders
-
Automation Consultants
-
Integrators of Automation Systems
-
Distributors and Providers of CNC Machines
-
Companies Developing and Integrating Industrial Software
-
Vendors of CNC Machining Software
-
Suppliers of CNC Machine Components
-
Research Organizations and Consulting Companies
-
Technology Investors
-
Technology Standards Organizations, Forums, Alliances, and Associations
Study Objectives
-
To describe and forecast the size of the CNC market based on offering, product type, end-user industry, and region in terms of value
-
To describe and forecast the size of the CNC market based on four regions: North America, Europe, Asia Pacific, and Rest of the World (RoW), along with their respective countries, in terms of value
-
To provide industry-specific information on drivers, restraints, opportunities, and challenges influencing the market growth
-
To understand and analyze the impact of evolving technologies in the value chain of the CNC market and upcoming trends
-
To provide ecosystem analysis, case study analysis, patent analysis, technology analysis, pricing analysis, Porter’s five forces analysis, key stakeholders and buying criteria, key conferences and events, and regulatory landscape pertaining to the market under study
-
To strategically analyze micromarkets1 concerning individual growth trends, prospects, and contributions to the overall market size
-
To study the complete value chain of the CNC market
-
To strategically profile the key players and comprehensively analyze their market positions in terms of their ranking and core competencies2, along with a detailed market competitive landscape
-
To analyze competitive developments, such as product launches, acquisitions, agreements, partnerships, contracts, and expansions, in the market
-
To benchmark market players using the company evaluation matrix, which includes an analysis of the market players based on product footprint and market share/rank


 HIGHEST CAGR MARKET IN 2023
 INDIA FASTEST GROWING MARKET IN THE REGION
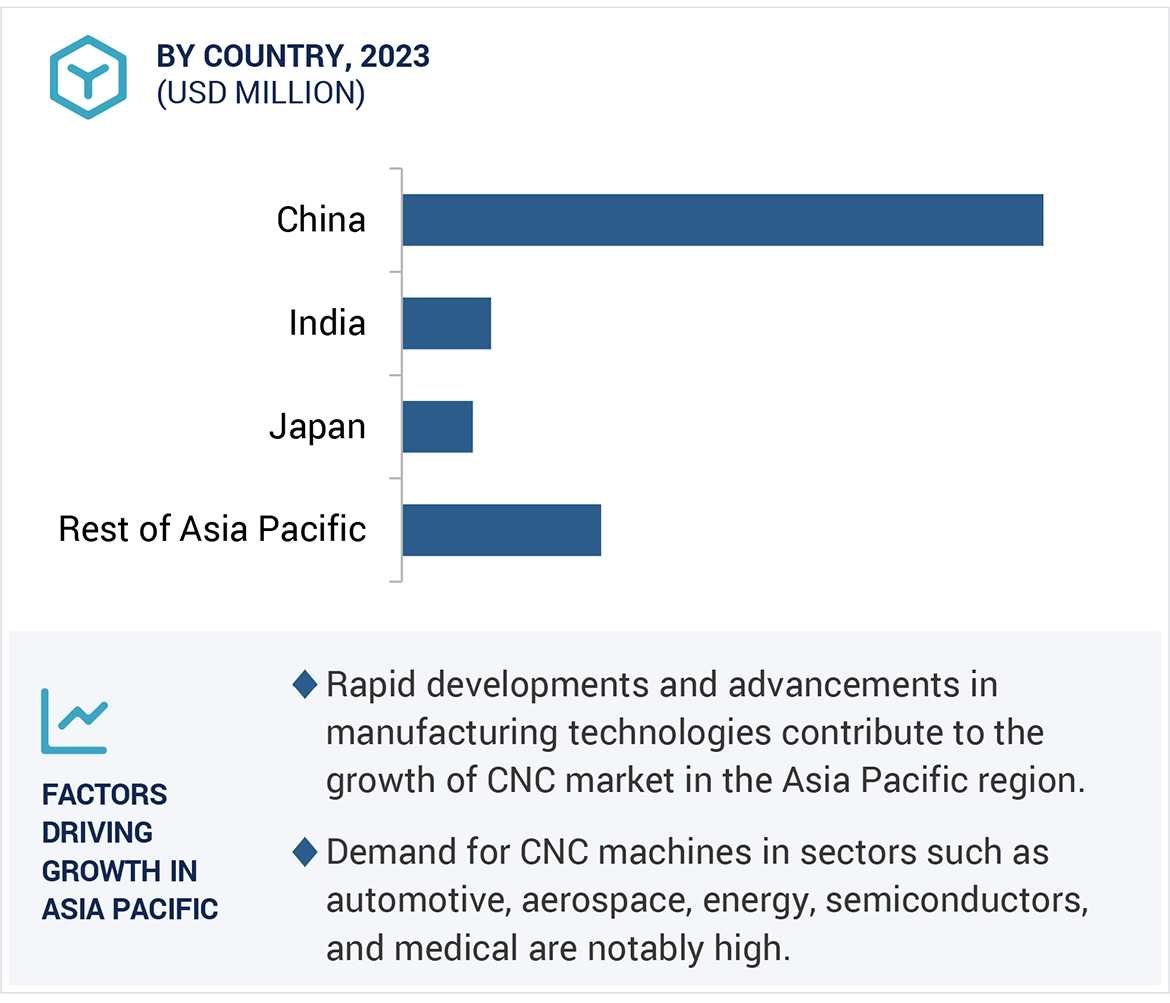


Growth opportunities and latent adjacency in CNC Machine Market