[201 Pages Report] According to MarketsandMarkets, the global cold chain market size is estimated to be valued at USD 233.8 billion in 2020 and is projected to reach USD 340.3 billion by 2025, recording a CAGR of 7.8%. The growing demand for organized retail, as well as the increase in awareness among consumers to mitigate food wastage, are propelling the demand for cold chain. With the advancement of recent technologies, the usage of cold chains in the food and beverage sector helps in preventing the degradation of food quality. The development of technology has contributed to the growth of cold chain market around the world. The Asia Pacific region is growing fastest owing to modern technologies, government support, and an increase in the export of food and beverages.
To know about the assumptions considered for the study, Request for Free Sample Report
The pandemic has created a positive impact on the cold chain industry, resulting in fuelling the demand for cold chain warehousing. The increasing adoption rate of packaged food & beverage products is considered a key driver in the growth of the cold chain in the food industry. The COVID-19 affected the supply chain of every industry due to restricted trade during the pandemic, resulting in food manufactures to emphasize not only on the food products but also on their storage to increase their shelf-life, which is expected to propel the market for the cold chain. The outbreak of COVID-19 has created a shift toward an organized retail market for preventing any further virus outbreaks. As the pandemic crisis intensified, countries across the world started imposing lockdown. Due to these factors, people started stocking up on consumer staples. Consumer’s compulsive behaviour pressured the 3PLs for faster stock turn and larger volume shipments. These developments underscore the need for the food value chain to move from open-air markets to a cold-chain model that keeps perishable items for longer duration. These factors are expected to propel the demand for cold chain during the forecast period.
Consumers are now more aware of health and wellness, as well as the effect that food nutrients, especially protein, have on overall physical and mental growth and development. This has resulted in a change in the consumption pattern of perishable foods, such as dairy products, fruits and vegetables, and high-protein animal-based products (such as meat, eggs, and fish and seafood).
Emerging economies in the Asia Pacific and Latin America are seeing a high demand for perishable food products. This can be attributed to the rapid urbanization, changing tastes and preferences, and the rising disposable income of consumers in these countries. The market potential for processed and frozen food products is also high in these countries due to their lower adoption rates. The consumption of ready-to-eat meals, such as frozen pizzas, desserts, and snacks, is rising steadily in these countries. The frozen foods market requires an effective cold storage system so that the chemical composition of food items stays intact even after several months. With the increased international trade of these foods products, the demand for cold storage systems is expected to increase in the coming years.
In the food industry, a major focus for manufacturers, retailers, and consumers is to ensure food quality and safety by preventing premature expiry, decay, and spoilage. To achieve this, it has become necessary for service providers to invest in modern cold storage facilities, advanced vehicles, and system technologies. However, high energy costs are a growing concern for cold chain providers (energy costs are exceptionally high in North America and Europe). Refrigerated storage facilities use traditional fluorescent light fixtures, which are switched on throughout the year as it is mandatory under regulations. Governments of numerous countries have been attempting to bolster the infrastructure investment of the cold chain, pre-cooling facilities, refrigerated storage and transport, packaging, and information management systems. Fuel costs and efficient management of fuel consumption are some of the other major concerns for cold chain providers, as the requirement of refrigerated vehicles in cold chains, especially in North America and Europe, has increased over the last few years. On the other hand, emerging economies are facing different issues while operating cold chains. The annual operating costs for cold chain businesses are much higher per cubic feet.
The development of retail channels and chains in the form of supermarkets, hypermarkets, and convenience stores is a major factor driving the growth of the cold chain market. Also, retail chains have developed to an extent where some of the producers have their own in-house refrigerated warehousing facilities. Large food retail chains such as Walmart, Tesco, Spar, and 7-Eleven are expanding their outlets in developed countries such as the UK, Germany, and the US, and in emerging markets such as China, Brazil, and Argentina. For instance, Walmart is the largest American multinational retail corporation with over 11,000 stores across 27 countries. It has a large fleet for the transportation of perishable goods and an effective distribution network. It also hires 3PL refrigerated warehousing service providers to transport perishable foods to its retail outlets efficiently. The emergence of such large retailers and their expanding operations in international trade are creating growth opportunities for the refrigerated warehousing and refrigerated transportation market. Governments in many nations are taking initiatives to reduce food and agricultural waste by framing food wastage policies and supporting food-related industries, such as the cold chain industry.
The cold chain industry is highly fragmented, mainly in the emerging markets across Asia, Africa, and South America. Cold chain service providers in these regions do not have the resources or the technology needed to build high-quality cold chain facilities. Lack of proper food storage, processing, and cold chain logistics, together with the weak organization and implementation of controls for compliance with standards, remains a serious challenge in these countries. From procurement to delivery at retail, cold chain service providers face many challenges in a cold chain network. Countries in Asia Pacific and South America lack efficient transport infrastructure and are not well connected. The missing links in these networks continue to constrain route choice, while insufficient capacity and the poor quality of infrastructure add costs and time to the transit. The cold chain systems in these markets are not integrated and compatible for use for multiple perishable commodities, which poses a major challenge to market growth.
Chilled products going through the cold chain involves chilling the products by reducing the food temperatures to below ambient temperatures, but above –1°C. Chilling food products between 0°C to +5°C is an effective tool for preserving food for shorter durations. It is because it retards many of the microbial, physical, chemical, and biochemical reactions that lead to food spoilage and deterioration. The use of chilling to slow down the rate of growth of microorganisms reduces food spoilage and improves food safety and quality. The Asia Pacific region is the dominant market for chilled cold chain, with a share of 31.5 % in 2019.
The prime concern with transporting dairy and frozen desserts is constant temperature control, dust, and exposure to sunlight. Cold chain transportation services help overcome these problems by ensuring low temperatures (-18°C to 4°C) or (-0.4°F to 39.2°F) to extend their shelf-life. Milk and dairy products have been associated with foodborne illnesses for centuries. They are one of the most regulated foods. Cold chain logistics are essential for maintaining the quality of dairy products. The cold chain ensures that low temperature is maintained, as required by dairy products, throughout the supply chain.
To know about the assumptions considered for the study, download the pdf brochure
The cold chain market in this region is estimated to witness robust growth propelled by the economic developments of countries such as China, India, Japan, and Australia. The shift of industrialization and investments in Asia Pacific regions has grown substantially over the past decade, especially in China and India, which contributes to rapid economic growth. Therefore, several key market players in the region, such as AmericaCold Logistics (US), Lineage Logistics (US), Nichirei Corporation (Japan), and Agro Merchants Group (US), have been emphasizing on developments to provide a large product portfolio in the cold chain. The region also hosts a strong agricultural production base, which is a key factor for the growth of the cold chain market.
Americold Logistics (US), Lineage Logistics Holdings (US), Nichirei Corporation (Japan), Burris Logistics (US), Agro Merchants Group (US), Kloosterboer (Netherlands), United States Cold Storage (US), Tippmann Group (US), VersaCold Logistics Services (Canada), Henningsen Cold Storage Co. (US), Coldman (India), Congebec Inc. (Canada), Conestoga Cold Storage (Canada), NewCold (Netherlands), Hanson Logistics (US), Confederation Freezers (Canada), Seafrigo (France), Trenton Cold Storage (Canada), Merchants Terminal Corporation (US), and Stockhabo (Belgium) are the leading cold chain market vendors.
Report Metric |
Details |
Market size available for years |
2018–2025 |
Base year considered |
2019 |
Forecast period |
2020–2025 |
Forecast units |
Value (USD Million) |
Segments covered |
Application, Type, Temperature Type, and Region |
Geographies covered |
North America, Europe, Asia Pacific, and RoW |
Companies covered |
Americold Logistics (US), Lineage Logistics Holdings (US), Nichirei Corporation (Japan), Burris Logistics (US), Agro Merchants Group (US), Kloosterboer (Netherlands), United States Cold Storage (US), Tippmann Group (US), VersaCold Logistics Services (Canada), Henningsen Cold Storage Co. (US), Coldman (India), Congebec Inc. (Canada), Conestoga Cold Storage (Canada), NewCold (Netherlands), Hanson Logistics (US), Confederation Freezers (Canada), Seafrigo (France), Trenton Cold Storage (Canada), Merchants Terminal Corporation (US), and Stockhabo (Belgium) |
This research report categorizes the cold chain market based on application, type, temperature type, and region
I am interested in the European cold chain market. What information does the current report cover?
An existing study on Cold chain cover both qualitative and quantitative insights at regional and country level. Qualitative insights include regional and country market trends and insights on regulatory framework; quantitative insights include the size of the European cold chain market by countries mentioned below, market size by temperature type, in terms of value and volume, by application, by technology, and by type.
Quantitative insights at the country level include the market size by application. The countries covered in the report are as mentioned below:
Can you explain the research methodology on how you arrived at the market?
Yes, a detailed explanation of research methodology can be provided over a scheduled call. It will also enable us to explain all your queries in detail. For a brief overview and knowledge: Multiple approaches have been adopted to understand the holistic view of this market, including:
What kind of information is provided in the company profiles section?
For the existing study, 20 company profiles are provided with insights, including a business overview covering information on the company’s business segments, financials, geographic presence & revenue mix, and business revenue mix of total company revenue. The company profiles section also provides information on product offerings, key developments associated with the company, and MnM view to elaborate analyst views on the company. Some of the key players in the market include Americold Logistics (US), Lineage Logistics Holdings (US), Nichirei Corporation (Japan), Burris Logistics (US), Agro Merchants Group (US), Kloosterboer (Netherlands), United States Cold Storage (US), Tippmann Group (US), VersaCold Logistics Services (Canada), Henningsen Cold Storage Co. (US), Coldman (India), Congebec Inc. (Canada), Conestoga Cold Storage (Canada), NewCold (Netherlands), Hanson Logistics (US), Confederation Freezers (Canada), Seafrigo (France), Trenton Cold Storage (Canada), Merchants Terminal Corporation (US), and Stockhabo (Belgium).
What are some of the drivers fuelling the growth of the cold chain market?
Global cold chain market is characterized by the following drivers
Consumers are now more aware of health and wellness, as well as the effect that food nutrients, especially protein, have on overall physical and mental growth and development. This has resulted in a change in the consumption pattern of perishable foods, such as dairy products, fruits and vegetables, and high-protein animal-based products (such as meat, eggs, and fish and seafood).
Food security, food safety, economic and environmental sustainability, and minimal food waste are major focus areas in the food industry. Food loss and waste are caused due to various reasons. For instance, perishable products are often exposed to fluctuating temperatures during transit and handling, which results in food spoilage and wastage. To overcome this, the demand for refrigerated storage and transportation services has increased across the globe. For example, India, which is the world’s second-largest market with ~150 million cubic meters of refrigerated storage capacity, wastes about 18% of fruits & vegetables on an annual basis due to the lack of post-harvest storage infrastructure.
What types of Cold chains are covered in the market estimations? What is the depth of this, and is this information covered at the country level?
The reports provide global, regional and country market size (current & forecast until 2025) along with qualitative insights on below types:
Cross segment market size by various market segments can also be provided based on your specific requirements. .
To speak to our analyst for a discussion on the above findings, click Speak to Analyst
TABLE OF CONTENTS
1 INTRODUCTION (Page No. - 21)
1.1 OBJECTIVES OF THE STUDY
1.2 MARKET DEFINITION
1.3 STUDY SCOPE
FIGURE 1 MARKET SEGMENTATION
1.4 REGIONS COVERED
1.5 PERIODIZATION CONSIDERED
1.6 CURRENCY CONSIDERED
1.7 UNITS CONSIDERED
TABLE 1 USD EXCHANGE RATES CONSIDERED, 2017–2019
1.8 STAKEHOLDERS
1.9 SUMMARY OF CHANGES
2 RESEARCH METHODOLOGY (Page No. - 26)
2.1 RESEARCH DATA
FIGURE 2 COLD CHAIN MARKET: RESEARCH DESIGN
FIGURE 3 KEY DATA FROM PRIMARY SOURCES
2.2 MARKET SIZE ESTIMATION
2.2.1 APPROACH ONE: DETERMINING THE MARKET SIZE OF REFRIGERATED WAREHOUSE THROUGH SUPPLY SIDE (CAPACITY IN MILLION CUBIC METERS)
2.2.2 APPROACH TWO (BASED ON GLOBAL MARKET)
2.3 DATA TRIANGULATION
FIGURE 4 DATA TRIANGULATION METHODOLOGY
2.4 ASSUMPTIONS FOR THE STUDY
2.5 LIMITATIONS OF THE STUDY
2.6 SCENARIO-BASED MODELING
2.7 INTRODUCTION TO COVID-19
2.8 COVID-19 HEALTH ASSESSMENT
FIGURE 5 COVID-19: THE GLOBAL PROPAGATION
FIGURE 6 COVID-19 PROPAGATION: SELECT COUNTRIES
2.9 COVID-19 ECONOMIC ASSESSMENT
FIGURE 7 REVISED GROSS DOMESTIC PRODUCT FORECASTS FOR SELECT G20 COUNTRIES IN 2020
2.9.1 COVID-19 ECONOMIC IMPACT—SCENARIO ASSESSMENT
FIGURE 8 FACTORS IMPACTING GLOBAL ECONOMY
FIGURE 9 SCENARIOS IN TERMS OF RECOVERY OF GLOBAL ECONOMY
3 EXECUTIVE SUMMARY (Page No. - 38)
TABLE 2 MARKET SNAPSHOT, 2020 VS. 2025
FIGURE 10 MARKET SIZE, BY TEMPERATURE TYPE, 2020 VS. 2025 (USD BILLION)
FIGURE 11 MARKET SIZE, BY APPLICATION, 2020 VS. 2025 (USD BILLION)
FIGURE 12 REFRIGERATED TRANSPORTATION: COLD CHAIN MARKET SIZE, BY VEHICLE TYPE, 2020 VS. 2025 (USD MILLION)
FIGURE 13 REFRIGERATED WAREHOUSE: MARKET SIZE, BY REGION, 2020 VS. 2025 (MILLION CUBIC METERS)
FIGURE 14 MARKET SHARE (VALUE), BY REGION, 2020
4 PREMIUM INSIGHTS (Page No. - 42)
4.1 OVERVIEW OF THE MARKET
FIGURE 15 GROWING DEMAND FOR FOOD WITH EXTENDED SHELF-LIFE AND INCREASE IN TEMPERATURE CONTROL TO PREVENT FOOD WASTAGE ARE PROJECTED TO DRIVE THE GROWTH OF THE MARKET
4.2 MAJOR REGIONAL MARKETS
FIGURE 16 US ACCOUNTED FOR THE LARGEST SHARE, GLOBALLY, FOR COLD CHAIN IN 2019
4.3 ASIA PACIFIC: COLD CHAIN MARKET, BY APPLICATION AND KEY COUNTRY
FIGURE 17 CHINA AND INDIA ACCOUNTED FOR SIGNIFICANT SHARES IN THE ASIA PACIFIC MARKET IN 2019
4.4 MARKET FOR COLD CHAIN, BY TEMPERATURE TYPE AND REGION
FIGURE 18 ASIA PACIFIC IS PROJECTED TO DOMINATE THE MARKET FOR COLD CHAIN, 2020 VS. 2025
4.5 NORTH AMERICAN COLD CHAIN MARKET, BY APPLICATION
FIGURE 19 DAIRY & FROZEN DESSERTS PROJECTED TO DOMINATE THE NORTH AMERICAN COLD CHAIN MARKET, 2020 VS. 2025
5 MARKET OVERVIEW (Page No. - 45)
5.1 INTRODUCTION
5.2 MARKET DYNAMICS
FIGURE 20 MARKET DYNAMICS
5.2.1 DRIVERS
5.2.1.1 Rising consumer demand for perishable goods
5.2.1.2 Growth in international food trade due to trade liberalization
5.2.1.3 Increasing need for temperature control to prevent food loss and potential health hazards
FIGURE 21 INDIA: ANNUAL WASTAGE AS PERCENTAGE OF PRODUCTION
5.2.1.4 Technological innovations in refrigerated systems and equipment
5.2.2 RESTRAINTS
5.2.2.1 High energy costs and the requirement of significant capital investments
5.2.2.2 Environmental concerns regarding greenhouse gas emissions
FIGURE 22 ENVIRONMENTAL IMPACT OF THE FOOD SUPPLY CHAIN
5.2.3 OPPORTUNITIES
5.2.3.1 Growth in the organized retail sector
FIGURE 23 US: RETAIL SALES, 2010-2019 (USD TRILLION)
FIGURE 24 GCC: RETAIL FOOD SALES PENETRATION, BY COUNTRY (%)
5.2.3.2 Government support for infrastructure development to reduce post-harvest & processed food wastage
5.2.3.3 Increasing foreign direct investments in emerging markets
5.2.4 CHALLENGES
5.2.4.1 Lack of proper infrastructure in emerging markets
5.2.4.2 Rising fuel costs and high capital investment requirement
5.3 ECOSYSTEM/MARKET MAP
FIGURE 25 MARKET ECOSYSTEM
FIGURE 26 MARKET MAP
5.4 SUPPLY CHAIN
FIGURE 27 COLD CHAIN MARKET: SUPPLY CHAIN
5.5 VALUE CHAIN
FIGURE 28 MARKET FOR COLD CHAIN: VALUE CHAIN
5.6 YC-YCC SHIFT
5.7 TECHNOLOGY ANALYSIS
5.8 KEY TECHNOLOGIES
5.9 PATENT ANALYSIS
TABLE 3 LIST OF PATENT REGISTRATION, 2012–2017
6 MEANS OF TEMPERATURE CONTROL (Page No. - 60)
6.1 CONVENTIONAL REFRIGERATION
6.1.1 MECHANICAL REFRIGERATION
6.2 USING PACKAGING MATERIALS
6.2.1 DRY ICE
TABLE 4 DRY ICE REQUIREMENT DURING TRANSIT, WITH RESPECT TO THE QUANTITY OF FOOD
6.2.2 WET ICE
6.2.3 GEL PACKS
TABLE 5 TYPES OF CONTAINERS USED FOR GEL PACKS
6.2.4 EUTECTIC PLATES
6.2.5 LIQUID NITROGEN
6.2.6 INSULATED BLANKETS
6.2.7 EXPANDED POLYSTYRENE
7 COLD CHAIN MARKET, BY TECHNOLOGY (Page No. - 63)
7.1 INTRODUCTION
7.2 BLAST FREEZING
7.3 VAPOR COMPRESSION
7.4 PROGRAMMABLE LOGIC CONTROLLER
7.5 EVAPORATIVE COOLING
7.6 CRYOGENIC SYSTEMS
7.7 OTHER TECHNOLOGIES
8 COLD CHAIN MARKET, BY TYPE (Page No. - 66)
8.1 INTRODUCTION
8.2 REFRIGERATED WAREHOUSE
TABLE 6 REFRIGERATED WAREHOUSE ROOM CLASSIFICATION AND TEMPERATURE RANGES
TABLE 7 REFRIGERATED WAREHOUSING MARKET SIZE, BY REGION, 2017–2019 (MILLION CUBIC METERS)
TABLE 8 REFRIGERATED WAREHOUSING MARKET SIZE, BY REGION, 2020–2025 (MILLION CUBIC METERS)
8.3 REFRIGERATED TRANSPORTATION
TABLE 9 REFRIGERATED TRANSPORTATION MARKET SIZE, BY REGION, 2017–2019 (UNITS)
TABLE 10 REFRIGERATED TRANSPORTATION MARKET SIZE, BY REGION, 2020–2025 (UNITS)
TABLE 11 REFRIGERATED TRANSPORTATION MARKET SIZE, BY REGION, 2017–2019 (USD MILLION)
TABLE 12 REFRIGERATED TRANSPORTATION MARKET SIZE, BY REGION, 2020–2025 (USD MILLION)
8.3.1 REFRIGERATED ROAD TRANSPORT
TABLE 13 REFRIGERATED TRANSPORT MARKET SIZE, BY VEHICLE TYPE, 2017–2019 (UNITS)
TABLE 14 REFRIGERATED TRANSPORT MARKET SIZE, BY VEHICLE TYPE, 2020–2025 (UNITS)
TABLE 15 REFRIGERATED TRANSPORT MARKET SIZE, BY VEHICLE TYPE, 2017–2019 (USD MILLION)
TABLE 16 REFRIGERATED TRANSPORT MARKET SIZE, BY VEHICLE TYPE, 2020–2025 (USD MILLION)
8.3.1.1 Refrigerated LCV (Van)
TABLE 17 LCV: REFRIGERATED ROAD TRANSPORT MARKET SIZE, BY REGION, 2017–2019 (UNITS)
TABLE 18 LCV: REFRIGERATED ROAD TRANSPORT MARKET SIZE, BY REGION, 2020–2025 (UNITS)
TABLE 19 LCV: REFRIGERATED ROAD TRANSPORT MARKET SIZE, BY REGION, 2017–2019 (USD MILLION)
TABLE 20 LCV: REFRIGERATED ROAD TRANSPORT MARKET SIZE, BY REGION, 2020–2025 (USD MILLION)
8.3.1.2 Refrigerated MHCV (Truck)
TABLE 21 MHCV: REFRIGERATED ROAD TRANSPORT MARKET SIZE, BY REGION, 2017–2019 (UNITS)
TABLE 22 MHCV: REFRIGERATED ROAD TRANSPORT MARKET SIZE, BY REGION, 2020–2025 (UNITS)
TABLE 23 MHCV: REFRIGERATED ROAD TRANSPORT MARKET SIZE, BY REGION, 2017–2019 (USD MILLION)
TABLE 24 MHCV: REFRIGERATED ROAD TRANSPORT MARKET SIZE, BY REGION, 2020–2025 (USD MILLION)
8.3.1.3 Refrigerated HCV (Trailers & Semi-trailers)
TABLE 25 HCV: REFRIGERATED ROAD TRANSPORT MARKET SIZE, BY REGION, 2017–2019 (UNITS)
TABLE 26 HCV: REFRIGERATED ROAD TRANSPORT MARKET SIZE, BY REGION, 2020–2025 (UNITS)
TABLE 27 HCV: REFRIGERATED ROAD TRANSPORT MARKET SIZE, BY REGION, 2017–2019 (USD MILLION)
TABLE 28 HCV: REFRIGERATED ROAD TRANSPORT MARKET SIZE, BY REGION, 2020–2025 (USD MILLION)
8.3.2 REFRIGERATED SEA TRANSPORT
8.3.3 REFRIGERATED RAIL TRANSPORT
8.3.4 REFRIGERATED AIR TRANSPORT
9 COLD CHAIN MARKET, BY TEMPERATURE TYPE (Page No. - 78)
9.1 INTRODUCTION
FIGURE 29 MARKET SHARE (VALUE), BY TEMPERATURE TYPE, 2020 VS. 2025
TABLE 29 MARKET SIZE, BY TEMPERATURE TYPE, 2017–2019 (USD MILLION)
TABLE 30 MARKET SIZE, BY TEMPERATURE TYPE, 2020–2025 (USD MILLION)
9.1.1 COVID-19 IMPACT ON THE COLD CHAIN MARKET, BY TEMPERATURE TYPE
9.1.1.1 Optimistic Scenario
TABLE 31 OPTIMISTIC SCENARIO: COLD CHAIN MARKET SIZE, BY TEMPERATURE TYPE, 2018–2021 (USD BILLION)
9.1.1.2 Pessimistic scenario
TABLE 32 PESSIMISTIC SCENARIO: MARKET SIZE, BY TEMPERATURE TYPE, 2018–2021 (USD BILLION)
9.2 CHILLED
TABLE 33 CHILLED: MARKET SIZE FOR COLD CHAIN, BY REGION, 2017–2019 (USD BILLION)
TABLE 34 CHILLED: MARKET SIZE, BY REGION, 2020–2025 (USD BILLION)
9.3 FROZEN
TABLE 35 FROZEN: MARKET SIZE FOR COLD CHAIN, BY REGION, 2017–2019 (USD BILLION)
TABLE 36 FROZEN: MARKET SIZE, BY REGION, 2020–2025 (USD BILLION)
10 COLD CHAIN MARKET, BY APPLICATION (Page No. - 83)
10.1 INTRODUCTION
FIGURE 30 COLD CHAIN MARKET SHARE (VALUE), BY APPLICATION, 2020 VS. 2025 (USD MILLION)
TABLE 37 MARKET SIZE, BY APPLICATION, 2017–2019 (USD MILLION)
TABLE 38 MARKET SIZE, BY APPLICATION, 2020–2025 (USD MILLION)
10.1.1 COVID-19 IMPACT ON THE COLD CHAIN MARKET, BY APPLICATION
10.1.1.1 Optimistic Scenario
TABLE 39 OPTIMISTIC SCENARIO: COLD CHAIN MARKET SIZE, BY APPLICATION, 2018–2021 (USD BILLION)
10.1.1.2 Pessimistic scenario
TABLE 40 PESSIMISTIC SCENARIO: MARKET SIZE, BY APPLICATION, 2018–2021 (USD BILLION)
10.2 DAIRY & FROZEN DESSERTS
TABLE 41 DAIRY & FROZEN DESSERTS: MARKET SIZE FOR COLD CHAIN, BY REGION, 2017–2019 (USD MILLION)
TABLE 42 DAIRY & FROZEN DESSERTS: MARKET SIZE, BY REGION, 2020–2025 (USD MILLION)
10.3 FISH, MEAT, AND SEAFOOD PRODUCTS
TABLE 43 FISH, MEAT, AND SEAFOOD PRODUCTS: MARKET SIZE FOR COLD CHAIN, BY REGION, 2017–2019 (USD MILLION)
TABLE 44 FISH, MEAT, AND SEAFOOD PRODUCTS: MARKET SIZE, BY REGION, 2020–2025 (USD MILLION)
10.4 FRUITS & VEGETABLES
TABLE 45 FRUITS & VEGETABLES: MARKET SIZE, BY REGION, 2017–2019 (USD MILLION)
TABLE 46 FRUITS & VEGETABLES: MARKET SIZE, BY REGION, 2020–2025 (USD MILLION)
10.5 BAKERY & CONFECTIONERY PRODUCTS
TABLE 47 BAKERY & CONFECTIONERY PRODUCTS: COLD CHAIN MARKET SIZE, BY REGION, 2017–2019 (USD MILLION)
TABLE 48 BAKERY & CONFECTIONERY PRODUCTS: MARKET SIZE, BY REGION, 2020–2025 (USD MILLION)
10.6 OTHERS
TABLE 49 OTHERS: MARKET SIZE FOR COLD CHAIN, BY REGION, 2017–2019 (USD MILLION)
TABLE 50 OTHERS: MARKET SIZE, BY REGION, 2020–2025 (USD MILLION)
11 COLD CHAIN MARKET, BY REGION (Page No. - 92)
11.1 INTRODUCTION
FIGURE 31 MARKET GROWTH RATE (BY VALUE), BY KEY COUNTRY, 2019
FIGURE 32 ASIA PACIFIC TO LEAD GLOBAL MARKET, 2020 –2025 (USD MILLION)
TABLE 51 MARKET SIZE, BY REGION, 2017–2019 (USD MILLION)
TABLE 52 MARKET SIZE, BY REGION, 2020–2025 (USD MILLION)
11.1.1 COVID-19 IMPACT ON THE COLD CHAIN MARKET, BY REGION
11.1.1.1 Optimistic scenario
TABLE 53 OPTIMISTIC SCENARIO: MARKET SIZE FOR COLD CHAIN, BY REGION, 2018–2021 (USD MILLION)
11.1.1.2 Pessimistic scenario
TABLE 54 PESSIMISTIC SCENARIO: MARKET SIZE, BY REGION, 2018–2021 (USD MILLION)
11.2 NORTH AMERICA
TABLE 55 NORTH AMERICA: COLD CHAIN MARKET SIZE, BY TEMPERATURE TYPE, 2017–2019 (USD MILLION)
TABLE 56 NORTH AMERICA: MARKET SIZE, BY TEMPERATURE TYPE, 2020–2025 (USD MILLION)
TABLE 57 NORTH AMERICA: MARKET SIZE, BY APPLICATION, 2017–2019 (USD MILLION)
TABLE 58 NORTH AMERICA: MARKET SIZE, BY APPLICATION, 2020–2025 (USD MILLION)
TABLE 59 NORTH AMERICA: MARKET SIZE FOR FROZEN FRUITS & VEGETABLES, BY COUNTRY, 2018–2025 (USD MILLION)
TABLE 60 NORTH AMERICA: MARKET SIZE FOR FROZEN BAKERY & CONFECTIONERY PRODUCTS, BY COUNTRY, 2018–2025 (USD MILLION)
TABLE 61 NORTH AMERICA: MARKET SIZE FOR FROZEN DAIRY & FROZEN DESSERTS, BY COUNTRY, 2018–2025 (USD MILLION)
TABLE 62 NORTH AMERICA: MARKET SIZE FOR FROZEN FISH, MEAT, AND SEAFOOD PRODUCTS, BY COUNTRY, 2018–2025 (USD MILLION)
TABLE 63 NORTH AMERICA: MARKET SIZE FOR OTHER FROZEN PRODUCTS, BY COUNTRY, 2018–2025 (USD MILLION)
TABLE 64 NORTH AMERICA: MARKET SIZE, BY COUNTRY, 2017–2019 (USD MILLION)
TABLE 65 NORTH AMERICA: MARKET SIZE, BY COUNTRY, 2020–2025 (USD MILLION)
TABLE 66 NORTH AMERICA: REFRIGERATED WAREHOUSE MARKET SIZE, BY COUNTRY, 2017–2019 (MILLION CUBIC METERS)
TABLE 67 NORTH AMERICA: REFRIGERATED WAREHOUSE MARKET SIZE, BY COUNTRY, 2020–2025 (MILLION CUBIC METERS)
TABLE 68 NORTH AMERICA: REFRIGERATED TRANSPORTATION MARKET SIZE, BY COUNTRY, 2017–2019 (UNITS)
TABLE 69 NORTH AMERICA: REFRIGERATED TRANSPORTATION MARKET SIZE, BY COUNTRY, 2020–2025 (UNITS)
TABLE 70 NORTH AMERICA: REFRIGERATED TRANSPORTATION MARKET SIZE, BY COUNTRY, 2017–2019 (USD MILLION)
TABLE 71 NORTH AMERICA: REFRIGERATED TRANSPORTATION MARKET SIZE, BY COUNTRY, 2020–2025 (USD MILLION)
11.3 REGULATORY FRAMEWORK
11.3.1 US
11.3.2 CANADA
11.3.3 OVERVIEW OF THE US
TABLE 72 TOP TEN PLAYERS IN THE US REFRIGERATED WAREHOUSE MARKET
TABLE 73 US: MARKET SIZE FOR COLD CHAIN, BY TYPE, 2018-2025
TABLE 74 US: MARKET SIZE, BY APPLICATION, 2018–2025 (USD MILLION)
11.3.4 OVERVIEW OF CANADA
TABLE 75 CANADA: COLD CHAIN MARKET SIZE, BY TYPE, 2018-2025
TABLE 76 CANADA: MARKET SIZE, BY APPLICATION, 2018–2025 (USD MILLION)
11.3.5 MEXICO
TABLE 77 MEXICO: COLD CHAIN MARKET SIZE, BY TYPE, 2018-2025
TABLE 78 MEXICO: MARKET SIZE, BY APPLICATION, 2018–2025 (USD MILLION)
11.4 EUROPE
11.5 TARIFF AND REGULATORY LANDSCAPE
FIGURE 33 EUROPE: COLD CHAIN MARKET SNAPSHOT
TABLE 79 EUROPE: MARKET SIZE, BY TEMPERATURE TYPE, 2017–2019 (USD MILLION)
TABLE 80 EUROPE: MARKET SIZE, BY TEMPERATURE TYPE, 2020–2025 (USD MILLION)
TABLE 81 EUROPE: MARKET SIZE, BY APPLICATION, 2017–2019 (USD MILLION)
TABLE 82 EUROPE: MARKET SIZE, BY APPLICATION, 2020–2025 (USD MILLION)
TABLE 83 EUROPE: MARKET SIZE FOR FROZEN FRUITS & VEGETABLES, BY COUNTRY, 2018–2025 (USD MILLION)
TABLE 84 EUROPE: MARKET SIZE FOR FROZEN BAKERY & CONFECTIONERY PRODUCTS, BY COUNTRY, 2018–2025 (USD MILLION)
TABLE 85 EUROPE: MARKET SIZE FOR FROZEN DAIRY & FROZEN DESSERTS, BY COUNTRY, 2018–2025 (USD MILLION)
TABLE 86 EUROPE: MARKET SIZE FOR FROZEN FISH, MEAT, AND SEAFOOD PRODUCTS, BY COUNTRY, 2018–2025 (USD MILLION)
TABLE 87 EUROPE: MARKET SIZE FOR OTHER FROZEN PRODUCTS, BY COUNTRY, 2018–2025 (USD MILLION)
TABLE 88 EUROPE: MARKET SIZE, BY COUNTRY, 2017–2019 (USD MILLION)
TABLE 89 EUROPE: MARKET SIZE, BY COUNTRY, 2020–2025 (USD MILLION)
TABLE 90 EUROPE: REFRIGERATED WAREHOUSE MARKET SIZE, BY COUNTRY, 2017–2019 (MILLION CUBIC METERS)
TABLE 91 EUROPE: REFRIGERATED WAREHOUSE MARKET SIZE, BY COUNTRY, 2020–2025 (MILLION CUBIC METERS)
TABLE 92 EUROPE: REFRIGERATED TRANSPORTATION MARKET SIZE, BY COUNTRY, 2017–2019 (UNITS)
TABLE 93 EUROPE: REFRIGERATED TRANSPORTATION MARKET SIZE, BY COUNTRY, 2020–2025 (UNITS)
TABLE 94 EUROPE: REFRIGERATED TRANSPORTATION MARKET SIZE, BY COUNTRY, 2017–2019 (USD MILLION)
TABLE 95 EUROPE: REFRIGERATED TRANSPORTATION MARKET SIZE, BY COUNTRY, 2020–2025 (USD MILLION)
11.5.1 GERMANY
11.5.1.1 The country is a major importer and exporter of agricultural products
TABLE 96 GERMANY: MARKET SIZE FOR COLD CHAIN, BY TYPE, 2018-2025
TABLE 97 GERMANY: MARKET SIZE, BY APPLICATION, 2018–2025 (USD MILLION)
11.5.2 FRANCE
11.5.2.1 Frozen food market of France contributes to the growth of the market
TABLE 98 FRANCE: COLD CHAIN MARKET SIZE, BY TYPE, 2018-2025
TABLE 99 FRANCE: MARKET SIZE, BY APPLICATION, 2018–2025 (USD MILLION)
11.5.3 UK
11.5.3.1 Cold chain market in the UK also focuses on environmental issues
TABLE 100 UK: MARKET SIZE FOR COLD CHAIN, BY TYPE, 2018-2025
TABLE 101 UK: MARKET SIZE, BY APPLICATION, 2018–2025 (USD MILLION)
11.5.4 ITALY
11.5.4.1 Changing consumer behavior and attitude leading to the growth of the cold chain market
TABLE 102 ITALY: MARKET SIZE FOR COLD CHAIN, BY TYPE, 2018-2025
TABLE 103 ITALY:MARKET SIZE, BY APPLICATION, 2018–2025 (USD MILLION)
11.5.5 SPAIN
11.5.5.1 Development of technology has contributed to the cold chain market in Spain
TABLE 104 SPAIN: COLD CHAIN MARKET SIZE, BY TYPE, 2018-2025
TABLE 105 SPAIN: MARKET SIZE, BY APPLICATION, 2018–2025 (USD MILLION)
11.5.6 NETHERLANDS
11.5.6.1 Large market for fruits & vegetables and growing food & beverage processing industry leading to a rise in demand for cold chain services
TABLE 106 NETHERLANDS: MARKET SIZE FOR COLD CHAIN, BY TYPE, 2018-2025
TABLE 107 NETHERLANDS: MARKET SIZE, BY APPLICATION, 2018–2025 (USD MILLION)
11.5.7 REST OF EUROPE
11.5.7.1 Development of the cold chain market is dependent on the growing food & beverage industry
TABLE 108 REST OF EUROPE: COLD CHAIN MARKET SIZE, BY TYPE, 2018-2025
TABLE 109 REST OF EUROPE: MARKET SIZE, BY APPLICATION, 2018–2025 (USD MILLION)
11.6 ASIA PACIFIC
FIGURE 34 ASIA PACIFIC: COLD CHAIN MARKET SNAPSHOT
TABLE 110 ASIA PACIFIC: COLD CHAIN MARKET SIZE, BY TEMPERATURE TYPE, 2017–2019 (USD MILLION)
TABLE 111 ASIA PACIFIC:MARKET SIZE, BY TEMPERATURE TYPE, 2020–2025 (USD MILLION)
TABLE 112 ASIA PACIFIC: MARKET SIZE, BY APPLICATION, 2017–2019 (USD MILLION)
TABLE 113 ASIA PACIFIC: MARKET SIZE, BY APPLICATION, 2020–2025 (USD MILLION)
TABLE 114 ASIA PACIFIC: MARKET SIZE FOR FROZEN FRUITS & VEGETABLES, BY COUNTRY, 2018–2025 (USD MILLION)
TABLE 115 ASIA PACIFIC: MARKET SIZE FOR FROZEN BAKERY & CONFECTIONERY PRODUCTS, BY COUNTRY, 2018–2025 (USD MILLION)
TABLE 116 ASIA PACIFIC: MARKET SIZE FOR FROZEN DAIRY & FROZEN DESSERTS, BY COUNTRY, 2018–2025 (USD MILLION)
TABLE 117 ASIA PACIFIC: MARKET SIZE FOR FROZEN FISH, MEAT, AND SEAFOOD PRODUCTS, BY COUNTRY, 2018–2025 (USD MILLION)
TABLE 118 ASIA PACIFIC: MARKET SIZE FOR OTHER FROZEN PRODUCTS, BY COUNTRY, 2018–2025 (USD MILLION)
TABLE 119 ASIA PACIFIC: MARKET SIZE, BY COUNTRY, 2017–2019 (USD MILLION)
TABLE 120 ASIA PACIFIC: MARKET SIZE, BY COUNTRY, 2020–2025 (USD MILLION)
TABLE 121 ASIA PACIFIC: REFRIGERATED WAREHOUSE MARKET SIZE, BY COUNTRY, 2017–2019 (MILLION CUBIC METERS)
TABLE 122 ASIA PACIFIC: REFRIGERATED WAREHOUSE MARKET SIZE, BY COUNTRY, 2020–2025 (MILLION CUBIC METERS)
TABLE 123 ASIA PACIFIC: REFRIGERATED TRANSPORTATION MARKET SIZE, BY COUNTRY, 2017–2019 (UNITS)
TABLE 124 ASIA PACIFIC: REFRIGERATED TRANSPORTATION MARKET SIZE, BY COUNTRY, 2020–2025 (UNITS)
TABLE 125 ASIA PACIFIC: REFRIGERATED TRANSPORTATION MARKET SIZE, BY COUNTRY, 2017–2019 (USD MILLION)
TABLE 126 ASIA PACIFIC: REFRIGERATED TRANSPORTATION MARKET SIZE, BY COUNTRY, 2020–2025 (USD MILLION)
11.7 REGULATORY FRAMEWORK
11.7.1 CHINA
11.7.2 INDIA
11.7.2.1 Financial assistance for setting up of cold chain
11.7.2.1.1 Ministry of Food Processing Industry (MoFPI)
11.7.2.1.2 Foreign Direct Investment (FDI) in Cold Chain
11.7.2.2 Essential Commodities Act
11.7.2.3 Ease of doing business
11.7.3 AUSTRALIA
11.7.3.1 Never warmer than
11.7.3.2 Maximum “out of refrigeration” time limit
11.7.3.3 First expiry first out
11.7.4 CHINA
11.7.4.1 China’s cold chain industry is at an initial stage of development
TABLE 127 CHINA: COLD CHAIN MARKET SIZE, BY TYPE, 2018-2025
TABLE 128 CHINA: MARKET SIZE, BY APPLICATION, 2018–2025 (USD MILLION)
11.7.5 JAPAN
11.7.5.1 Using their R&D capabilities, companies in Japan are developing advanced cold chain technologies
TABLE 129 JAPAN: COLD CHAIN MARKET SIZE, BY TYPE, 2018-2025
TABLE 130 JAPAN: MARKET SIZE, BY APPLICATION, 2018–2025 (USD MILLION)
11.7.6 INDIA
11.7.6.1 Government is introducing schemes to support the cold chain industry
TABLE 131 INDIA: COLD CHAIN MARKET SIZE, BY TYPE, 2018-2025
TABLE 132 INDIA: MARKET SIZE, BY APPLICATION, 2018–2025 (USD MILLION)
11.7.7 AUSTRALIA & NEW ZEALAND
11.7.7.1 Export of food products has shaped the refrigerated transportation sector
TABLE 133 AUSTRALIA & NEW ZEALAND: COLD CHAIN MARKET SIZE, BY TYPE, 2018-2025
TABLE 134 AUSTRALIA & NEW ZEALAND: MARKET SIZE, BY APPLICATION, 2018–2025 (USD MILLION)
11.7.8 REST OF ASIA PACIFIC
11.7.8.1 Rise in food & beverage international trade in the region augments the demand for cold chain
TABLE 135 REST OF ASIA PACIFIC: COLD CHAIN MARKET SIZE, BY TYPE, 2018-2025
TABLE 136 REST OF ASIA PACIFIC: MARKET SIZE, BY APPLICATION, 2018–2025 (USD MILLION)
11.8 REST OF THE WORLD
TABLE 137 REST OF THE WORLD: COLD CHAIN MARKET SIZE, BY TEMPERATURE TYPE, 2017–2019 (USD MILLION)
TABLE 138 REST OF THE WORLD: MARKET SIZE, BY TEMPERATURE TYPE, 2020–2025 (USD MILLION)
TABLE 139 REST OF THE WORLD: MARKET SIZE, BY APPLICATION, 2017–2019 (USD MILLION)
TABLE 140 REST OF THE WORLD: MARKET SIZE, BY APPLICATION, 2020–2025 (USD MILLION)
TABLE 141 REST OF THE WORLD: MARKET SIZE FOR FROZEN FRUITS & VEGETABLES, BY REGION, 2018–2025 (USD MILLION)
TABLE 142 REST OF THE WORLD: MARKET SIZE FOR FROZEN BAKERY & CONFECTIONERY PRODUCTS, BY REGION, 2018–2025 (USD MILLION)
TABLE 143 REST OF THE WORLD: MARKET SIZE FOR FROZEN DAIRY & FROZEN DESSERTS, BY REGION, 2018–2025 (USD MILLION)
TABLE 144 REST OF THE WORLD: MARKET SIZE FOR FROZEN FISH, MEAT, AND SEAFOOD PRODUCTS, BY REGION, 2018–2025 (USD MILLION)
TABLE 145 REST OF THE WORLD: MARKET SIZE FOR OTHER FROZEN PRODUCTS, BY REGION, 2018–2025 (USD MILLION)
TABLE 146 REST OF THE WORLD: REFRIGERATED WAREHOUSE MARKET SIZE, BY REGION, 2017–2019 (MILLION CUBIC METERS)
TABLE 147 REST OF THE WORLD: REFRIGERATED WAREHOUSE MARKET SIZE, BY REGION, 2020–2025 (MILLION CUBIC METERS)
TABLE 148 REST OF THE WORLD: REFRIGERATED TRANSPORTATION MARKET SIZE, BY REGION, 2017–2019 (UNITS)
TABLE 149 REST OF THE WORLD: REFRIGERATED TRANSPORTATION MARKET SIZE, BY REGION, 2020–2025 (UNITS)
TABLE 150 REST OF THE WORLD: REFRIGERATED TRANSPORTATION MARKET SIZE, BY REGION, 2017–2019 (USD MILLION)
TABLE 151 REST OF THE WORLD: REFRIGERATED TRANSPORTATION MARKET SIZE, BY REGION, 2020–2025 (USD MILLION)
TABLE 152 REST OF THE WORLD: COLD CHAIN MARKET SIZE, BY REGION, 2018–2025 (USD MILLION)
11.8.1 SOUTH AMERICA
TABLE 153 SOUTH AMERICA: COLD CHAIN MARKET SIZE, BY TYPE, 2018-2025
TABLE 154 SOUTH AMERICA: MARKET SIZE, BY APPLICATION, 2018–2025 (USD MILLION)
11.8.2 AFRICA
11.8.2.1 Lack of infrastructure and weak organization and poor logistic arrangements are the key challenges for the growth of the African cold chain market
TABLE 155 AFRICA: COLD CHAIN MARKET SIZE, BY TYPE, 2018-2025
TABLE 156 AFRICA: MARKET SIZE, BY APPLICATION, 2018–2025 (USD MILLION)
11.8.3 MIDDLE EAST
11.8.3.1 Significant reliance on food imports to drive the growth of the Middle East’s cold chain market but weak supply chain network to inhibit the development
TABLE 157 MIDDLE EAST: COLD CHAIN MARKET SIZE, BY TYPE, 2018-2025
TABLE 158 MIDDLE EAST: MARKET SIZE, BY APPLICATION, 2018–2025 (USD MILLION)
12 COMPETITIVE LANDSCAPE (Page No. - 150)
12.1 MARKET EVALUATION FRAMEWORK
FIGURE 35 KEY DEVELOPMENT OF THE LEADING PLAYERS IN THE MARKET, 2017-2020
FIGURE 36 MARKET EVALUATION FRAMEWORK, 2017–2020
12.2 MARKET SHARE ANALYSIS, 2019
FIGURE 37 REFRIGERATED WAREHOUSE: MARKET SHARE ANALYSIS, 2020
12.3 COMPETITIVE SCENARIO
12.3.1 EXPANSIONS, INVESTMENTS & ACQUISITIONS
TABLE 159 EXPANSIONS, INVESTMENTS & ACQUISITIONS, 2018–2020
12.3.2 AGREEMENTS, COLLABORATIONS, AND JOINT VENTURES
TABLE 160 AGREEMENTS, COLLABORATIONS, AND JOINT VENTURES, 2018–2020
12.3.3 NEW SERVICE LAUNCHES
TABLE 161 NEW SERVICE LAUNCHES, 2018–2020
13 COMPANY EVALUATION MATRIX AND COMPANY PROFILES (Page No. - 161)
13.1 OVERVIEW
13.2 COMPANY EVALUATION MATRIX DEFINITIONS & METHODOLOGY
13.2.1 STAR
13.2.2 PERVASIVE
13.2.3 EMERGING LEADERS
13.2.4 EMERGING COMPANIES
13.3 COLD CHAIN MARKET: COMPANY EVALUATION MATRIX, 2019 (OVERALL MARKET)
14 COMPANY PROFILES (Page No. - 163)
(Business Overview, Services Offered, Recent Developments, right to win)*
14.1 AMERICOLD LOGISTICS
FIGURE 38 AMERICOLD LOGISTICS: COMPANY SNAPSHOT
14.2 LINEAGE LOGISTICS HOLDINGS, LLC
14.3 NICHIREI CORPORATION
FIGURE 39 NICHIREI CORPORATION: COMPANY SNAPSHOT
14.4 BURRIS LOGISTICS
14.5 AGRO MERCHANTS GROUP
14.6 KLOOSTERBOER GROUP
14.7 UNITED STATES COLD STORAGE
14.8 TIPPMANN GROUP
14.9 VERSACOLD LOGISTICS SERVICES
14.10 HENNINGSEN COLD STORAGE CO.
14.11 STARTUP/SME EVALUATION MATRIX
14.11.1 COMPETITIVE LEADERSHIP MAPPING (STARTUP/SME)
14.11.1.1 Progressive companies
14.11.1.2 Starting blocks
14.11.1.3 Responsive companies
14.11.1.4 Dynamic companies
FIGURE 40 COLD CHAIN MARKET: COMPETITIVE LEADERSHIP MAPPING, 2019
14.12 STARTUP/SME PROFILES
14.12.1 COLDMAN LOGISTICS
14.12.2 CONGEBEC INC.
14.12.3 CONESTOGA COLD STORAGE
14.12.4 NEWCOLD
14.12.5 HANSON LOGISTICS
14.12.6 CONFEDERATION FREEZERS
14.12.7 SEAFRIGO
14.12.8 TRENTON COLD STORAGE
14.12.9 MTC LOGISTICS
14.12.10 STOCKHABO
*Details on Business Overview, Services Offered, Recent Developments, right to win might not be captured in case of unlisted companies.
15 APPENDIX (Page No. - 194)
15.1 DISCUSSION GUIDE
15.2 KNOWLEDGE STORE: MARKETSANDMARKETS’ SUBSCRIPTION PORTAL
15.3 AVAILABLE CUSTOMIZATIONS
15.4 RELATED REPORTS
15.5 AUTHOR DETAILS
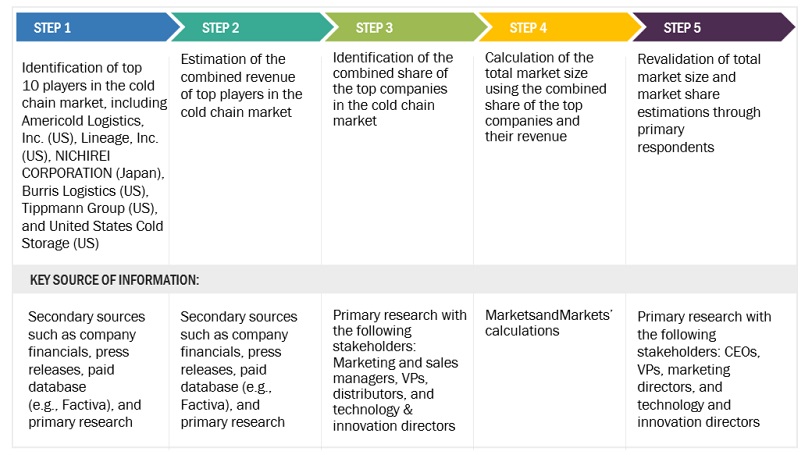
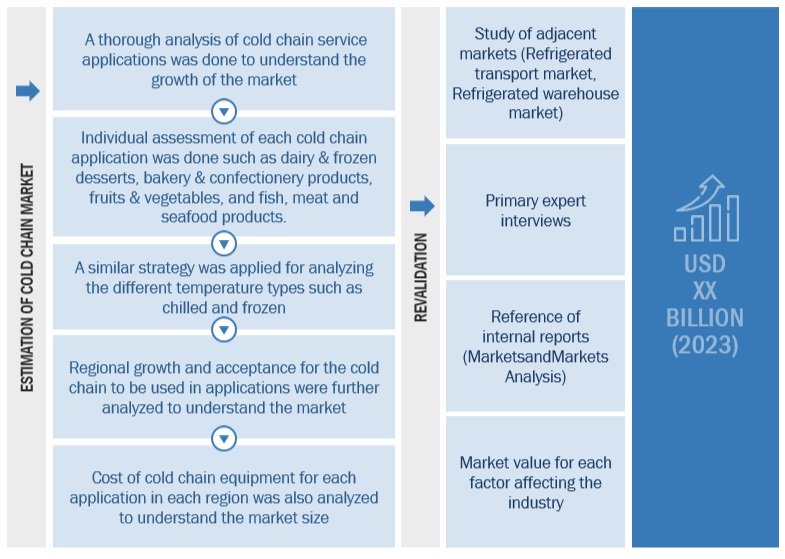
The study involves four major activities to estimate the current market size of the cold chain market. Exhaustive secondary research was done to collect information on the market, peer market, and parent market. These findings, assumptions, and market sizes were validated with industry experts across the value chain through primary research. Both the top-down and bottom-up approaches were employed to estimate the complete market size. After that, the market breakdown and data triangulation approaches were used to estimate the market size of various segments and subsegments.
In the secondary research process, various secondary sources such as Food and Agriculture Organization (FAO), World Food Logistics Organization (WFLO), Global Cold Chain Alliance (GCCA), European Cold Storage and Logistics Association, Federation of Cold Storage Association of India, Hoovers, Bloomberg BusinessWeek, and Dun & Bradstreet were referred to identify and collect information for this study. These secondary sources included annual reports, press releases & investor presentations of companies, white papers, certified publications, articles by recognized authors, food safety organizations, regulatory bodies, and trade directories.
The cold chain market comprises several stakeholders such as cold chain service providers, refrigerated transport and transport equipment providers, logistics service providers who comprise the supply side. The demand side comprises manufacturers and traders of dairy & frozen desserts, meat & seafood, fruits & vegetables, and bakery & confectionery products. Some of the other demand-side stakeholders include manufacturers of agricultural products as well. Primary data was collected through questionnaires, e-mails, and telephonic interviews.
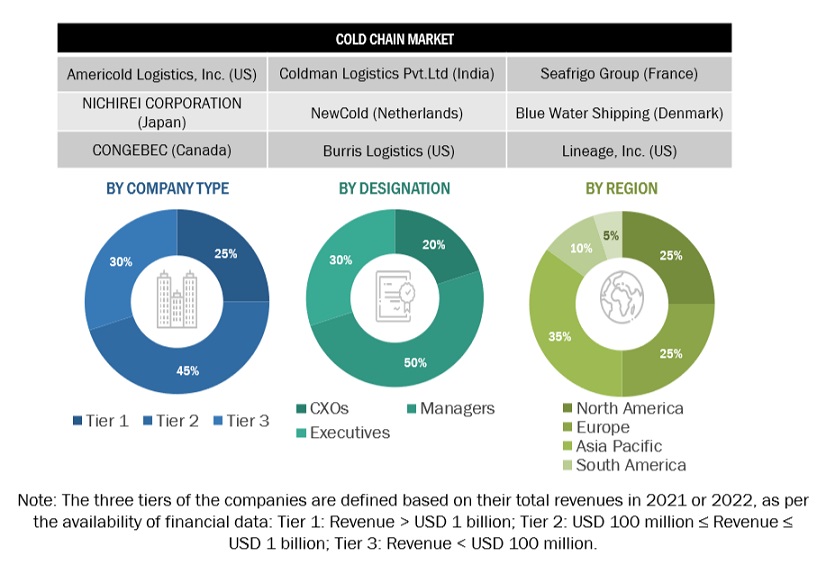
Various primary sources from both the supply and demand sides of the market have been interviewed to obtain qualitative and quantitative information. The figure below showcases the breakdown of primary respondents:
To know about the assumptions considered for the study, download the pdf brochure
Both the top-down and bottom-up approaches were used to estimate and validate the total size of the cold chain market. These approaches were also used extensively to estimate the size of various dependent submarkets. The research methodology used to estimate the market size include the following:
The supply-side analysis was conducted by analyzing the refrigerated warehousing capacity of the key players in the cold chain market. The estimated production capacities were validated with key stakeholders in the market. The top 8 companies who account for a majority share in the market were identified to arrive at the global market size for the cold chain market
After arriving at the overall market size—using the market size estimation processes as explained above—the market was split into several segments and subsegments. To complete the overall market engineering process and arrive at the exact statistics of each market segment and subsegment, the data triangulation and market breakdown procedures were employed. The data was triangulated by studying various factors and trends from both the demand and supply sides in the cold chain market.
Based on the given market data, MarketsandMarkets offers customizations in the reports according to client-specific requirements. The available customization options are as follows:
Growth opportunities and latent adjacency in Cold Chain Market