
Cold Chain Monitoring Market Size, Share & Trends

Cold Chain Monitoring Market Size, Share, Growth & Trends by Sensors and Data Loggers, RFID Devices, Telematics & Telemetry Devices, Networking Devices, Logistics (Storage, Transportation), Application (Pharmaceuticals & Healthcare, Food & Beverages) - Global Forecast to 2030


COLD CHAIN MONITORING MARKET OVERVIEW
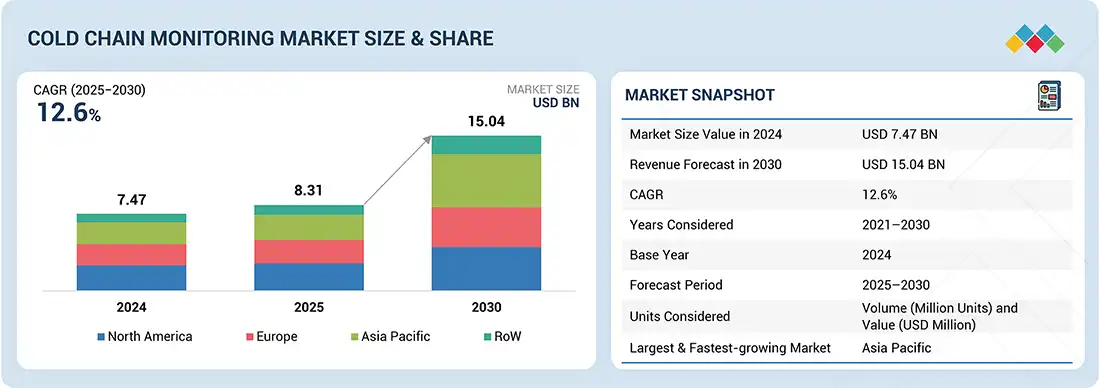
According to Marketsandmarkets, the global cold chain monitoring market size was valued at USD 8.31 billion in 2025 and is projected to reach USD 15.04 billion by 2030, growing at a CAGR of 12.6% from 2025 to 2030. Stringent regulatory standards and compliance requirements drive the cold chain monitoring industry by ensuring the safety and integrity of temperature-sensitive products. Regulatory bodies, including the FDA, USDA, and EMA, mandate continuous monitoring, accurate documentation, and adherence to storage and transport guidelines. Advanced solutions, such as IoT-enabled sensors, data loggers, and cloud platforms, help companies meet these requirements, reduce risks, and maintain product quality. The focus on regulatory compliance also enhances supply chain efficiency and transparency.
REPORT SCOPE
| REPORT METRIC | DETAILS |
|---|---|
| Market Size in 2025 (Value) | USD 8.31 Billion |
| Market Forecast in 2030 (Value) | USD 15.04 Billion |
| Growth Rate | CAGR of 12.6% from 2025–2030 |
| Years Considered | 2021–2030 |
| Base Year | 2024 |
| Forecast Period | 2025–2030 |
| Units Considered | Volume (Million Units) and Value (USD Billion) |
| Report Coverage | Revenue Forecast, Company Ranking, Competitive Landscape, Growth Factors, and Trends |
| Segments Covered |
|
| Regional Scope | North America, Europe, Asia Pacific, and RoW |
| Top Companies |
|
| Growth Drivers |
|
Market Size & Forecast
KEY TAKEAWAYS
- The North America cold chain monitoring market accounted for a 32.9% revenue share in 2024.
- By temperature type, the frozen segment is expected to register the highest CAGR of 13.8%.
- By offering, the software segment is projected to grow at the fastest rate from 2025 to 2030.
- By logistics, the storage segment is expected to dominate the market.
- By application, the food & beverages segment is expected to dominate the market.
- Carrier, Testo SE & Co. KGaA, and Cryoport Inc. were identified as some of the star players in the cold chain monitoring market size(global), given their strong market share and product footprint.
- Rotronic AG, SpotSee, and Tive, Inc., among others, have distinguished themselves among startups and SMEs by securing strong footholds in specialized niche areas, underscoring their potential as emerging market leaders
Future opportunities in the cold chain monitoring industry are abundant, driven by technological advancements and evolving industry needs. Rise in real-time visibility and predictive analytics, leveraging artificial intelligence and machine learning to anticipate and prevent temperature excursions, rather than just reacting to them, contributes to the market growth. The expansion into emerging markets, with their growing pharmaceuticals and food sectors, presents vast potential. Furthermore, the increasing demand for sustainable and energy-efficient cold chain solutions to reduce environmental impact will drive the market. Furthermore, the integration of blockchain for enhanced transparency and traceability across complex global supply chains will become a key differentiator, creating new avenues for innovation and value creation.
Source: Secondary Research, Interviews with Experts, MarketsandMarkets Analysis
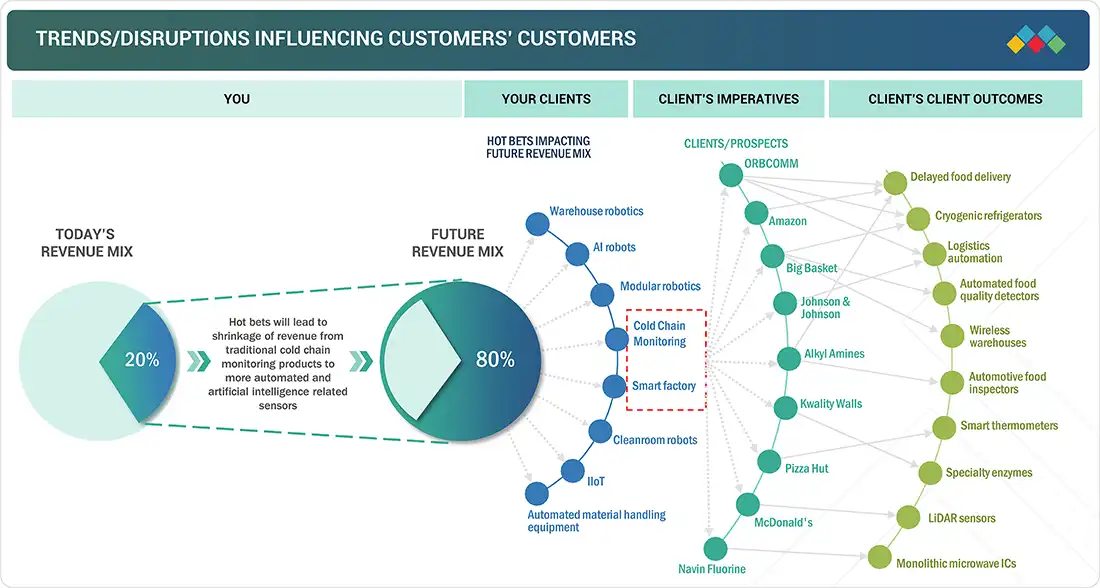
TRENDS & DISRUPTIONS IMPACTING CUSTOMERS' CUSTOMERS
The adoption of cold chain monitoring solutions across diverse applications, such as pharmaceuticals & healthcare, food & beverages, and chemicals, is anticipated to accelerate market demand. At the same time, niche use cases, including smart factories, quality testing, and food processing, present emerging opportunities for solution providers. Furthermore, specialized industries, such as pharmaceuticals, cosmetics, and food & beverages, are projected to become key revenue pockets, with a noticeable shift in client spending expected across the pharmaceuticals & healthcare, chemicals, and food & beverages sectors.
Source: Secondary Research, Interviews with Experts, MarketsandMarkets Analysis
MARKET DYNAMICS
Level
-
Expansion of e-commerce and direct-to-consumer pharma and food delivery

-
Reducing global food waste unlocks value in cold chain ecosystems

Level
-
Capital-intensive cold chain monitoring rationalizes CapEx allocation

-
Sustainability challenges and emissions-intensive cold chain operations

Level
-
Smart warehousing and digital cold chain solutions

-
Emerging market penetration through expanding cold chain ecosystems in developing regions

Level
-
Rising complexity in installing and monitoring cold chain systems

-
Infrastructure gaps and connectivity barriers in emerging markets

Source: Secondary Research, Interviews with Experts, MarketsandMarkets Analysis
Driver: Rising demand for temperature-sensitive pharmaceuticals and technological advancements
The cold chain monitoring market is propelled by the surging demand for temperature-sensitive pharmaceuticals, such as vaccines, biologics, and specialty drugs, that require strict temperature control. Growing adoption of biologics, gene therapies, and personalized medicines has amplified the need for precise monitoring. Regulatory mandates on good distribution practices (GDP) also push adoption, while advancements in IoT sensors, RFID, GPS, and cloud analytics are enabling real-time visibility and risk mitigation across supply chains. These factors fuel sustained growth in healthcare logistics and intelligent monitoring solutions.
Restraint: High implementation and maintenance costs
A major restraint for the cold chain monitoring market is the high cost of implementation and maintenance. Advanced systems using IoT sensors, RFID, GPS, and cloud platforms require heavy upfront investment, which is often prohibitive for SMEs and cost-sensitive sectors. Ongoing expenses, such as calibration, software upgrades, and equipment replacement, further raise ownership costs. Thin-margin industries, including food and retail, struggle to justify the investment, while fragmented logistics and weak digital infrastructure in developing regions reduce reliability and adoption. These financial and infrastructural hurdles slow market penetration, especially in emerging economies.
Opportunity: AI-driven predictive analytics and emerging markets
The cold chain monitoring market presents strong opportunities through AI-driven predictive analytics, which can forecast failures and disruptions in advance, reducing waste and optimizing logistics. Growing emphasis on sustainability fuels the demand for energy-efficient, eco-friendly monitoring solutions. At the same time, emerging markets in the Asia Pacific, Latin America, and Africa are witnessing rising demand for pharmaceuticals, frozen foods, and online grocery deliveries, supported by stricter regulations on safety and compliance. Scalable, cost-effective, and cloud-based solutions tailored to local needs will gain traction, allowing companies to turn compliance challenges into avenues for growth and competitive advantage.
Challenge: Integration complexity and cybersecurity risks
The cold chain monitoring market faces major challenges around integration and cybersecurity. Multiple stakeholders use diverse systems, making interoperability across IoT devices, GPS, WMS, and ERP platforms challenging, often creating data silos and inefficiencies. Growing digitalization also heightens cybersecurity risks, with threats of hacking, breaches, and data manipulation that could compromise product safety and compliance. Adhering to varied global regulations adds further complexity and cost, limiting scalability for international operators. Overcoming these issues is essential to ensure reliability, trust, and widespread adoption of cold chain monitoring solutions.
Cold Chain Monitoring Market Growth: COMMERCIAL USE CASES ACROSS INDUSTRIES
| COMPANY | USE CASE DESCRIPTION | BENEFITS |
|---|---|---|
 |
Offers comprehensive supply chain visibility solutions for temperature-sensitive cargo, including IoT-enabled data loggers, real-time telematics, and cloud-based platforms for monitoring pharmaceuticals, biologics, and perishable goods from origin to destination | Enhances cargo transparency, enables proactive issue resolution, ensures regulatory compliance, reduces spoilage risks, and supports sustainability by minimizing waste in the cold chain |
 |
Provides wireless data loggers and monitoring systems for temperature and humidity in storage, transport, and facilities, with cloud-based Saveris platform for food retail, pharma, and logistics applications | Optimizes compliance with HACCP and GxP standards, enables real-time alerts for deviations, reduces manual logging, improves food safety, and cuts operational costs through automated reporting |
 |
Delivers cryogenic and ultra-cold shipping systems with integrated Smartpak monitoring, including LN2 dry-vapor shippers and cloud platforms for biologics, vaccines, and cell therapies across the life sciences supply chain | Ensures chain-of-condition and custody for high-value materials, mitigates risks in multi-modal transport, supports ISO compliance, and provides 24/7 visibility to prevent product degradation and enable faster commercialization |
 |
Supplies reefer telematics solutions with sensors, satellite/cellular connectivity, and CargoWatch software for remote monitoring and control of refrigerated trailers, containers, and assets in food and pharma logistics | Prevents spoilage and lost revenue through automated alarms and two-way control, simplifies FSMA compliance with data retention, optimizes fuel and maintenance, and boosts fleet efficiency across road, rail, and sea |
 |
Offers IoT-based real-time visibility platforms with sensors, analytics, and 24/7 monitoring services for end-to-end cold chain management in pharma, biotech, and food sectors | Drives zero-waste supply chains via predictive insights and automated workflows, enhances patient safety and product integrity, reduces environmental impact, and ensures GxP compliance with audit-ready reporting |
Logos and trademarks shown above are the property of their respective owners. Their use here is for informational and illustrative purposes only.
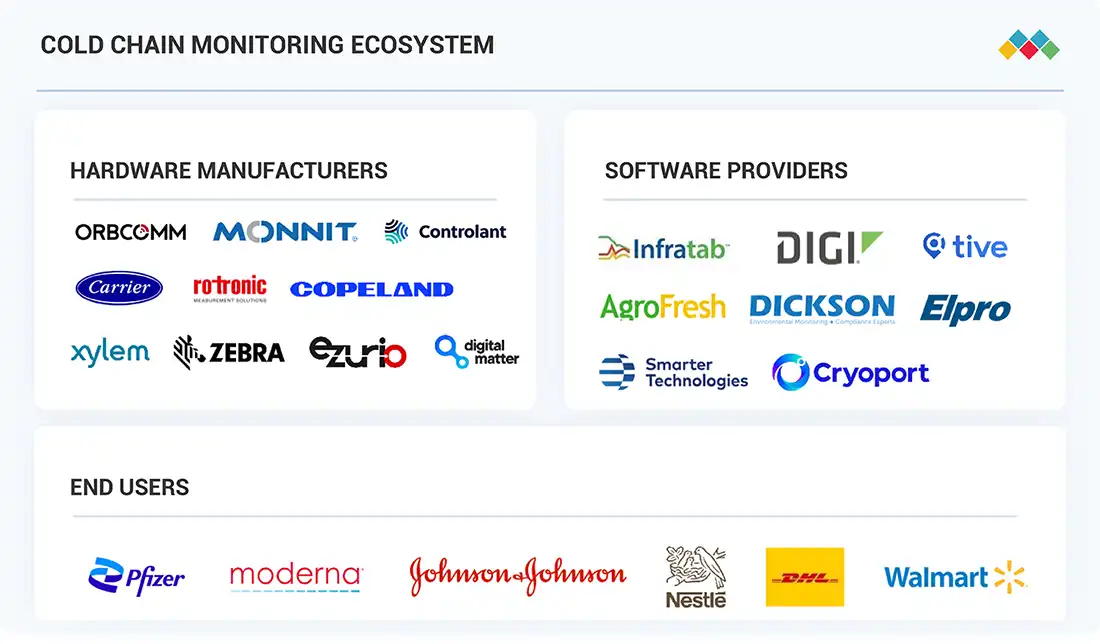
MARKET ECOSYSTEM
The cold chain monitoring ecosystem includes hardware manufacturers, software providers, and end users to ensure temperature-sensitive goods are safely stored and transported. Hardware manufacturers, such as Carrier, Controlant hf., Monnit Corporation, Copeland, and Zebra Technologies, supply sensors, RFID devices, and data loggers for real-time tracking. Software providers, including Infratab, Digi, Tive, AgroFresh, and Elpro, deliver IoT platforms, analytics, and compliance solutions that transform monitoring data into actionable insights. End users, including logistics firms (Maersk, DHL), retailers (Walmart, Nestlé), and pharmaceutical leaders (Pfizer, Moderna, Johnson & Johnson), rely on these technologies to maintain product integrity, minimize losses, and meet regulatory standards across global supply chains.
Logos and trademarks shown above are the property of their respective owners. Their use here is for informational and illustrative purposes only.
MARKET SEGMENTS
Source: Secondary Research, Interviews with Experts, MarketsandMarkets Analysis
Cold Chain Monitoring Market, By Temperature Type
The cold chain monitoring market is segmented into frozen and chilled categories. The chilled segment commands the largest share, as products such as dairy, fresh fruits, vegetables, and beverages require chilled conditions to retain quality and extend shelf life. This segment dominates due to the high consumption of fresh produce and ready-to-eat meals worldwide. Frozen solutions, however, remain critical for meat, seafood, and long-term storage applications, ensuring product safety during extended transit. The balance between chilled and frozen logistics ensures efficiency across diverse industries.
Cold Chain Monitoring Market, by Offering
By offering, the market is divided into hardware and software solutions. Hardware leads the market, as sensors, data loggers, RFID devices, routers, and gateways form the backbone of cold chain monitoring infrastructure. The demand is fuelled by the need for reliable, accurate, and real-time data capture across storage and transportation. Meanwhile, software is growing at the fastest CAGR, driven by IoT connectivity, AI-powered analytics, and cloud-based platforms that enhance visibility, predictive decision-making, and compliance. Hardware and software create a comprehensive monitoring ecosystem.
Cold Chain Monitoring Market, by Logistics
Cold chain logistics consists of storage and transportation segments. Storage holds the largest market share, as warehouses, distribution centres, and retail cold storage facilities require advanced monitoring to maintain strict temperature and humidity conditions. With the rising demand for frozen and chilled goods, the investment in storage monitoring is expanding rapidly. Transportation is equally vital, as refrigerated trucks, containers, and air freight integrate monitoring devices for real-time tracking. However, storage dominates due to longer holding durations and regulatory requirements for compliance at fixed facilities.
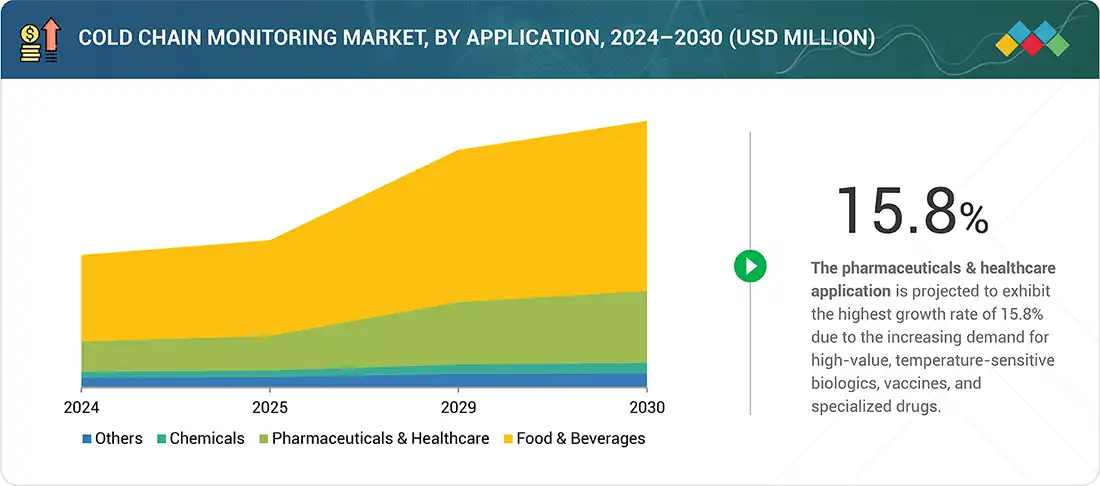
Cold Chain Monitoring Market, by Application
The market applications include pharmaceuticals & healthcare, food & beverages, and chemicals. The food & beverages sector leads in market size, supported by global demand for fresh, frozen, and packaged food, coupled with stricter safety standards. This segment benefits from cold chain monitoring to reduce spoilage and ensure consistent quality. On the other hand, pharmaceuticals & healthcare are projected to grow at the highest CAGR, as biologics, vaccines, and specialty drugs require precise temperature control. Increasing adoption of personalized medicine and biologics further accelerates growth, making healthcare a key driver of cold chain advancements.
REGION
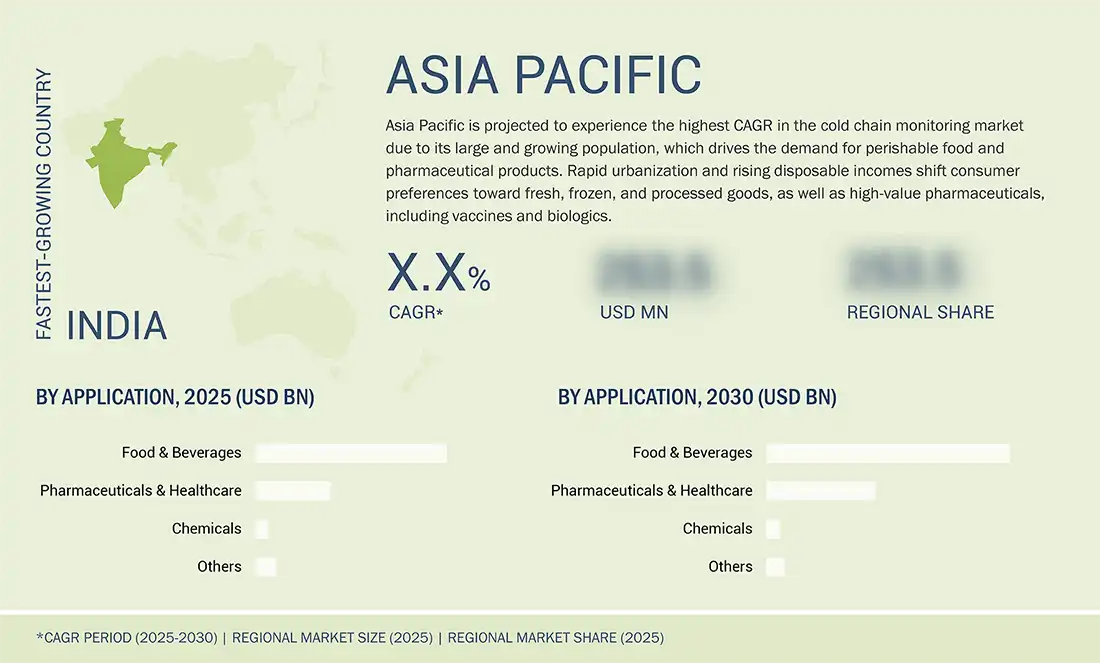
Asia Pacific to hold the largest market share in the global cold chain monitoring market growth during the forecast period
Asia Pacific is projected to grow at the highest CAGR in the cold chain monitoring market from 2025 to 2030 due to the rising demand for fresh and frozen foods, expanding pharmaceutical production, and increasing vaccine exports. Rapid urbanization, growth of e-commerce and online grocery delivery, and stricter food safety and drug regulations further drive the adoption of cold chain monitoring solutions. Governments and private players are also investing heavily in cold storage infrastructure and smart logistics, making the region the fastest-growing market for cold chain monitoring.
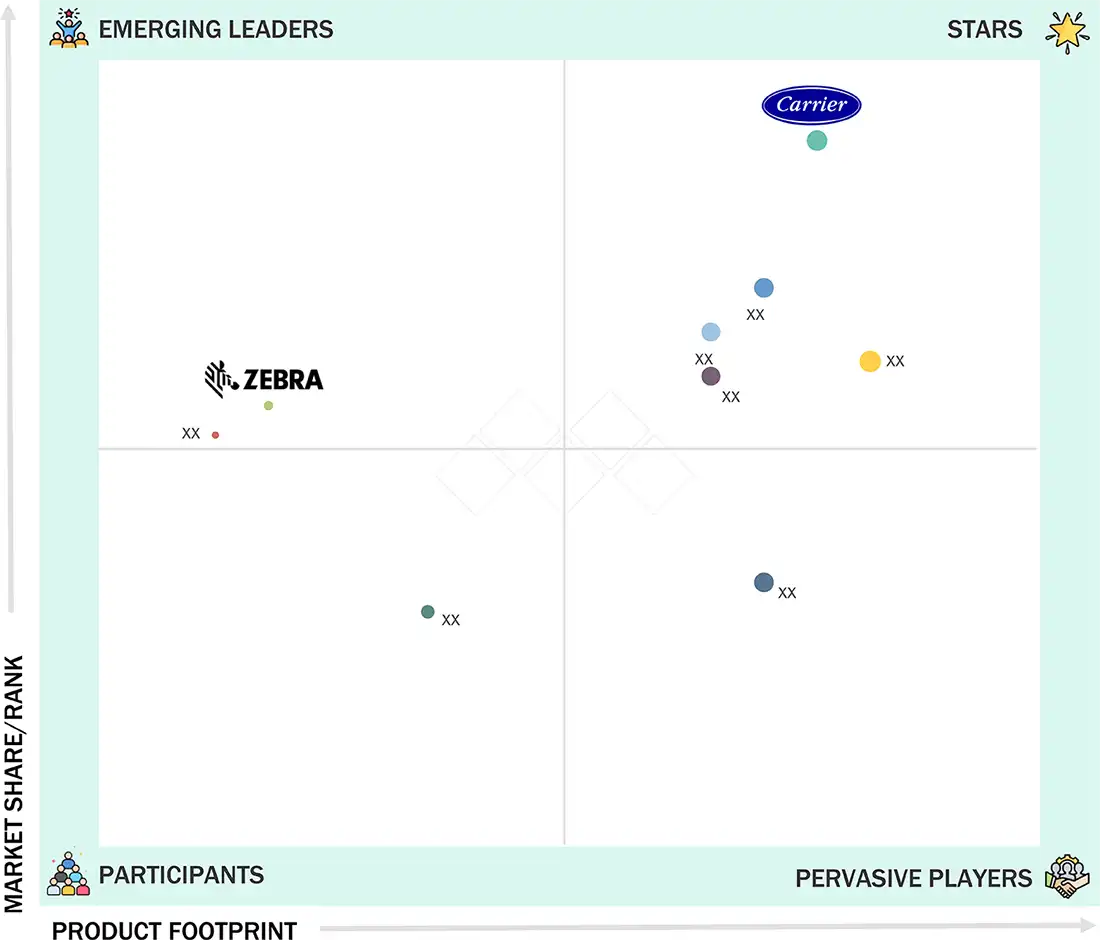
Cold Chain Monitoring Companies: COMPANY EVALUATION MATRIX
In the cold chain monitoring market trendsmatrix, Carrier is positioned as a star player due to its strong product footprint and dominant market share, reflecting its leadership in innovation and adoption across OEMs. Zebra Technologies Corp., on the other hand, is seen as an emerging leader, holding a significant market share but with a comparatively smaller product footprint, indicating strong growth potential as it expands its cold chain monitoring offerings.
Source: Secondary Research, Interviews with Experts, MarketsandMarkets Analysis
WHAT IS IN IT FOR YOU: Cold Chain Monitoring Market Share REPORT CONTENT GUIDE
DELIVERED CUSTOMIZATIONS
We have successfully delivered the following deep-dive customizations:
| CLIENT REQUEST | CUSTOMIZATION DELIVERED | VALUE ADDS |
|---|---|---|
| Global Pharmaceutical Company | Benchmarking of cold chain monitoring solutions for vaccine distribution across multiple geographies | • Improved logistics efficiency and minimized spoilage risk, ensuring compliance with global regulatory standards |
| European Food & Beverage Supplier | Cost-benefit analysis of IoT-based monitoring hardware vs. traditional data loggers | • Enabled optimized sourcing strategy, reduced operational costs, and improved real-time visibility into perishable goods |
| North American Retail Giant | Market mapping of cold storage infrastructure providers and last-mile monitoring solutions | • Supported vendor selection strategy and reduced supply chain disruption risks for fresh and frozen products |
| Asian Logistics Service Provider | Technology adoption roadmap for RFID- and sensor-based cold chain monitoring in cross-border trade | • Enhanced cross-border compliance, reduced cargo rejection rates, and improved customer trust with traceable deliveries |
| Global Chemical Manufacturer | Regulatory benchmarking of cold chain monitoring solutions for hazardous chemicals across regions | • Accelerated approval processes, highlighted compliance risks, and streamlined safety monitoring strategy |
RECENT DEVELOPMENTS
- July 2025 : ELPRO enhanced its liberoMANAGER software to version 3.0, integrating real-time monitoring capabilities for comprehensive cold chain visibility. This upgrade allows seamless management of all LIBERO data loggers—USB, Bluetooth, and IoT-enabled Gx devices—within a single validated platform. Key features include automated shipping processes, proactive alerts, simplified product release, and customizable dashboards, all designed to reduce product loss and ensure compliance. Additionally, ELPRO offers flexible rental options for real-time data loggers, aligning with sustainability goals.
- April 2025 : Tive, Inc. launched Solo Pro, a fully validated, multi-sensor tracker that provides real-time visibility for biologic and pharmaceutical shipments, including dry ice and cryogenic shipments via its large e-paper display and robust compliance with FDA 21 CFR Part 11, EU Annex 11, SOC 2 Type 2, and ISO/IEC 27001. It enables instant condition checks, accelerates quality releases, and enhances cold chain resilience.
- March 2025 : Carrier (through its Sensitech subsidiary) launched Lynx FacTOR, a transformative SaaS solution designed for the pharmaceutical cold chain. This platform automates end-to-end product release evaluations, consolidating disparate data sources to assess temperature excursions, batch stability, and compliance in minutes rather than days. Device-agnostic and 21 CFR Part 11-compliant, Lynx FacTOR streamlines decision-making, accelerates batch release cycles, and reinforces product quality and patient safety while enhancing operational efficiency and regulatory alignment.
- November 2024 : Monnit launched its Next Wi-Fi Sensors and expanded the ALTA line with advanced monitoring and control devices. These innovations enhance precision in temperature and humidity tracking, directly supporting cold chain monitoring by ensuring reliable environmental control for sensitive goods across storage and transport.
- October 2024 : Controlant hf. entered a strategic partnership with simulation specialist SmartCAE to enhance cold chain packaging decisions using real-time IoT insights and digital modelling. By integrating Controlant’s live logger data (temperature and location) with SmartCAE’s lane risk and thermal packaging simulations, pharmaceutical manufacturers can make smarter, greener, and data-driven decisions—optimizing safety and environmental sustainability while reducing costs and over-engineering.
- May 2023 : ORBCOMM introduced the RT-8000, a next-generation, EN 12830-compliant telematics device tailored for refrigerated fleets across Europe. Built for superior connectivity, it includes three embedded SIMs, extensive wireless sensor support, and enhanced memory to deliver richer, faster data for compliance, temperature monitoring, fuel management, and remote control. Designed to boost operational efficiency and cargo integrity, the RT-8000 aims to reduce spoilage claims and elevate cold chain visibility with advanced automated insights.
Table of Contents
 Exclusive indicates content/data unique to MarketsandMarkets and not available with any competitors.
Methodology
The study involved major activities in estimating the current market size for the cold chain monitoring market. Exhaustive secondary research was done to collect information on the cold chain monitoring industry. The next step was to validate these findings, assumptions, and sizing with industry experts across the value chain using primary research. Different approaches, such as top-down and bottom-up, were employed to estimate the total market size. After that, the market breakup and data triangulation procedures were used to estimate the market size of the segments and subsegments of the cold chain monitoring market.
Secondary Research
Secondary research for this study involved gathering information from various credible sources such as company reports, white papers, journals, and industry publications. This process helped in understanding the supply and value chains, identifying key players, analyzing market segmentation and regional trends, and tracking major market and technology developments. The data collected was used to estimate the overall market size, which was later validated through primary research.
Primary Research
Extensive primary research was conducted after gaining knowledge about the current scenario of the cold chain monitoring market through secondary research. Several primary interviews were conducted with experts from the demand and supply sides across four major regions—North America, Europe, Asia Pacific, and RoW. This primary data was collected through questionnaires, emails, and telephonic interviews.

Notes: RoW mainly comprises the Middle East, Africa, and South America.
Other designations include product managers, sales managers, and marketing managers.
Tier 1 companies include market players with revenues above USD 500 million; tier 2 companies earn revenues between USD 100 million and USD 500 million; and tier 3 companies earn revenues of up to USD 100 million.
To know about the assumptions considered for the study, download the pdf brochure
Market Size Estimation
The bottom-up procedure has been employed to arrive at the overall size of the cold chain monitoring market.
- Collected company-level revenues from annual reports and financial disclosures
- Aggregated product-level revenues across hardware and software to estimate market segments
- Identified key players’ contributions to cold chain monitoring solutions
- Summed up the company revenues to obtain the global market size
The top-down approach has been used to estimate and validate the total size of the cold-chain monitoring market.
- Estimated overall cold chain monitoring market size using industry-level data (cold chain logistics spend, cold storage capacity, pharma & F&B trade volumes)
- Applied adoption/penetration rates of monitoring solutions across applications, temperature ranges, and logistics
- Derived regional and country-level splits based on infrastructure readiness, regulatory compliance, and trade data
- Validated subsegment distribution through primary research and expert insights
Cold Chain Monitoring Market : Top-Down and Bottom-Up Approach

Data Triangulation
After arriving at the overall market size using the market size estimation processes as explained above, the market has been split into several segments and subsegments. To complete the entire market engineering process and arrive at the exact statistics of each market segment and subsegment, data triangulation and market breakdown procedures have been employed, wherever applicable. The data has been triangulated by studying various factors and trends from the demand and supply sides in the cold chain monitoring market.
Market Definition
The cold chain monitoring refers to the ecosystem of technologies, solutions, and services designed to track, control, and optimize temperature-sensitive supply chains, ensuring product safety, regulatory compliance, and operational efficiency across industries such as food & beverages, pharmaceuticals & healthcare, chemicals, agriculture, and manufacturing. It encompasses hardware devices like sensors & data loggers, RFID devices, telematics & telemetry devices, and networking devices, as well as advanced software platforms that leverage IoT, cloud computing, and AI for real-time visibility and predictive analytics. Unlike traditional logistics systems, cold chain monitoring focuses on maintaining product integrity during storage, transportation, and distribution by reducing temperature excursions and minimizing spoilage.
Key Stakeholders
- Cold chain warehouses
- Sensors manufactures
- Logistics companies
- Manufacturers of pharmaceuticals
- Large-scale farmers
- Fisheries
- Manufacturers of dairy products
- Pharmacies
- Large food retailers
- Food processing companies
- Distributors
- Investors
- Government organizations
- Research organizations
- Organizations related to cold chains
Report Objectives
- To define, describe, and forecast the size of the cold chain monitoring market, by temperature type, logistics, offering, application, and region, in terms of value
- To describe and forecast the size of the cold chain monitoring market, by offering, in terms of volume
-
To forecast the market for various segments concerning the main regions, namely,
North America, Europe, Asia Pacific, and the Rest of the World (RoW), in terms of value - To provide macroeconomic outlooks concerning the main regions, namely, North America, Europe, Asia Pacific, and the Rest of the World (RoW)
- To provide detailed information regarding the drivers, restraints, opportunities, and challenges influencing the market’s growth
- To strategically analyze micromarkets1 concerning individual growth trends, prospects, and contributions to the total market
- To provide ecosystem analysis, value chain, trends/disruptions impacting customer business, technology analysis, pricing analysis, case study analysis, trade analysis, patent analysis, Porter’s five forces, key conferences & events, AI impact, impact of 2025 US tariff, and regulations related to the cold chain monitoring market
- To analyze the opportunities in the market for stakeholders by identifying high-growth segments and detailing the competitive landscape for market players
- To strategically profile key players and comprehensively analyze their market rankings, core competencies, company evaluation matrix, and competitive scenario, along with detailing the competitive landscape for the market leaders
- To analyze competitive developments, such as product launches, collaborations, and acquisitions, carried out by market players
- To benchmark players within the market using the competitive leadership mapping framework, which analyzes market players on various parameters within the broad categories of business strategy excellence and strength of product portfolio.
Available Customizations
With the given market data, MarketsandMarkets offers customizations according to the company‘s specific needs. The following customization options are available for the report.
Company Information:
- Detailed analysis and profiling of additional market players (up to five)
Key Questions Addressed by the Report
What is the current size of the Cold Chain Monitoring market?
The global Cold Chain Monitoring market is valued at USD 8.31 billion in 2025 and is projected to reach USD 15.04 billion by 2030. (MarketsandMarkets)
What is the expected growth rate of the Cold Chain Monitoring market?
The market is expected to grow at a CAGR of 12.6% during the forecast period from 2025 to 2030. (MarketsandMarkets)
What are the major growth drivers for the Cold Chain Monitoring industry?
Key growth drivers include stringent regulatory compliance requirements, expansion of e-commerce and direct-to-consumer food and pharmaceutical delivery, increasing demand for temperature-sensitive products, and the adoption of IoT-enabled monitoring solutions. (MarketsandMarkets)
What are the key technology trends in the Cold Chain Monitoring market?
Major trends include IoT-enabled sensors, cloud-based monitoring platforms, AI-powered predictive analytics, real-time visibility solutions, RFID tracking, telematics, and digital cold chain ecosystems. (MarketsandMarkets)
Which offering segment is expected to grow the fastest?
The software segment is projected to grow at the fastest rate between 2025 and 2030 due to increasing adoption of cloud platforms, analytics tools, and AI-driven monitoring solutions. (MarketsandMarkets)
Which application segment dominates the Cold Chain Monitoring market?
The Food & Beverages segment is expected to account for the largest market share, driven by growing demand for fresh, frozen, and packaged food products requiring temperature-controlled logistics. (MarketsandMarkets)
Which region leads the Cold Chain Monitoring market?
North America held the largest market share in 2024, accounting for 32.9% of global revenue, supported by advanced cold chain infrastructure and strict regulatory standards. (MarketsandMarkets)
Which region is expected to witness the fastest growth?
Asia Pacific is projected to register the highest growth rate during the forecast period due to expanding pharmaceutical production, rising demand for fresh and frozen foods, and investments in cold storage infrastructure. (MarketsandMarkets)
Who are the leading companies operating in the Cold Chain Monitoring market?
Key players include Carrier, Testo SE & Co. KGaA, Cryoport Inc., ORBCOMM, Controlant hf., Zebra Technologies, ELPRO-BUCHS AG, and Monnit Corporation. (MarketsandMarkets)
How is the Cold Chain Monitoring market analyzed in the report?
The report uses both top-down and bottom-up market sizing approaches, supported by primary interviews, secondary research, company revenue analysis, data triangulation, competitive benchmarking, and regional forecasting to estimate market size and growth. (MarketsandMarkets)
Need a Tailored Report?
Customize this report to your needs
Get 10% FREE Customization
Customize This ReportPersonalize This Research
- Triangulate with your Own Data
- Get Data as per your Format and Definition
- Gain a Deeper Dive on a Specific Application, Geography, Customer or Competitor
- Any level of Personalization
Let Us Help You
- What are the Known and Unknown Adjacencies Impacting the Cold Chain Monitoring Market
- What will your New Revenue Sources be?
- Who will be your Top Customer; what will make them switch?
- Defend your Market Share or Win Competitors
- Get a Scorecard for Target Partners

Custom Market Research Services
We Will Customise The Research For You, In Case The Report Listed Above Does Not Meet With Your Requirements
Get 10% Free CustomisationTESTIMONIALS

Tetsuya Ohhira
Business Development Manager-Technology Business
Nikon Corporation,
Leading Japanese MNC specializing in optics and imaging productswww.nikon.com
MarketsandMarkets™ response
is quick. Their attitude is flexible and positive. Analyst Insights are globally considered and
significant. Client Services quickly respond to our inquiry and demand. Their wide range of global
surveys help us make our strategic plan.
We hope Knowledge Store will be easier to search
for a report.
VP - Marketing & Business Development
Leading Provider of Process Control Solutions
We engaged with MarketsandMarkets on a study to perform an analysis and recommend a Go-To-Market strategy for metrology and process control in the semiconductor market. The study was tailored to our targets and needs with well-defined milestones. Our overall experience with the MarketsandMarkets team was very good throughout the project in all aspects including the analysis methodologies used, the quality and depth of primary and secondary data sets, the professionalism and flexibility of the team and the ability to meet the target schedule and milestones. We want to thank MarketsandMarkets team for a job well done.
Growth opportunities and latent adjacency in Cold Chain Monitoring Market


Anthony
Apr, 2026
Does the report cover major players in the market along with their market share and strategies?.
Leroy
Apr, 2026
Can I get insights into the regulatory landscape affecting cold chain monitoring solutions in different countries?.
User
Sep, 2019
We have very niche offerings (i.e. sensors) in cold chain monitoring markets. We provide RFID based tags and dataloggers used for monitoring of the clod chain. I would like to know if only part of the report can be purchased? I am interested in datalogers and temperature sensors? .
User
Sep, 2019
I am really interested in the report. I expect the below to be part of your report - Hardware (sensor, integrator, software provider, logistics, etc) - segments size and growth (for technology, region, device type). Do you confirm? .
User
Sep, 2019
I am researching on the cold chain monitoring topic. Your publication seems really interesting to me and I am willing to purchase this report. Could you share the price for the same? I am also willing to get a better idea of the makeup of the market (Healthcare/Pharma/ Beverages/Food etc.). Is the report include region wise splits for all the applications categories and subcategories?.
User
Nov, 2019
Looking fot the specific information pertaining to Hardware and Software across logistics (Airways, roadways, and waterways) and region (Brazil, China, India, Australia, Japan ) primarily healthcare, food & beverage as well as branded retail (end-to-end) and any application of product-level monitoring. Could you provide this information?.
User
Mar, 2019
To evaluate before purchase, could you confirm what part of the below I can expect to find in your report and send me two sample tables of your chosing? - devices type (permanent, moveable, disposable, electronic, chemical, etc) - device technology (RF like BLE/WiFi/RFID/LPWAN, battery powered and battery type, etc) - regulatory status by region (logging / alerts, measurement precision, auditing, etc) - average selling price of devices and total cost of ownership of solutions by technology/capability .