Conveyor System Market

Conveyor System Market By Industry (Retail & Distribution, Food & Beverage, Automotive, Electronic, Mining, & Airport), Type (Belt, Roller, Overhead, Floor, Pallet, Crescent, Cable, Bucket) Component, Operation & Region - Global Forecast to 2030

Report Code: AT 4933 Sep, 2024, by marketsandmarkets.com

[355 Pages Report] The global conveyor system market is projected to grow from USD 10.44 billion in 2024 to USD 14.81 billion by 2030, registering a CAGR of 6.0%. Conveyor systems are in high demand across diverse industries, including aviation, automotive, retail & distribution, food & beverage, and mining, driven by advancements in automation, modular design, and sensor-driven operations. Automation has increased productivity for conveyor systems while reducing labor costs and errors. Modular designs are easily extended or reconfigured to suit changing industrial requirements due to their adaptability. Meanwhile, real-time data is delivered through sensor-driven processes that maximize output and minimize downtime. Modern driving technologies and componentry are evolving, boosting conveyor systems’ potential and effectiveness to meet the ever-changing needs of contemporary industry.

Conveyor System Market

To know about the assumptions considered for the study, Request for Free Sample Report

Conveyor System Market Opportunities

To know about the assumptions considered for the study, download the pdf brochure

MARKET DYNAMICS

Driver: High demand for conveyor systems from e-commerce industry

The rise in online purchases has led to the significant growth of the e-commerce industry. Flipkart (India) and Amazon (US) are the two major players in this industry. These companies need to maintain a large inventory in their warehouses. They must also provide delivery accuracy, same-day delivery, and free return policies. Consequently, they are looking for low-priced material handling solutions to reduce the time intervals for their delivery. Automated storage and retrieval systems (AS/RS) and conveyors have emerged as comprehensive solutions. For instance, FMH Conveyors (US), a renowned manufacturer of conveyors, made its debut with a new conveyor system designed for easy reconfiguration in April 2023. This system aims to enhance speed and efficiency during loading or unloading processes as well as sorting by enabling fast joining, disjointing, and rearranging of the conveyor lines.

Restraint: High installation and maintenance costs

A conveyor system can enhance the efficiency of a company’s production process or warehouse. However, implementing these systems may incur substantial costs, such as utility bills for electricity and maintenance requirements for hardware and software during operation. Moreover, the reliance on technology and machines introduces additional expenses, such as software and services, as well as advanced devices used in the installation phase. Investments in automated conveyor systems could be challenging for small and medium-sized firms seeking to expand their businesses.

Opportunity: Integration of lean logistics principles

The lean management principle focuses on maximizing customer value while minimizing waste. This plays a pivotal role in the logistics industry. Lean logistics involves the identification and elimination of wastes in the supply chain by separating value-adding processes from non-value-adding ones. The objective is to enhance product flow and speed by streamlining processes and optimizing the supply chain. To achieve this, efficient systems such as conveyors, automated storage and retrieval systems (AS/RS), and automated guided vehicles, among others, are employed to improve inventory and material management, which is crucial for the control of the supply chain. By integrating these principles with automation, industries can achieve more productivity, propelling the demand for advanced conveyor systems forward. In 2023, Get-inge (Sweden) launched a fully automated load system for terminal sterilizers. The safety components of a terminal sterilization cycle involve repetitive strain that may occur whenever large loads are lifted, pulled, or pushed, besides accidental damage caused by cranes or other machinery during loading into the autoclave chamber.

Challenge: Significant presence of local players in emerging markets

The conveyor system market is highly competitive, subject to the presence of different international players and local suppliers. Small to medium-sized companies serve as an essential part of Australia, China, and Africa, benefiting from abundant mining deposits. These companies offer smaller or tailored conveyor solutions as they are easier for customers to access and have better after-sales services. Conversely, bigger players in this market concentrate mainly on institutional purchases with high value, such as those that involve conveyor systems used in airport operations or automating manufacturing plants. This prevents prominent conveyor system firms from penetrating small-scale markets.

ECOSYSTEM ANALYSIS

The conveyor system market ecosystem comprises raw material suppliers, component/part manufacturers, control unit manufacturers, and OEMs. Conveyor system manufacturers procure parts/components, particularly machined & precision engineering components, from suppliers and design a tailored conveyor solution. Part manufacturers include companies that provide driving units, rubber belts or carriage equipment, aluminum profiles, and control units. Most conveyor system manufacturers in the industry manufacture their precision-engineered components in situ, whereas regional players collaborate with the vendors for their supplies, which are assembled at the former plant per the requirements.

Top Companies in Conveyor System Market

Floor conveyors to exhibit fastest growth by type

Floor conveyors are a cost-effective alternative to load-carrying trucks when moving goods from one place to another or performing other programmed movements necessary for manufacturing. These conveyors are equipped with sensors to detect and track items throughout the system, enabling instant feedback and system management, thereby enhancing control over the flow of goods. Their modular design also simplifies expansion or reconfiguration based on the specific needs of warehouses and production facilities. Thus, floor conveyors witness rapid adoption in both manufacturing and assembly sectors, which heavily rely on precision tracking during component assembly and production operations. Smart floor conveyors can further enhance efficiency by ensuring accessibility at assembly stations, thereby reducing the probability of errors.

Automatic conveyor systems to exhibit fastest growth by operation

Automatic conveyor systems offer multiple benefits over manual ones. The automation of material handling processes has decreased labor costs, making operations simpler and enabling personnel to concentrate on more critical tasks. These conveyors also enable accuracy, repeatability, and speed improvements while eliminating human mistakes and reducing manufacturing ineffectiveness. Moreover, automatic conveyors can transport larger quantities of materials faster than their manual counterparts, thereby increasing production volumes and enabling quicker deliveries. This primarily applies to industries with high-quality standards, such as pharmaceuticals. For instance, in March 2021, Tesla (US) opened the Gigafactory in Berlin to manufacture cells in-house together with electric vehicles.

Underground mining to exhibit fastest growth by mining application

Mining companies are expanding their underground operations to access larger quantities of minerals such as gold, copper, and other rare earth metals. The global demand for cleaner energy has increased the need for rare earth minerals, which are primarily extracted from deep mines and used in the manufacturing of batteries, electric cars, and renewable energy technology. The surge in underground mining projects can be further attributed to technological advancements in automation and safety. These factors propel the market for underground mining conveyor systems forward.

Asia Pacific to exhibit fastest growth by region

In Asia Pacific, industries such as automotive, food & beverage, and aviation are experiencing rapid infrastructure development and technological advancements, generating a high demand for conveyor systems. Aviation is among the fastest-growing industries in the region, with China significantly contributing to its growth. In January 2022, the country announced plans to construct 215 new airports by 2035 due to increasing passenger air and cargo transportation, as well as expanding tourism and economic growth (Source: Bureau of Transportation Statistics, 2022). Similarly, the automotive industry in Asia Pacific has recorded substantial growth, particularly in countries such as China and India. These countries have become a production hub for motor vehicles, attracting global investors due to low labor costs and high vehicle purchases. In response, prominent manufacturers such as BMW (Germany) and Volkswagen Group (Germany) have established their production facilities in Asia Pacific. Collectively, these factors drive the demand for conveyor systems, making it the fastest-growing region in the global market.

Conveyor System Market Size, and Share

Key Market Players

The conveyor system market is dominated by players such as Siemens AG (Germany), Continental AG (Germany), Daifuku Co., Ltd. (Japan), Fives Group (Paris), and Taikisha Ltd (Japan), among others. These companies develop innovative products, adopt expansion strategies, and undertake collaborations, partnerships, and mergers & acquisitions to strengthen their position in the market.

Get online access to the report on the World's First Market Intelligence Cloud

  • Easy to Download Historical Data & Forecast Numbers
  • Company Analysis Dashboard for high growth potential opportunities
  • Research Analyst Access for customization & queries
  • Competitor Analysis with Interactive dashboard
  • Latest News, Updates & Trend analysis
Request Sample

Scope of the Report

Report Metric

Details

Market size available for years

2019–2030

Base year considered

2023

Forecast period

2024–2030

Forecast units

Value (USD Billion/Million)

Segments covered

Industry (Retail & Distribution, Food & Beverage, Automotive, Electronics, Mining, Airport), Type (Belt, Roller, Overhead, Floor, Pallet, Crescent, Cable, Bucket, Others), Mining Technology, Mining Application, Component, Operation, and Region

Geographies covered

Asia Pacific, Europe, North America, and Rest of the World

Companies covered

Siemens AG (Germany), Continental AG (Germany), Daifuku Co., Ltd. (Japan), Fives Group (Paris), Taikisha Ltd (Japan), Honeywell International Inc. (US), Interroll Group (Switzerland), and Metso Outotec (Finland), among others

This research report categorizes the Conveyor System  market based on By inudstry type, By component type, operation Type,  By technology, and Region

CONVEYOR SYSTEM MARKET, BY TYPE
  • INTRODUCTION
  • BELT
  • ROLLER
  • TRI-PLANAR
  • CRESCENT
  • PALLET
  • OVERHEAD
  • FLOOR
  • BUCKET
  • CABLE
  • Others
  • KEY PRIMARY INSIGHTS
CONVEYOR SYSTEM MARKET, BY COMPONENT
  • INTRODUCTION
  • ALUMINUM PROFILE
  • DRIVING UNIT
  • EXTREMITY UNIT
  • KEY PRIMARY INSIGHTS
CONVEYOR SYSTEM MARKET, BY OPERATION
  • INTRODUCTION
  • MANUAL
  • SEMI-AUTOMATIC
  • AUTOMATIC
  • KEY PRIMARY INSIGHTS
CONVEYOR SYSTEM MARKET FOR AIRPORT INDUSTRY, BY CONVEYOR TYPE
  • INTRODUCTION
  • BELT
  • CRESCENT
  • TRI-PLANAR
  • OTHERS
  • KEY PRIMARY INSIGHTS
CONVEYOR SYSTEM MARKET FOR AIRPORT INDUSTRY, BY CONVEYOR TYPE
  • INTRODUCTION
  • BELT
  • ROLLER
  • PALLET
  • OTHERS
  • KEY PRIMARY INSIGHTS
CONVEYOR SYSTEM Market FOR MINING INDUSTRY, BY CONVEYOR TYPE
  • INTRODUCTION
  • BELT
  • CABLE
  • BUCKET
  • OTHERS
  • KEY PRIMARY INSIGHTS
MINING CONVEYOR SYSTEM MARKET, BY APPLICATION
  • INTRODUCTION
  • OPEN PIT MINING
  • UNDERGROUND MINING
  • KEY PRIMARY INSIGHTS
MINING CONVEYOR SYSTEM MARKET, BY TECHNOLOGY
  • INTRODUCTION
  • DRIVE
  • GEARLESS
  • AUTOMATION
  • KEY PRIMARY INSIGHTS
CONVEYOR SYSTEM MARKET FOR AUTOMOTIVE INDUSTRY, BY CONVEYOR TYPE
  • INTRODUCTION
  • FLOOR
  • OVERHEAD
  • ROLLER
  • OTHERS
  • KEY PRIMARY INSIGHTS
CONVEYOR SYSTEM market FOR ELECTRONICS INDUSTRY, BY CONVEYOR TYPE
  • INTRODUCTION
  • BELT
  • ROLLER
  • Others
  • KEY PRIMARY INSIGHTS
CONVEYOR SYSTEM market FOR FOOD & BEVERAGE INDUSTRY, BY SUB-INDUSTRY
  • INTRODUCTION
  • MEAT & POULTRY
  • DAIRY
  • OTHERS
  • KEY PRIMARY INSIGHTS
CONVEYOR SYSTEM Market, BY REGION
  • INTRODUCTION
  • ASIA PACIFIC
    • MACROECONOMIC OUTLOOK FOR ASIA PACIFIC
    • CHINA
    • JAPAN
    • SOUTH KOREA
    • INDIA
    • REST OF ASIA PACIFIC
  • EUROPE
    • MACROECONOMIC OUTLOOK FOR EUROPE
    • GERMANY
    • FRANCE
    • ITALY
    • SPAIN
    • UK
    • RUSSIA
    • REST OF EUROPE
  • NORTH AMERICA
    • MACROECONOMIC OUTLOOK FOR NORTH AMERICA
    • US
    • CANADA
    • MEXICO
  • REST OF THE WORLD
    • MACROECONOMIC OUTLOOK FOR ROW
    • BRAZIL
    • SOUTH AFRICA
    • TURKEY

Recent Developments

  • In April 2024, Walmart (US) collaborated with Swisslog Holding AG (Switzerland) to implement Swisslog’s storage automation technology at a facility in Texas alongside a state-of-the-art conveyor system. This collaboration aims to enhance operational efficiency and streamline logistics processes within the facility.
  • In January 2024, HAI Robotics (China) integrated its automated storage and retrieval systems with Honeywell International’s enterprise software, enhancing warehouse efficiency and automation. This collaboration leverages Honeywell’s robust software capabilities to optimize HAI’s intelligent robotic solutions, streamlining operations and reducing manual labor. The integration also includes advanced conveyor systems, ensuring seamless material handling and faster processing times.
  • In March 2024, Siemens AG (Germany) acquired the industrial drive technology business of ebm-papst (Germany) to strengthen its position in the industrial automation market. The acquisition includes a range of drive systems and components that complement Siemens’ existing portfolio, particularly enhancing its offerings in the field of efficient and innovative conveyor system solutions.

Frequently Asked Questions (FAQ):

To speak to our analyst for a discussion on the above findings, click Speak to Analyst

TABLE OF CONTENTS
 
1 INTRODUCTION (Page No. - 34)
    1.1 STUDY OBJECTIVES 
    1.2 MARKET DEFINITION 
           1.2.1 INCLUSIONS AND EXCLUSIONS
    1.3 STUDY SCOPE 
           1.3.1 MARKETS COVERED
           1.3.2 YEARS CONSIDERED
    1.4 CURRENCY CONSIDERED 
    1.5 UNIT CONSIDERED 
    1.6 STAKEHOLDERS 
    1.7 SUMMARY OF CHANGES 
 
2 RESEARCH METHODOLOGY (Page No. - 41)
    2.1 RESEARCH DATA 
           2.1.1 SECONDARY DATA
                    2.1.1.1 Secondary sources
                    2.1.1.2 Key data from secondary sources
           2.1.2 PRIMARY DATA
                    2.1.2.1 Primary interviewees
                    2.1.2.2 Breakdown of primary interviews
                    2.1.2.3 Sampling techniques and data collection methods
    2.2 MARKET SIZE ESTIMATION 
           2.2.1 BOTTOM-UP APPROACH
           2.2.2 TOP-DOWN APPROACH
    2.3 DATA TRIANGULATION 
    2.4 FACTOR ANALYSIS 
    2.5 RESEARCH ASSUMPTIONS 
           2.5.1 GLOBAL ASSUMPTIONS
           2.5.2 INDUSTRY ASSUMPTIONS
    2.6 RESEARCH LIMITATIONS 
    2.7 RISK ASSESSMENT 
 
3 EXECUTIVE SUMMARY (Page No. - 58)
 
4 PREMIUM INSIGHTS (Page No. - 62)
    4.1 ATTRACTIVE OPPORTUNITIES FOR PLAYERS IN CONVEYOR SYSTEM MARKET 
    4.2 CONVEYOR SYSTEM MARKET, BY TYPE 
    4.3 CONVEYOR SYSTEM MARKET, BY OPERATION 
    4.4 CONVEYOR SYSTEM MARKET, BY COMPONENT 
    4.5 CONVEYOR SYSTEM MARKET FOR RETAIL & DISTRIBUTION INDUSTRY, BY TYPE 
    4.6 CONVEYOR SYSTEM MARKET FOR ELECTRONICS INDUSTRY, BY TYPE 
    4.7 CONVEYOR SYSTEM MARKET FOR FOOD & BEVERAGE INDUSTRY, BY SUB-INDUSTRY 
    4.8 CONVEYOR SYSTEM MARKET FOR AUTOMOTIVE INDUSTRY, BY TYPE 
    4.9 CONVEYOR SYSTEM MARKET FOR AIRPORT INDUSTRY, BY TYPE 
    4.1 CONVEYOR SYSTEM MARKET FOR MINING INDUSTRY, BY TYPE 
    4.11 MINING CONVEYOR SYSTEM MARKET, BY APPLICATION 
    4.12 MINING CONVEYOR SYSTEM MARKET, BY TECHNOLOGY 
    4.13 CONVEYOR SYSTEM MARKET, BY REGION 
 
5 MARKET OVERVIEW (Page No. - 69)
    5.1 INTRODUCTION 
    5.2 MARKET DYNAMICS 
           5.2.1 DRIVERS
                    5.2.1.1 Growing adoption of automation
                    5.2.1.2 Extensive use of conveyor systems for mass production
                    5.2.1.3 Surge in mining of rare earth metals
                    5.2.1.4 High demand for conveyor systems from e-commerce industry
           5.2.2 RESTRAINTS
                    5.2.2.1 High installation and maintenance costs
                    5.2.2.2 Non-feasibility of automation in niche warehousing, automotive, and electronics applications
           5.2.3 OPPORTUNITIES
                    5.2.3.1 Integration of lean logistics principles
                    5.2.3.2 Innovations in conveyor systems
                    5.2.3.3 Rapid deployment of green conveyors to reduce emissions
           5.2.4 CHALLENGES
                    5.2.4.1 Significant presence of local players in emerging markets
                    5.2.4.2 Rising safety concerns due to system failures
    5.3 TRENDS AND DISRUPTIONS IMPACTING CUSTOMERS’ BUSINESSES 
    5.4 PRICING ANALYSIS 
           5.4.1 AVERAGE SELLING PRICE TREND, BY TYPE
           5.4.2 AVERAGE SELLING PRICE TREND, BY REGION
    5.5 ECOSYSTEM ANALYSIS 
    5.6 PATENT ANALYSIS 
    5.7 SUPPLY CHAIN ANALYSIS 
    5.8 IMPACT OF GENERATIVE AI 
    5.9 CASE STUDY ANALYSIS 
           5.9.1 DORNER SERIES BY DORNER MFG. CORP.
           5.9.2 BATTERY CELL INSPECTION LINE BY MK NORTH AMERICA
           5.9.3 SPEED RAIL FRICTION SYSTEM BY MTC & TSUBAKIMOTO MATERIAL HANDLING DIVISION, JAPAN
    5.1 INVESTMENT AND FUNDING SCENARIO 
    5.11 TECHNOLOGY ANALYSIS 
           5.11.1 KEY TECHNOLOGIES
                    5.11.1.1 Radiofrequency Identification
                    5.11.1.2 Proximity Sensors
           5.11.2 COMPLEMENTARY TECHNOLOGIES
                    5.11.2.1 Artificial Intelligence and Machine Learning
                    5.11.2.2 Augmented Reality
           5.11.3 ADJACENT TECHNOLOGIES
                    5.11.3.1 Internet of Things
                    5.11.3.2 Robotics and Automation
    5.12 TRADE ANALYSIS 
    5.13 REGULATORY LANDSCAPE 
           5.13.1 REGULATIONS PERTAINING TO CONVEYOR SYSTEMS
           5.13.2 REGULATORY BODIES, GOVERNMENT AGENCIES, AND OTHER ORGANIZATIONS
    5.14 KEY CONFERENCES AND EVENTS, 2024–2025 
    5.15 KEY STAKEHOLDERS AND BUYING CRITERIA 
           5.15.1 KEY STAKEHOLDERS IN BUYING PROCESS
           5.15.2 BUYING CRITERIA
 
6 CONVEYOR SYSTEM MARKET, BY TYPE (Page No. - 98)
    6.1 INTRODUCTION 
    6.2 BELT 
           6.2.1 EXTENSIVE USE IN DIVERSE INDUSTRIES TO DRIVE MARKET
    6.3 ROLLER 
           6.3.1 SURGE IN E-COMMERCE AND WAREHOUSE MATERIAL HANDLING TO DRIVE MARKET
    6.4 TRI-PLANAR 
           6.4.1 RAPID DEVELOPMENT OF AIRPORTS IN NORTH AMERICA TO DRIVE MARKET
    6.5 CRESCENT 
           6.5.1 SIGNIFICANT POTENTIAL FOR ADVANCEMENTS TO DRIVE MARKET
    6.6 PALLET 
           6.6.1 BOOMING E-COMMERCE INDUSTRY IN ASIA PACIFIC TO DRIVE MARKET
    6.7 OVERHEAD 
           6.7.1 IMPROVED PERFORMANCE WITH DEVELOPMENT OF LIGHTWEIGHT MATERIALS TO DRIVE MARKET
    6.8 FLOOR 
           6.8.1 RAPID INDUSTRIAL GROWTH IN ASIA PACIFIC TO DRIVE MARKET
    6.9 BUCKET 
           6.9.1 ADVANCEMENTS IN BUCKET DESIGNS AND MATERIALS TO DRIVE MARKET
    6.1 CABLE 
           6.10.1 LARGE-SCALE INFRASTRUCTURE AND MINING PROJECTS TO DRIVE MARKET
    6.11 OTHER TYPES 
    6.12 KEY PRIMARY INSIGHTS 
 
7 CONVEYOR SYSTEM MARKET, BY COMPONENT (Page No. - 118)
    7.1 INTRODUCTION 
    7.2 ALUMINUM PROFILE 
           7.2.1 RISING SETUP OF EV MANUFACTURING FACTORIES IN EUROPE TO DRIVE MARKET
    7.3 DRIVING UNIT 
           7.3.1 INNOVATIONS IN MODULAR DESIGN AND SMART FEATURES TO DRIVE MARKET
    7.4 EXTREMITY UNIT 
           7.4.1 NEED FOR ADVANCED CONVEYOR SYSTEMS IN WAREHOUSES AND DISTRIBUTION CENTERS TO DRIVE MARKET
    7.5 OTHER COMPONENTS 
    7.6 KEY PRIMARY INSIGHTS 
 
8 CONVEYOR SYSTEM MARKET, BY OPERATION (Page No. - 125)
    8.1 INTRODUCTION 
    8.2 MANUAL 
           8.2.1 EMERGING TREND OF AUTOMATION TO IMPEDE MARKET
    8.3 SEMI-AUTOMATIC 
           8.3.1 HIGHER ADOPTION IN PRICE-SENSITIVE ASIA PACIFIC COUNTRIES TO DRIVE MARKET
    8.4 AUTOMATIC 
           8.4.1 FOCUS ON INCREASING PRODUCTIVITY AND EFFICIENCY IN INDUSTRIES TO DRIVE MARKET
    8.5 KEY PRIMARY INSIGHTS 
 
9 CONVEYOR SYSTEM MARKET FOR AIRPORT INDUSTRY, BY TYPE (Page No. - 131)
    9.1 INTRODUCTION 
    9.2 BELT 
           9.2.1 INCREASING INFRASTRUCTURAL DEVELOPMENT OF AIRPORTS IN ASIA PACIFIC TO DRIVE MARKET
    9.3 CRESCENT 
           9.3.1 GLOBAL RISE IN PASSENGER FOOTFALL TO DRIVE MARKET
    9.4 TRI-PLANAR 
           9.4.1 HIGH DEMAND FROM NORTH AMERICAN REGION TO DRIVE MARKET
    9.5 OTHER TYPES 
    9.6 KEY PRIMARY INSIGHTS 
 
10 CONVEYOR SYSTEM MARKET FOR RETAIL & DISTRIBUTION INDUSTRY, BY TYPE (Page No. - 141)
     10.1 INTRODUCTION 
     10.2 BELT 
             10.2.1 GLOBAL EXPANSION OF DISTRIBUTION CENTERS TO DRIVE MARKET
     10.3 ROLLER 
             10.3.1 INCREASING SCOPE OF E-COMMERCE OPERATIONS TO DRIVE MARKET
     10.4 PALLET 
             10.4.1 RISING IMPLEMENTATION OF ROBOTICS IN WAREHOUSES TO DRIVE MARKET
     10.5 OTHER TYPES 
     10.6 KEY PRIMARY INSIGHTS 
 
11 CONVEYOR SYSTEM MARKET FOR MINING INDUSTRY, BY TYPE (Page No. - 152)
     11.1 INTRODUCTION 
     11.2 BELT 
             11.2.1 EXTENSIVE MINING ACTIVITIES IN RUSSIA AND OTHER EUROPEAN COUNTRIES TO DRIVE MARKET
     11.3 CABLE 
             11.3.1 DEVELOPMENT OF NEW CABLE MATERIALS AND DESIGNS TO DRIVE MARKET
     11.4 BUCKET 
             11.4.1 PRESENCE OF DEEP MINES IN SOUTH AFRICA TO DRIVE MARKET
     11.5 OTHER TYPES 
     11.6 KEY PRIMARY INSIGHTS 
 
12 MINING CONVEYOR SYSTEM MARKET, BY APPLICATION (Page No. - 161)
     12.1 INTRODUCTION 
     12.2 OPEN-PIT MINING 
             12.2.1 PROCESS AUTOMATION WITH CONVEYOR SYSTEMS TO DRIVE MARKET
     12.3 UNDERGROUND MINING 
             12.3.1 STRINGENT FIRE SAFETY REGULATIONS TO DRIVE MARKET
     12.4 KEY PRIMARY INSIGHTS 
 
13 MINING CONVEYOR SYSTEM MARKET, BY TECHNOLOGY (Page No. - 166)
     13.1 INTRODUCTION 
     13.2 DRIVE 
             13.2.1 RISING DEPLOYMENT IN NEW MINES TO DRIVE MARKET
     13.3 GEARLESS 
             13.3.1 FOCUS ON REDUCING ENERGY CONSUMPTION AND OPERATIONAL COSTS TO DRIVE MARKET
     13.4 AUTOMATED 
             13.4.1 INCREASING DEMAND FOR AUTOMATION FROM MINING COMPANIES TO DRIVE MARKET
     13.5 KEY PRIMARY INSIGHTS 
 
14 CONVEYOR SYSTEM MARKET FOR AUTOMOTIVE INDUSTRY, BY TYPE (Page No. - 172)
     14.1 INTRODUCTION 
     14.2 FLOOR 
             14.2.1 GROWING DEMAND FOR AUTOMATED PRODUCTION PROCESSES TO DRIVE MARKET
     14.3 OVERHEAD 
             14.3.1 EXTENSIVE USE IN HEAVY-LIFTING APPLICATIONS TO DRIVE MARKET
     14.4 ROLLER 
             14.4.1 ABILITY TO FACILITATE HIGH-SPEED PRODUCTION TO DRIVE MARKET
     14.5 OTHER TYPES 
     14.6 KEY PRIMARY INSIGHTS 
 
15 CONVEYOR SYSTEM MARKET FOR ELECTRONICS INDUSTRY, BY TYPE (Page No. - 183)
     15.1 INTRODUCTION 
     15.2 BELT 
             15.2.1 RISE OF ELECTRONICS MANUFACTURING FACTORIES IN ASIA PACIFIC TO DRIVE MARKET
     15.3 ROLLER 
             15.3.1 SURGE IN MANUFACTURING ACTIVITIES TO DRIVE MARKET
     15.4 OTHER TYPES 
     15.5 KEY PRIMARY INSIGHTS 
 
16 CONVEYOR SYSTEM MARKET FOR FOOD & BEVERAGE INDUSTRY, BY SUB-INDUSTRY (Page No. - 191)
     16.1 INTRODUCTION 
     16.2 MEAT & POULTRY 
             16.2.1 FOCUS ON INCREASING PRODUCTIVITY TO DRIVE MARKET
     16.3 DAIRY 
             16.3.1 REGULATORY NORMS FOR FOOD PROCESSING TO DRIVE MARKET
     16.4 OTHER SUB-INDUSTRIES 
     16.5 KEY PRIMARY INSIGHTS 
 
17 CONVEYOR SYSTEM MARKET, BY REGION (Page No. - 199)
     17.1 INTRODUCTION 
     17.2 ASIA PACIFIC 
             17.2.1 MACROECONOMIC INDICATORS
             17.2.2 CHINA
                       17.2.2.1 Need for efficient material handling systems to support increasing manufacturing activities to drive market
             17.2.3 INDIA
                       17.2.3.1 Emphasis on increasing industrial production capacity to drive market
             17.2.4 JAPAN
                       17.2.4.1 Shift toward automation to replenish aging workforce to drive market
             17.2.5 SOUTH KOREA
                       17.2.5.1 Strategic investments in advanced manufacturing and automation to drive market
             17.2.6 REST OF ASIA PACIFIC
     17.3 EUROPE 
             17.3.1 MACROECONOMIC INDICATORS
             17.3.2 GERMANY
                       17.3.2.1 Focus on Industry 4.0 and smart manufacturing systems to drive market
             17.3.3 FRANCE
                       17.3.3.1 Ongoing modernization of industrial infrastructure to drive market
             17.3.4 UK
                       17.3.4.1 Government inclination toward upgrade of existing airports to drive market
             17.3.5 SPAIN
                       17.3.5.1 Prevalence of multinational and domestic automotive manufacturing plants to drive market
             17.3.6 ITALY
                       17.3.6.1 Domestic demands and exports to drive market
             17.3.7 RUSSIA
                       17.3.7.1 Rising adoption of material handling systems in mining operations to drive market
             17.3.8 REST OF EUROPE
     17.4 NORTH AMERICA 
             17.4.1 MACROECONOMIC INDICATORS
             17.4.2 US
                       17.4.2.1 Significant presence of retail companies to drive market
             17.4.3 CANADA
                       17.4.3.1 Increasing scope of conveyor system applications to drive market
             17.4.4 MEXICO
                       17.4.4.1 Expansion of electronic manufacturing plants to drive market
     17.5 REST OF THE WORLD 
             17.5.1 MACROECONOMIC INDICATORS
             17.5.2 BRAZIL
                       17.5.2.1 Advancements in food processing techniques to drive market
             17.5.3 SOUTH AFRICA
                       17.5.3.1 Predominance of retail & distribution industry to drive market
             17.5.4 TURKEY
                       17.5.4.1 Rapid developments in consumer electronics to drive market
             17.5.5 OTHERS
 
18 COMPETITIVE LANDSCAPE (Page No. - 254)
     18.1 INTRODUCTION 
     18.2 KEY PLAYER STRATEGIES/RIGHT TO WIN, 2020–2024 
     18.3 MARKET SHARE ANALYSIS, 2023 
     18.4 REVENUE ANALYSIS, 2019–2023 
     18.5 COMPANY VALUATION AND FINANCIAL METRICS 
     18.6 BRAND/PRODUCT COMPARISON 
     18.7 COMPANY EVALUATION MATRIX: KEY PLAYERS, 2024 
             18.7.1 STARS
             18.7.2 EMERGING LEADERS
             18.7.3 PERVASIVE PLAYERS
             18.7.4 PARTICIPANTS
             18.7.5 COMPANY FOOTPRINT
                       18.7.5.1 Company footprint
                       18.7.5.2 Type footprint
                       18.7.5.3 Component footprint
                       18.7.5.4 Industry footprint
                       18.7.5.5 Operation footprint
                       18.7.5.6 Region footprint
     18.8 COMPANY EVALUATION MATRIX: START-UPS/SMES, 2024 
             18.8.1 PROGRESSIVE COMPANIES
             18.8.2 RESPONSIVE COMPANIES
             18.8.3 DYNAMIC COMPANIES
             18.8.4 STARTING BLOCKS
             18.8.5 COMPETITIVE BENCHMARKING
                       18.8.5.1 List of start-ups/SMEs
                       18.8.5.2 Competitive benchmarking of start-ups/SMEs
     18.9 COMPETITIVE SCENARIO 
             18.9.1 PRODUCT LAUNCHES/DEVELOPMENTS
             18.9.2 DEALS
             18.9.3 EXPANSIONS
             18.9.4 OTHERS
 
19 COMPANY PROFILES (Page No. - 275)
     19.1 KEY PLAYERS 
             19.1.1 SIEMENS AG
                       19.1.1.1 Business overview
                       19.1.1.2 Products/Solutions offered
                       19.1.1.3 Recent developments
                                   19.1.1.3.1 Product launches/developments
                                   19.1.1.3.2 Deals
                                   19.1.1.3.3 Expansions
                                   19.1.1.3.4 Others
                       19.1.1.4 MnM view
                                   19.1.1.4.1 Key strengths
                                   19.1.1.4.2 Strategic choices
                                   19.1.1.4.3 Weaknesses and competitive threats
             19.1.2 CONTINENTAL AG
                       19.1.2.1 Business overview
                       19.1.2.2 Products/Solutions offered
                       19.1.2.3 Recent developments
                                   19.1.2.3.1 Product launches/developments
                                   19.1.2.3.2 Deals
                                   19.1.2.3.3 Expansions
                                   19.1.2.3.4 Others
                       19.1.2.4 MnM view
                                   19.1.2.4.1 Key strengths
                                   19.1.2.4.2 Strategic choices
                                   19.1.2.4.3 Weaknesses and competitive threats
             19.1.3 DAIFUKU CO., LTD.
                       19.1.3.1 Business overview
                       19.1.3.2 Products/Solutions offered
                       19.1.3.3 Recent developments
                                   19.1.3.3.1 Product launches/developments
                                   19.1.3.3.2 Deals
                                   19.1.3.3.3 Others
                       19.1.3.4 MnM view
                                   19.1.3.4.1 Key strengths
                                   19.1.3.4.2 Strategic choices
                                   19.1.3.4.3 Weaknesses and competitive threats
             19.1.4 FIVES GROUP
                       19.1.4.1 Business overview
                       19.1.4.2 Products/Solutions offered
                       19.1.4.3 Recent developments
                                   19.1.4.3.1 Product launches/developments
                                   19.1.4.3.2 Deals
                                   19.1.4.3.3 Expansions
                                   19.1.4.3.4 Others
                       19.1.4.4 MnM view
                                   19.1.4.4.1 Key strengths
                                   19.1.4.4.2 Strategic choices
                                   19.1.4.4.3 Weaknesses and competitive threats
             19.1.5 SWISSLOG HOLDING AG
                       19.1.5.1 Business overview
                       19.1.5.2 Products/Solutions offered
                       19.1.5.3 Recent developments
                                   19.1.5.3.1 Deals
                                   19.1.5.3.2 Expansions
                                   19.1.5.3.3 Others
                       19.1.5.4 MnM view
                                   19.1.5.4.1 Key strengths
                                   19.1.5.4.2 Strategic choices
                                   19.1.5.4.3 Weaknesses and competitive threats
             19.1.6 TAIKISHA LTD
                       19.1.6.1 Business overview
                       19.1.6.2 Products/Solutions offered
                       19.1.6.3 Recent developments
                                   19.1.6.3.1 Expansions
             19.1.7 HONEYWELL INTERNATIONAL INC.
                       19.1.7.1 Business overview
                       19.1.7.2 Products/Solutions offered
                       19.1.7.3 Recent developments
                                   19.1.7.3.1 Product launches/developments
                                   19.1.7.3.2 Deals
                                   19.1.7.3.3 Expansions
             19.1.8 INTERROLL GROUP
                       19.1.8.1 Business overview
                       19.1.8.2 Products/Solutions offered
                       19.1.8.3 Recent developments
                                   19.1.8.3.1 Product launches/developments
                                   19.1.8.3.2 Deals
                                   19.1.8.3.3 Expansions
                                   19.1.8.3.4 Others
             19.1.9 METSO OUTOTEC
                       19.1.9.1 Business overview
                       19.1.9.2 Products/Solutions offered
                       19.1.9.3 Recent developments
                                   19.1.9.3.1 Product launches/developments
                                   19.1.9.3.2 Deals
                                   19.1.9.3.3 Expansions
                                   19.1.9.3.4 Others
               19.1.10 MURATA MACHINERY, LTD.
            19.1.10.1 Business overview
            19.1.10.2 Products/Solutions offered
            19.1.10.3 Recent developments
                     19.1.10.3.1 Product launches/developments
                     19.1.10.3.2 Deals
               19.1.11 DURR GROUP
            19.1.11.1 Business overview
            19.1.11.2 Products/Solutions offered
            19.1.11.3 Recent developments
                     19.1.11.3.1 Deals
                     19.1.11.3.2 Others
               19.1.12 BOSCH REXROTH KFT.
            19.1.12.1 Business overview
            19.1.12.2 Products/Solutions offered
            19.1.12.3 Recent developments
                     19.1.12.3.1 Product launches/developments
                     19.1.12.3.2 Deals
                     19.1.12.3.3 Expansions
     19.2 OTHER PLAYERS 
             19.2.1 KNAPP AG
             19.2.2 VANDERLANDE INDUSTRIES B.V.
             19.2.3 SEMPERIT AG HOLDING
             19.2.4 BEUMER GROUP
             19.2.5 KARDEX
             19.2.6 DEMATIC
             19.2.7 SSI SCHAEFER
             19.2.8 BASTIAN SOLUTIONS, LLC
             19.2.9 INVATA INTRALOGISTICS
               19.2.10 WESTFALIA TECHNOLOGIES, INC.
               19.2.11 MHS GLOBAL
               19.2.12 DMW&H
               19.2.13 OMNIA DELLA TOFFOLA SPA
               19.2.14 FLEXLINK
               19.2.15 FLEXICON CORPORATION
               19.2.16 MECALUX, S.A.
 
20 RECOMMENDATIONS BY MARKETSANDMARKETS (Page No. - 345)
     20.1 ASIA PACIFIC TO BE DOMINANT MARKET FOR CONVEYOR SYSTEMS 
     20.2 DEVELOPMENT OF NEW BUSINESS MODELS BY OEMS TO MONETIZE DATA GENERATED BY AUTOMATED CONVEYOR SYSTEMS 
     20.3 PREVALENCE OF OVERHEAD CONVEYORS IN E-COMMERCE AND AUTOMOTIVE INDUSTRIES 
     20.4 CONCLUSION 
 
21 APPENDIX (Page No. - 347)
     21.1 INSIGHTS FROM INDUSTRY EXPERTS 
     21.2 DISCUSSION GUIDE 
     21.3 KNOWLEDGESTORE: MARKETSANDMARKETS’ SUBSCRIPTION PORTAL 
     21.4 CUSTOMIZATION OPTIONS 
             21.4.1 RETAIL INDUSTRY CONVEYOR SYSTEM MARKET, BY TYPE (AT COUNTRY LEVEL)
                       21.4.1.1 Belt
                       21.4.1.2 Roller
                       21.4.1.3 Pallet
             21.4.2 COMPANY PROFILES
                       21.4.2.1 Additional company profiles (up to five)
     21.5 RELATED REPORTS 
     21.6 AUTHOR DETAILS 
 
 
LIST OF TABLES (405 Tables)
 
TABLE 1 CONVEYOR SYSTEM MARKET DEFINITION, BY TYPE
TABLE 2 CONVEYOR SYSTEM MARKET DEFINITION, BY COMPONENT
TABLE 3 MINING CONVEYOR SYSTEM MARKET DEFINITION, BY APPLICATION
TABLE 4 MINING CONVEYOR SYSTEM MARKET DEFINITION, BY TECHNOLOGY
TABLE 5 INCLUSIONS AND EXCLUSIONS
TABLE 6 USD EXCHANGE RATES, 2019–2023
TABLE 7 ASSUMPTIONS FOR FOOD & BEVERAGE INDUSTRY
TABLE 8 ASSUMPTIONS FOR AUTOMOTIVE INDUSTRY
TABLE 9 ASSUMPTIONS FOR RETAIL & DISTRIBUTION INDUSTRY
TABLE 10 ASSUMPTIONS FOR AIRPORT INDUSTRY
TABLE 11 ASSUMPTIONS FOR ELECTRONICS INDUSTRY
TABLE 12 ASSUMPTIONS FOR MINING INDUSTRY
TABLE 13 RISK ASSESSMENT
TABLE 14 ADOPTION OF AUTOMATION, BY INDUSTRY, 2023 VS. 2030
TABLE 15 USE OF CONVEYOR SYSTEMS, BY E-COMMERCE COMPANY
TABLE 16 USE OF GREEN CONVEYOR SYSTEMS, BY INDUSTRY
TABLE 17 IMPACT ANALYSIS OF MARKET DYNAMICS
TABLE 18 AVERAGE SELLING PRICE OF CONVEYOR SYSTEMS, BY TYPE, 2021–2023 (USD)
TABLE 19 AVERAGE SELLING PRICE OF CONVEYOR SYSTEMS, BY REGION, 2021–2023 (USD)
TABLE 20 ROLE OF COMPANIES IN ECOSYSTEM
TABLE 21 PATENT ANALYSIS
TABLE 22 LIST OF FUNDINGS, 2022–2024
TABLE 23 REGULATIONS PERTAINING TO CONVEYOR SYSTEMS
TABLE 24 NORTH AMERICA: REGULATORY BODIES, GOVERNMENT AGENCIES, AND OTHER ORGANIZATIONS
TABLE 25 EUROPE: REGULATORY BODIES, GOVERNMENT AGENCIES, AND OTHER ORGANIZATIONS
TABLE 26 ASIA PACIFIC: REGULATORY BODIES, GOVERNMENT AGENCIES, AND OTHER ORGANIZATIONS
TABLE 27 CONFERENCES AND EVENTS, 2024–2025
TABLE 28 INFLUENCE OF STAKEHOLDERS ON BUYING PROCESS, BY INDUSTRY (%)
TABLE 29 KEY BUYING CRITERIA, BY INDUSTRY
TABLE 30 CONVEYOR SYSTEM MARKET, BY TYPE, 2019–2023 (THOUSAND METERS)
TABLE 31 CONVEYOR SYSTEM MARKET, BY TYPE, 2024–2030 (THOUSAND METERS)
TABLE 32 CONVEYOR SYSTEM MARKET, BY TYPE, 2019–2023 (USD MILLION)
TABLE 33 CONVEYOR SYSTEM MARKET, BY TYPE, 2024–2030 (USD MILLION)
TABLE 34 BELT: CONVEYOR SYSTEM MARKET, BY REGION, 2019–2023 (THOUSAND METERS)
TABLE 35 BELT: CONVEYOR SYSTEM MARKET, BY REGION, 2024–2030 (THOUSAND METERS)
TABLE 36 BELT: CONVEYOR SYSTEM MARKET, BY REGION, 2019–2023 (USD MILLION)
TABLE 37 BELT: CONVEYOR SYSTEM MARKET, BY REGION, 2024–2030 (USD MILLION)
TABLE 38 ROLLER: CONVEYOR SYSTEM MARKET, BY REGION, 2019–2023 (THOUSAND METERS)
TABLE 39 ROLLER: CONVEYOR SYSTEM MARKET, BY REGION, 2024–2030 (THOUSAND METERS)
TABLE 40 ROLLER: CONVEYOR SYSTEM MARKET, BY REGION, 2019–2023 (USD MILLION)
TABLE 41 ROLLER: CONVEYOR SYSTEM MARKET, BY REGION, 2024–2030 (USD MILLION)
TABLE 42 TRI-PLANAR: CONVEYOR SYSTEM MARKET, BY REGION, 2019–2023 (THOUSAND METERS)
TABLE 43 TRI-PLANAR: CONVEYOR SYSTEM MARKET, BY REGION, 2024–2030 (THOUSAND METERS)
TABLE 44 TRI-PLANAR: CONVEYOR SYSTEM MARKET, BY REGION, 2019–2023 (USD MILLION)
TABLE 45 TRI-PLANAR: CONVEYOR SYSTEM MARKET, BY REGION, 2024–2030 (USD MILLION)
TABLE 46 CRESCENT: CONVEYOR SYSTEM MARKET, BY REGION, 2019–2023 (THOUSAND METERS)
TABLE 47 CRESCENT: CONVEYOR SYSTEM MARKET, BY REGION, 2024–2030 (THOUSAND METERS)
TABLE 48 CRESCENT: CONVEYOR SYSTEM MARKET, BY REGION, 2019–2023 (USD MILLION)
TABLE 49 CRESCENT: CONVEYOR SYSTEM MARKET, BY REGION, 2024–2030 (USD MILLION)
TABLE 50 PALLET: CONVEYOR SYSTEM MARKET, BY REGION, 2019–2023 (THOUSAND METERS)
TABLE 51 PALLET: CONVEYOR SYSTEM MARKET, BY REGION, 2024–2030 (THOUSAND METERS)
TABLE 52 PALLET: CONVEYOR SYSTEM MARKET, BY REGION, 2019–2023 (USD MILLION)
TABLE 53 PALLET: CONVEYOR SYSTEM MARKET, BY REGION, 2024–2030 (USD MILLION)
TABLE 54 OVERHEAD: CONVEYOR SYSTEM MARKET, BY REGION, 2019–2023 (THOUSAND METERS)
TABLE 55 OVERHEAD: CONVEYOR SYSTEM MARKET, BY REGION, 2024–2030 (THOUSAND METERS)
TABLE 56 OVERHEAD: CONVEYOR SYSTEM MARKET, BY REGION, 2019–2023 (USD MILLION)
TABLE 57 OVERHEAD: CONVEYOR SYSTEM MARKET, BY REGION, 2024–2030 (USD MILLION)
TABLE 58 FLOOR: CONVEYOR SYSTEM MARKET, BY REGION, 2019–2023 (THOUSAND METERS)
TABLE 59 FLOOR: CONVEYOR SYSTEM MARKET, BY REGION, 2024–2030 (THOUSAND METERS)
TABLE 60 FLOOR: CONVEYOR SYSTEM MARKET, BY REGION, 2019–2023 (USD MILLION)
TABLE 61 FLOOR: CONVEYOR SYSTEM MARKET, BY REGION, 2024–2030 (USD MILLION)
TABLE 62 BUCKET: CONVEYOR SYSTEM MARKET, BY REGION, 2019–2023 (THOUSAND METERS)
TABLE 63 BUCKET: CONVEYOR SYSTEM MARKET, BY REGION, 2024–2030 (THOUSAND METERS)
TABLE 64 BUCKET: CONVEYOR SYSTEM MARKET, BY REGION, 2019–2023 (USD MILLION)
TABLE 65 BUCKET: CONVEYOR SYSTEM MARKET, BY REGION, 2024–2030 (USD MILLION)
TABLE 66 CABLE: CONVEYOR SYSTEM MARKET, BY REGION, 2019–2023 (THOUSAND METERS)
TABLE 67 CABLE: CONVEYOR SYSTEM MARKET, BY REGION, 2024–2030 (THOUSAND METERS)
TABLE 68 CABLE: CONVEYOR SYSTEM MARKET, BY REGION, 2019–2023 (USD MILLION)
TABLE 69 CABLE: CONVEYOR SYSTEM MARKET, BY REGION, 2024–2030 (USD MILLION)
TABLE 70 OTHER TYPES: CONVEYOR SYSTEM MARKET, BY REGION, 2019–2023 (THOUSAND METERS)
TABLE 71 OTHER TYPES: CONVEYOR SYSTEM MARKET, BY REGION, 2024–2030 (THOUSAND METERS)
TABLE 72 OTHER TYPES: CONVEYOR SYSTEM MARKET, BY REGION, 2019–2023 (USD MILLION)
TABLE 73 OTHER TYPES: CONVEYOR SYSTEM MARKET, BY REGION, 2024–2030 (USD MILLION)
TABLE 74 CONVEYOR SYSTEM MARKET, BY COMPONENT, 2019–2023 (USD MILLION)
TABLE 75 CONVEYOR SYSTEM MARKET, BY COMPONENT, 2024–2030 (USD MILLION)
TABLE 76 ALUMINUM PROFILE: CONVEYOR SYSTEM MARKET, BY REGION, 2019–2023 (USD MILLION)
TABLE 77 ALUMINUM PROFILE: CONVEYOR SYSTEM MARKET, BY REGION, 2024–2030 (USD MILLION)
TABLE 78 DRIVING UNIT: CONVEYOR SYSTEM MARKET, BY REGION, 2019–2023 (USD MILLION)
TABLE 79 DRIVING UNIT: CONVEYOR SYSTEM MARKET, BY REGION, 2024–2030 (USD MILLION)
TABLE 80 EXTREMITY UNIT: CONVEYOR SYSTEM MARKET, BY REGION, 2019–2023 (USD MILLION)
TABLE 81 EXTREMITY UNIT: CONVEYOR SYSTEM MARKET, BY REGION, 2024–2030 (USD MILLION)
TABLE 82 OTHER COMPONENTS: CONVEYOR SYSTEM MARKET, BY REGION, 2019–2023 (USD MILLION)
TABLE 83 OTHER COMPONENTS: CONVEYOR SYSTEM MARKET, BY REGION, 2024–2030 (USD MILLION)
TABLE 84 CONVEYOR SYSTEM MARKET, BY OPERATION, 2019–2023 (USD MILLION)
TABLE 85 CONVEYOR SYSTEM MARKET, BY OPERATION, 2024–2030 (USD MILLION)
TABLE 86 MANUAL: CONVEYOR SYSTEM MARKET, BY REGION, 2019–2023 (USD MILLION)
TABLE 87 MANUAL: CONVEYOR SYSTEM MARKET, BY REGION, 2024–2030 (USD MILLION)
TABLE 88 SEMI-AUTOMATIC: CONVEYOR SYSTEM MARKET, BY REGION, 2019–2023 (USD MILLION)
TABLE 89 SEMI-AUTOMATIC: CONVEYOR SYSTEM MARKET, BY REGION, 2024–2030 (USD MILLION)
TABLE 90 AUTOMATIC: CONVEYOR SYSTEM MARKET, BY REGION, 2019–2023 (USD MILLION)
TABLE 91 AUTOMATIC: CONVEYOR SYSTEM MARKET, BY REGION, 2024–2030 (USD MILLION)
TABLE 92 CONVEYOR SYSTEM MARKET FOR AIRPORT INDUSTRY, BY TYPE, 2019–2023 (THOUSAND METERS)
TABLE 93 CONVEYOR SYSTEM MARKET FOR AIRPORT INDUSTRY, BY TYPE, 2024–2030 (THOUSAND METERS)
TABLE 94 CONVEYOR SYSTEM MARKET FOR AIRPORT INDUSTRY, BY TYPE, 2019–2023 (USD MILLION)
TABLE 95 CONVEYOR SYSTEM MARKET FOR AIRPORT INDUSTRY, BY TYPE, 2024–2030 (USD MILLION)
TABLE 96 BELT: CONVEYOR SYSTEM MARKET FOR AIRPORT INDUSTRY, BY REGION, 2019–2023 (THOUSAND METERS)
TABLE 97 BELT: CONVEYOR SYSTEM MARKET FOR AIRPORT INDUSTRY, BY REGION, 2024–2030 (THOUSAND METERS)
TABLE 98 BELT: CONVEYOR SYSTEM MARKET FOR AIRPORT INDUSTRY, BY REGION, 2019–2023 (USD MILLION)
TABLE 99 BELT: CONVEYOR SYSTEM MARKET FOR AIRPORT INDUSTRY, BY REGION, 2024–2030 (USD MILLION)
TABLE 100 CRESCENT: CONVEYOR SYSTEM MARKET FOR AIRPORT INDUSTRY, BY REGION, 2019–2023 (THOUSAND METERS)
TABLE 101 CRESCENT: CONVEYOR SYSTEM MARKET FOR AIRPORT INDUSTRY, BY REGION, 2024–2030 (THOUSAND METERS)
TABLE 102 CRESCENT: CONVEYOR SYSTEM MARKET FOR AIRPORT INDUSTRY, BY REGION, 2019–2023 (USD MILLION)
TABLE 103 CRESCENT: CONVEYOR SYSTEM MARKET FOR AIRPORT INDUSTRY, BY REGION, 2024–2030 (USD MILLION)
TABLE 104 TRI-PLANAR: CONVEYOR SYSTEM MARKET FOR AIRPORT INDUSTRY, BY REGION, 2019–2023 (THOUSAND METERS)
TABLE 105 TRI-PLANAR: CONVEYOR SYSTEM MARKET FOR AIRPORT INDUSTRY, BY REGION, 2024–2030 (THOUSAND METERS)
TABLE 106 TRI-PLANAR: CONVEYOR SYSTEM MARKET FOR AIRPORT INDUSTRY, BY REGION, 2019–2023 (USD MILLION)
TABLE 107 TRI-PLANAR: CONVEYOR SYSTEM MARKET FOR AIRPORT INDUSTRY, BY REGION, 2024–2030 (USD MILLION)
TABLE 108 OTHER TYPES: CONVEYOR SYSTEM MARKET FOR AIRPORT INDUSTRY, BY REGION, 2019–2023 (THOUSAND METERS)
TABLE 109 OTHER TYPES: CONVEYOR SYSTEM MARKET FOR AIRPORT INDUSTRY, BY REGION, 2024–2030 (THOUSAND METERS)
TABLE 110 OTHER TYPES: CONVEYOR SYSTEM MARKET FOR AIRPORT INDUSTRY, BY REGION, 2019–2023 (USD MILLION)
TABLE 111 OTHER TYPES: CONVEYOR SYSTEM MARKET FOR AIRPORT INDUSTRY, BY REGION, 2024–2030 (USD MILLION)
TABLE 112 CONVEYOR SYSTEM MARKET FOR RETAIL & DISTRIBUTION INDUSTRY, BY TYPE, 2019–2023 (THOUSAND METERS)
TABLE 113 CONVEYOR SYSTEM MARKET FOR RETAIL & DISTRIBUTION INDUSTRY, BY TYPE, 2024–2030 (THOUSAND METERS)
TABLE 114 CONVEYOR SYSTEM MARKET FOR RETAIL & DISTRIBUTION INDUSTRY, BY TYPE, 2019–2023 (USD MILLION)
TABLE 115 CONVEYOR SYSTEM MARKET FOR RETAIL & DISTRIBUTION INDUSTRY, BY TYPE, 2024–2030 (USD MILLION)
TABLE 116 BELT: CONVEYOR SYSTEM MARKET FOR RETAIL & DISTRIBUTION INDUSTRY, BY REGION, 2019–2023 (THOUSAND METERS)
TABLE 117 BELT: CONVEYOR SYSTEM MARKET FOR RETAIL & DISTRIBUTION INDUSTRY, BY REGION, 2024–2030 (THOUSAND METERS)
TABLE 118 BELT: CONVEYOR SYSTEM MARKET FOR RETAIL & DISTRIBUTION INDUSTRY, BY REGION, 2019–2023 (USD MILLION)
TABLE 119 BELT: CONVEYOR SYSTEM MARKET FOR RETAIL & DISTRIBUTION INDUSTRY, BY REGION, 2024–2030 (USD MILLION)
TABLE 120 ROLLER: CONVEYOR SYSTEM MARKET FOR RETAIL & DISTRIBUTION INDUSTRY, BY REGION, 2019–2023 (THOUSAND METERS)
TABLE 121 ROLLER: CONVEYOR SYSTEM MARKET FOR RETAIL & DISTRIBUTION INDUSTRY, BY REGION, 2024–2030 (THOUSAND METERS)
TABLE 122 ROLLER: CONVEYOR SYSTEM MARKET FOR RETAIL & DISTRIBUTION INDUSTRY, BY REGION, 2019–2023 (USD MILLION)
TABLE 123 ROLLER: CONVEYOR SYSTEM MARKET FOR RETAIL & DISTRIBUTION INDUSTRY, BY REGION, 2024–2030 (USD MILLION)
TABLE 124 PALLET: CONVEYOR SYSTEM MARKET FOR RETAIL & DISTRIBUTION INDUSTRY, BY REGION, 2019–2023 (THOUSAND METERS)
TABLE 125 PALLET: CONVEYOR SYSTEM MARKET FOR RETAIL & DISTRIBUTION INDUSTRY, BY REGION, 2024–2030 (THOUSAND METERS)
TABLE 126 PALLET: CONVEYOR SYSTEM MARKET FOR RETAIL & DISTRIBUTION INDUSTRY, BY REGION, 2019–2023 (USD MILLION)
TABLE 127 PALLET: CONVEYOR SYSTEM MARKET FOR RETAIL & DISTRIBUTION INDUSTRY, BY REGION, 2024–2030 (USD MILLION)
TABLE 128 OTHER TYPES: CONVEYOR SYSTEM MARKET FOR RETAIL & DISTRIBUTION INDUSTRY, BY REGION, 2019–2023 (THOUSAND METERS)
TABLE 129 OTHER TYPES: CONVEYOR SYSTEM MARKET FOR RETAIL & DISTRIBUTION INDUSTRY, BY REGION, 2024–2030 (THOUSAND METERS)
TABLE 130 OTHER TYPES: CONVEYOR SYSTEM MARKET FOR RETAIL & DISTRIBUTION INDUSTRY, BY REGION, 2019–2023 (USD MILLION)
TABLE 131 OTHER TYPES: CONVEYOR SYSTEM MARKET FOR RETAIL & DISTRIBUTION INDUSTRY, BY REGION, 2024–2030 (USD MILLION)
TABLE 132 CONVEYOR SYSTEM MARKET FOR MINING INDUSTRY, BY TYPE, 2019–2023 (THOUSAND METERS)
TABLE 133 CONVEYOR SYSTEM MARKET FOR MINING INDUSTRY, BY TYPE, 2024–2030 (THOUSAND METERS)
TABLE 134 CONVEYOR SYSTEM MARKET FOR MINING INDUSTRY, BY TYPE, 2019–2023 (USD MILLION)
TABLE 135 CONVEYOR SYSTEM MARKET FOR MINING INDUSTRY, BY TYPE, 2024–2030 (USD MILLION)
TABLE 136 BELT: CONVEYOR SYSTEM MARKET FOR MINING INDUSTRY, BY REGION, 2019–2023 (THOUSAND METERS)
TABLE 137 BELT: CONVEYOR SYSTEM MARKET FOR MINING INDUSTRY, BY REGION, 2024–2030 (THOUSAND METERS)
TABLE 138 BELT: CONVEYOR SYSTEM MARKET FOR MINING INDUSTRY, BY REGION, 2019–2023 (USD MILLION)
TABLE 139 BELT: CONVEYOR SYSTEM MARKET FOR MINING INDUSTRY, BY REGION, 2024–2030 (USD MILLION)
TABLE 140 CABLE: CONVEYOR SYSTEM MARKET FOR MINING INDUSTRY, BY REGION, 2019–2023 (THOUSAND METERS)
TABLE 141 CABLE: CONVEYOR SYSTEM MARKET FOR MINING INDUSTRY, BY REGION, 2024–2030 (THOUSAND METERS)
TABLE 142 CABLE: CONVEYOR SYSTEM MARKET FOR MINING INDUSTRY, BY REGION, 2019–2023 (USD MILLION)
TABLE 143 CABLE: CONVEYOR SYSTEM MARKET FOR MINING INDUSTRY, BY REGION, 2024–2030 (USD MILLION)
TABLE 144 BUCKET: CONVEYOR SYSTEM MARKET FOR MINING INDUSTRY, BY REGION, 2019–2023 (THOUSAND METERS)
TABLE 145 BUCKET: CONVEYOR SYSTEM MARKET FOR MINING INDUSTRY, BY REGION, 2024–2030 (THOUSAND METERS)
TABLE 146 BUCKET: CONVEYOR SYSTEM MARKET FOR MINING INDUSTRY, BY REGION, 2019–2023 (USD MILLION)
TABLE 147 BUCKET: CONVEYOR SYSTEM MARKET FOR MINING INDUSTRY, BY REGION, 2024–2030 (USD MILLION)
TABLE 148 OTHER TYPES: CONVEYOR SYSTEM MARKET FOR MINING INDUSTRY, BY REGION, 2019–2023 (THOUSAND METERS)
TABLE 149 OTHER TYPES: CONVEYOR SYSTEM MARKET FOR MINING INDUSTRY, BY REGION, 2024–2030 (THOUSAND METERS)
TABLE 150 OTHER TYPES: CONVEYOR SYSTEM MARKET FOR MINING INDUSTRY, BY REGION, 2019–2023 (USD MILLION)
TABLE 151 OTHER TYPES: CONVEYOR SYSTEM MARKET FOR MINING INDUSTRY, BY REGION, 2024–2030 (USD MILLION)
TABLE 152 MINING CONVEYOR SYSTEM MARKET, BY APPLICATION, 2019–2023 (USD MILLION)
TABLE 153 MINING CONVEYOR SYSTEM MARKET, BY APPLICATION, 2024–2030 (USD MILLION)
TABLE 154 NUMBER OF OPEN-PIT MINES GLOBALLY, 2024
TABLE 155 OPEN-PIT MINING CONVEYOR SYSTEM MARKET, BY REGION, 2019–2023 (USD MILLION)
TABLE 156 OPEN-PIT MINING CONVEYOR SYSTEM MARKET, BY REGION, 2024–2030 (USD MILLION)
TABLE 157 NUMBER OF UNDERGROUND MINES GLOBALLY, 2024
TABLE 158 UNDERGROUND MINING CONVEYOR SYSTEM MARKET, BY REGION, 2019–2023 (USD MILLION)
TABLE 159 UNDERGROUND MINING CONVEYOR SYSTEM MARKET, BY REGION, 2024–2030 (USD MILLION)
TABLE 160 MINING CONVEYOR SYSTEM MARKET, BY TECHNOLOGY, 2019–2023 (USD MILLION)
TABLE 161 MINING CONVEYOR SYSTEM MARKET, BY TECHNOLOGY, 2024–2030 (USD MILLION)
TABLE 162 DRIVE MINING CONVEYOR SYSTEM MARKET, BY REGION, 2019–2023 (USD MILLION)
TABLE 163 DRIVE MINING CONVEYOR SYSTEM MARKET, BY REGION, 2024–2030 (USD MILLION)
TABLE 164 GEARLESS MINING CONVEYOR SYSTEM MARKET, BY REGION, 2019–2023 (USD MILLION)
TABLE 165 GEARLESS MINING CONVEYOR SYSTEM MARKET, BY REGION, 2024–2030 (USD MILLION)
TABLE 166 AUTOMATED MINING CONVEYOR SYSTEM MARKET, BY REGION, 2019–2023 (USD MILLION)
TABLE 167 AUTOMATED MINING CONVEYOR SYSTEM MARKET, BY REGION, 2024–2030 (USD MILLION)
TABLE 168 CONVEYOR SYSTEM MARKET FOR AUTOMOTIVE INDUSTRY, BY TYPE, 2019–2023 (THOUSAND METERS)
TABLE 169 CONVEYOR SYSTEM MARKET FOR AUTOMOTIVE INDUSTRY, BY TYPE, 2024–2030 (THOUSAND METERS)
TABLE 170 CONVEYOR SYSTEM MARKET FOR AUTOMOTIVE INDUSTRY, BY TYPE, 2019–2023 (USD MILLION)
TABLE 171 CONVEYOR SYSTEM MARKET FOR AUTOMOTIVE INDUSTRY, BY TYPE, 2024–2030 (USD MILLION)
TABLE 172 FLOOR: CONVEYOR SYSTEM MARKET FOR AUTOMOTIVE INDUSTRY, BY REGION, 2019–2023 (THOUSAND METERS)
TABLE 173 FLOOR: CONVEYOR SYSTEM MARKET FOR AUTOMOTIVE INDUSTRY, BY REGION, 2024–2030 (THOUSAND METERS)
TABLE 174 FLOOR: CONVEYOR SYSTEM MARKET FOR AUTOMOTIVE INDUSTRY, BY REGION, 2019–2023 (USD MILLION)
TABLE 175 FLOOR: CONVEYOR SYSTEM MARKET FOR AUTOMOTIVE INDUSTRY, BY REGION, 2024–2030 (USD MILLION)
TABLE 176 OVERHEAD: CONVEYOR SYSTEM MARKET FOR AUTOMOTIVE INDUSTRY, BY REGION, 2019–2023 (THOUSAND METERS)
TABLE 177 OVERHEAD: CONVEYOR SYSTEM MARKET FOR AUTOMOTIVE INDUSTRY, BY REGION, 2024–2030 (THOUSAND METERS)
TABLE 178 OVERHEAD: CONVEYOR SYSTEM MARKET FOR AUTOMOTIVE INDUSTRY, BY REGION, 2019–2023 (USD MILLION)
TABLE 179 OVERHEAD: CONVEYOR SYSTEM MARKET FOR AUTOMOTIVE INDUSTRY, BY REGION, 2024–2030 (USD MILLION)
TABLE 180 ROLLER: CONVEYOR SYSTEM MARKET FOR AUTOMOTIVE INDUSTRY, BY REGION, 2019–2023 (THOUSAND METERS)
TABLE 181 ROLLER: CONVEYOR SYSTEM MARKET FOR AUTOMOTIVE INDUSTRY, BY REGION, 2024–2030 (THOUSAND METERS)
TABLE 182 ROLLER: CONVEYOR SYSTEM MARKET FOR AUTOMOTIVE INDUSTRY, BY REGION, 2019–2023 (USD MILLION)
TABLE 183 ROLLER: CONVEYOR SYSTEM MARKET FOR AUTOMOTIVE INDUSTRY, BY REGION, 2024–2030 (USD MILLION)
TABLE 184 OTHER TYPES: CONVEYOR SYSTEM MARKET FOR AUTOMOTIVE INDUSTRY, BY REGION, 2019–2023 (THOUSAND METERS)
TABLE 185 OTHER TYPES: CONVEYOR SYSTEM MARKET FOR AUTOMOTIVE INDUSTRY, BY REGION, 2024–2030 (THOUSAND METERS)
TABLE 186 OTHER TYPES: CONVEYOR SYSTEM MARKET FOR AUTOMOTIVE INDUSTRY, BY REGION, 2019–2023 (USD MILLION)
TABLE 187 OTHER TYPES: CONVEYOR SYSTEM MARKET FOR AUTOMOTIVE INDUSTRY, BY REGION, 2024–2030 (USD MILLION)
TABLE 188 CONVEYOR SYSTEM MARKET FOR ELECTRONICS INDUSTRY, BY TYPE, 2019–2023 (THOUSAND METERS)
TABLE 189 CONVEYOR SYSTEM MARKET FOR ELECTRONICS INDUSTRY, BY TYPE, 2024–2030 (THOUSAND METERS)
TABLE 190 CONVEYOR SYSTEM MARKET FOR ELECTRONICS INDUSTRY, BY TYPE, 2019–2023 (USD MILLION)
TABLE 191 CONVEYOR SYSTEM MARKET FOR ELECTRONICS INDUSTRY, BY TYPE, 2024–2030 (USD MILLION)
TABLE 192 BELT: CONVEYOR SYSTEM MARKET FOR ELECTRONICS INDUSTRY, BY REGION, 2019–2023 (THOUSAND METERS)
TABLE 193 BELT: CONVEYOR SYSTEM MARKET FOR ELECTRONICS INDUSTRY, BY REGION, 2024–2030 (THOUSAND METERS)
TABLE 194 BELT: CONVEYOR SYSTEM MARKET FOR ELECTRONICS INDUSTRY, BY REGION, 2019–2023 (USD MILLION)
TABLE 195 BELT: CONVEYOR SYSTEM MARKET FOR ELECTRONICS INDUSTRY, BY REGION, 2024–2030 (USD MILLION)
TABLE 196 ROLLER: CONVEYOR SYSTEM MARKET FOR ELECTRONICS INDUSTRY, BY REGION, 2019–2023 (THOUSAND METERS)
TABLE 197 ROLLER: CONVEYOR SYSTEM MARKET FOR ELECTRONICS INDUSTRY, BY REGION, 2024–2030 (THOUSAND METERS)
TABLE 198 ROLLER: CONVEYOR SYSTEM MARKET FOR ELECTRONICS INDUSTRY, BY REGION, 2019–2023 (USD MILLION)
TABLE 199 ROLLER: CONVEYOR SYSTEM MARKET FOR ELECTRONICS INDUSTRY, BY REGION, 2024–2030 (USD MILLION)
TABLE 200 OTHER TYPES: CONVEYOR SYSTEM MARKET FOR ELECTRONICS INDUSTRY, BY REGION, 2019–2023 (THOUSAND METERS)
TABLE 201 OTHER TYPES: CONVEYOR SYSTEM MARKET FOR ELECTRONICS INDUSTRY, BY REGION, 2024–2030 (THOUSAND METERS)
TABLE 202 OTHER TYPES: CONVEYOR SYSTEM MARKET FOR ELECTRONICS INDUSTRY, BY REGION, 2019–2023 (USD MILLION)
TABLE 203 OTHER TYPES: CONVEYOR SYSTEM MARKET FOR ELECTRONICS INDUSTRY, BY REGION, 2024–2030 (USD MILLION)
TABLE 204 CONVEYOR SYSTEM MARKET FOR FOOD & BEVERAGE INDUSTRY, BY SUB-INDUSTRY, 2019–2023 (THOUSAND METERS)
TABLE 205 CONVEYOR SYSTEM MARKET FOR FOOD & BEVERAGE INDUSTRY, BY SUB-INDUSTRY, 2024–2030 (THOUSAND METERS)
TABLE 206 CONVEYOR SYSTEM MARKET FOR FOOD & BEVERAGE INDUSTRY, BY SUB-INDUSTRY, 2019–2023 (USD MILLION)
TABLE 207 CONVEYOR SYSTEM MARKET FOR FOOD & BEVERAGE INDUSTRY, BY SUB-INDUSTRY, 2024–2030 (USD MILLION)
TABLE 208 MEAT & POULTRY: CONVEYOR SYSTEM MARKET, BY REGION, 2019–2023 (THOUSAND METERS)
TABLE 209 MEAT & POULTRY: CONVEYOR SYSTEM MARKET, BY REGION, 2024–2030 (THOUSAND METERS)
TABLE 210 MEAT & POULTRY: CONVEYOR SYSTEM MARKET, BY REGION, 2019–2023 (USD MILLION)
TABLE 211 MEAT & POULTRY: CONVEYOR SYSTEM MARKET, BY REGION, 2024–2030 (USD MILLION)
TABLE 212 DAIRY: CONVEYOR SYSTEM MARKET, BY REGION, 2019–2023 (THOUSAND METERS)
TABLE 213 DAIRY: CONVEYOR SYSTEM MARKET, BY REGION, 2024–2030 (THOUSAND METERS)
TABLE 214 DAIRY: CONVEYOR SYSTEM MARKET, BY REGION, 2019–2023 (USD MILLION)
TABLE 215 DAIRY: CONVEYOR SYSTEM MARKET, BY REGION, 2024–2030 (USD MILLION)
TABLE 216 OTHER SUB-INDUSTRIES: CONVEYOR SYSTEM MARKET, BY REGION, 2019–2023 (THOUSAND METERS)
TABLE 217 OTHER SUB-INDUSTRIES: CONVEYOR SYSTEM MARKET, BY REGION, 2024–2030 (THOUSAND METERS)
TABLE 218 OTHER SUB-INDUSTRIES: CONVEYOR SYSTEM MARKET, BY REGION, 2019–2023 (USD MILLION)
TABLE 219 OTHER SUB-INDUSTRIES: CONVEYOR SYSTEM MARKET, BY REGION, 2024–2030 (USD MILLION)
TABLE 220 CONVEYOR SYSTEM MARKET, BY REGION, 2019–2023 (THOUSAND METERS)
TABLE 221 CONVEYOR SYSTEM MARKET, BY REGION, 2024–2030 (THOUSAND METERS)
TABLE 222 CONVEYOR SYSTEM MARKET, BY REGION, 2019–2023 (USD MILLION)
TABLE 223 CONVEYOR SYSTEM MARKET, BY REGION, 2024–2030 (USD MILLION)
TABLE 224 ASIA PACIFIC: CONVEYOR SYSTEM MARKET, BY COUNTRY, 2019–2023 (THOUSAND METERS)
TABLE 225 ASIA PACIFIC: CONVEYOR SYSTEM MARKET, BY COUNTRY, 2024–2030 (THOUSAND METERS)
TABLE 226 ASIA PACIFIC: CONVEYOR SYSTEM MARKET, BY COUNTRY, 2019–2023 (USD MILLION)
TABLE 227 ASIA PACIFIC: CONVEYOR SYSTEM MARKET, BY COUNTRY, 2024–2030 (USD MILLION)
TABLE 228 CHINA: CONVEYOR SYSTEM MARKET, BY INDUSTRY, 2019–2023 (THOUSAND METERS)
TABLE 229 CHINA: CONVEYOR SYSTEM MARKET, BY INDUSTRY, 2024–2030 (THOUSAND METERS)
TABLE 230 CHINA: CONVEYOR SYSTEM MARKET, BY INDUSTRY, 2019–2023 (USD MILLION)
TABLE 231 CHINA: CONVEYOR SYSTEM MARKET, BY INDUSTRY, 2024–2030 (USD MILLION)
TABLE 232 INDIA: CONVEYOR SYSTEM MARKET, BY INDUSTRY, 2019–2023 (THOUSAND METERS)
TABLE 233 INDIA: CONVEYOR SYSTEM MARKET, BY INDUSTRY, 2024–2030 (THOUSAND METERS)
TABLE 234 INDIA: CONVEYOR SYSTEM MARKET, BY INDUSTRY, 2019–2023 (USD MILLION)
TABLE 235 INDIA: CONVEYOR SYSTEM MARKET, BY INDUSTRY, 2024–2030 (USD MILLION)
TABLE 236 JAPAN: CONVEYOR SYSTEM MARKET, BY INDUSTRY, 2019–2023 (THOUSAND METERS)
TABLE 237 JAPAN: CONVEYOR SYSTEM MARKET, BY INDUSTRY, 2024–2030 (THOUSAND METERS)
TABLE 238 JAPAN: CONVEYOR SYSTEM MARKET, BY INDUSTRY, 2019–2023 (USD MILLION)
TABLE 239 JAPAN: CONVEYOR SYSTEM MARKET, BY INDUSTRY, 2024–2030 (USD MILLION)
TABLE 240 SOUTH KOREA: CONVEYOR SYSTEM MARKET, BY INDUSTRY, 2019–2023 (THOUSAND METERS)
TABLE 241 SOUTH KOREA: CONVEYOR SYSTEM MARKET, BY INDUSTRY, 2024–2030 (THOUSAND METERS)
TABLE 242 SOUTH KOREA: CONVEYOR SYSTEM MARKET, BY INDUSTRY, 2019–2023 (USD MILLION)
TABLE 243 SOUTH KOREA: CONVEYOR SYSTEM MARKET, BY INDUSTRY, 2024–2030 (USD MILLION)
TABLE 244 REST OF ASIA PACIFIC: CONVEYOR SYSTEM MARKET, BY INDUSTRY, 2019–2023 (THOUSAND METERS)
TABLE 245 REST OF ASIA PACIFIC: CONVEYOR SYSTEM MARKET, BY INDUSTRY, 2024–2030 (THOUSAND METERS)
TABLE 246 REST OF ASIA PACIFIC: CONVEYOR SYSTEM MARKET, BY INDUSTRY, 2019–2023 (USD MILLION)
TABLE 247 REST OF ASIA PACIFIC: CONVEYOR SYSTEM MARKET, BY INDUSTRY, 2024–2030 (USD MILLION)
TABLE 248 EUROPE: CONVEYOR SYSTEM MARKET, BY COUNTRY, 2019–2023 (THOUSAND METERS)
TABLE 249 EUROPE: CONVEYOR SYSTEM MARKET, BY COUNTRY, 2024–2030 (THOUSAND METERS)
TABLE 250 EUROPE: CONVEYOR SYSTEM MARKET, BY COUNTRY, 2019–2023 (USD MILLION)
TABLE 251 EUROPE: CONVEYOR SYSTEM MARKET, BY COUNTRY, 2024–2030 (USD MILLION)
TABLE 252 GERMANY: CONVEYOR SYSTEM MARKET, BY INDUSTRY, 2019–2023 (THOUSAND METERS)
TABLE 253 GERMANY: CONVEYOR SYSTEM MARKET, BY INDUSTRY, 2024–2030 (THOUSAND METERS)
TABLE 254 GERMANY: CONVEYOR SYSTEM MARKET, BY INDUSTRY, 2019–2023 (USD MILLION)
TABLE 255 GERMANY: CONVEYOR SYSTEM MARKET, BY INDUSTRY, 2024–2030 (USD MILLION)
TABLE 256 FRANCE: CONVEYOR SYSTEM MARKET, BY INDUSTRY, 2019–2023 (THOUSAND METERS)
TABLE 257 FRANCE: CONVEYOR SYSTEM MARKET, BY INDUSTRY, 2024–2030 (THOUSAND METERS)
TABLE 258 FRANCE: CONVEYOR SYSTEM MARKET, BY INDUSTRY, 2019–2023 (USD MILLION)
TABLE 259 FRANCE: CONVEYOR SYSTEM MARKET, BY INDUSTRY, 2024–2030 (USD MILLION)
TABLE 260 UK: CONVEYOR SYSTEM MARKET, BY INDUSTRY, 2019–2023 (THOUSAND METERS)
TABLE 261 UK: CONVEYOR SYSTEM MARKET, BY INDUSTRY, 2024–2030 (THOUSAND METERS)
TABLE 262 UK: CONVEYOR SYSTEM MARKET, BY INDUSTRY, 2019–2023 (USD MILLION)
TABLE 263 UK: CONVEYOR SYSTEM MARKET, BY INDUSTRY, 2024–2030 (USD MILLION)
TABLE 264 SPAIN: CONVEYOR SYSTEM MARKET, BY INDUSTRY, 2019–2023 (THOUSAND METERS)
TABLE 265 SPAIN: CONVEYOR SYSTEM MARKET, BY INDUSTRY, 2024–2030 (THOUSAND METERS)
TABLE 266 SPAIN: CONVEYOR SYSTEM MARKET, BY INDUSTRY, 2019–2023 (USD MILLION)
TABLE 267 SPAIN: CONVEYOR SYSTEM MARKET, BY INDUSTRY, 2024–2030 (USD MILLION)
TABLE 268 ITALY: CONVEYOR SYSTEM MARKET, BY INDUSTRY, 2019–2023 (THOUSAND METERS)
TABLE 269 ITALY: CONVEYOR SYSTEM MARKET, BY INDUSTRY, 2024–2030 (THOUSAND METERS)
TABLE 270 ITALY: CONVEYOR SYSTEM MARKET, BY INDUSTRY, 2019–2023 (USD MILLION)
TABLE 271 ITALY: CONVEYOR SYSTEM MARKET, BY INDUSTRY, 2024–2030 (USD MILLION)
TABLE 272 RUSSIA: CONVEYOR SYSTEM MARKET, BY INDUSTRY, 2019–2023 (THOUSAND METERS)
TABLE 273 RUSSIA: CONVEYOR SYSTEM MARKET, BY INDUSTRY, 2024–2030 (THOUSAND METERS)
TABLE 274 RUSSIA: CONVEYOR SYSTEM MARKET, BY INDUSTRY, 2019–2023 (USD MILLION)
TABLE 275 RUSSIA: CONVEYOR SYSTEM MARKET, BY INDUSTRY, 2024–2030 (USD MILLION)
TABLE 276 REST OF EUROPE: CONVEYOR SYSTEM MARKET, BY INDUSTRY, 2019–2023 (THOUSAND METERS)
TABLE 277 REST OF EUROPE: CONVEYOR SYSTEM MARKET, BY INDUSTRY, 2024–2030 (THOUSAND METERS)
TABLE 278 REST OF EUROPE: CONVEYOR SYSTEM MARKET, BY INDUSTRY, 2019–2023 (USD MILLION)
TABLE 279 REST OF EUROPE: CONVEYOR SYSTEM MARKET, BY INDUSTRY, 2024–2030 (USD MILLION)
TABLE 280 NORTH AMERICA: CONVEYOR SYSTEM MARKET, BY COUNTRY, 2019–2023 (THOUSAND METERS)
TABLE 281 NORTH AMERICA: CONVEYOR SYSTEM MARKET, BY COUNTRY, 2024–2030 (THOUSAND METERS)
TABLE 282 NORTH AMERICA: CONVEYOR SYSTEM MARKET, BY COUNTRY, 2019–2023 (USD MILLION)
TABLE 283 NORTH AMERICA: CONVEYOR SYSTEM MARKET, BY COUNTRY, 2024–2030 (USD MILLION)
TABLE 284 US: CONVEYOR SYSTEM MARKET, BY INDUSTRY, 2019–2023 (THOUSAND METERS)
TABLE 285 US: CONVEYOR SYSTEM MARKET, BY INDUSTRY, 2024–2030 (THOUSAND METERS)
TABLE 286 US: CONVEYOR SYSTEM MARKET, BY INDUSTRY, 2019–2023 (USD MILLION)
TABLE 287 US: CONVEYOR SYSTEM MARKET, BY INDUSTRY, 2024–2030 (USD MILLION)
TABLE 288 CANADA: CONVEYOR SYSTEM MARKET, BY INDUSTRY, 2019–2023 (THOUSAND METERS)
TABLE 289 CANADA: CONVEYOR SYSTEM MARKET, BY INDUSTRY, 2024–2030 (THOUSAND METERS)
TABLE 290 CANADA: CONVEYOR SYSTEM MARKET, BY INDUSTRY, 2019–2023 (USD MILLION)
TABLE 291 CANADA: CONVEYOR SYSTEM MARKET, BY INDUSTRY, 2024–2030 (USD MILLION)
TABLE 292 MEXICO: CONVEYOR SYSTEM MARKET, BY INDUSTRY, 2019–2023 (THOUSAND METERS)
TABLE 293 MEXICO: CONVEYOR SYSTEM MARKET, BY INDUSTRY, 2024–2030 (THOUSAND METERS)
TABLE 294 MEXICO: CONVEYOR SYSTEM MARKET, BY INDUSTRY, 2019–2023 (USD MILLION)
TABLE 295 MEXICO: CONVEYOR SYSTEM MARKET, BY INDUSTRY, 2024–2030 (USD MILLION)
TABLE 296 REST OF THE WORLD: CONVEYOR SYSTEM MARKET, BY COUNTRY, 2019–2023 (THOUSAND METERS)
TABLE 297 REST OF THE WORLD: CONVEYOR SYSTEM MARKET, BY COUNTRY, 2024–2030 (THOUSAND METERS)
TABLE 298 REST OF THE WORLD: CONVEYOR SYSTEM MARKET, BY COUNTRY, 2019–2023 (USD MILLION)
TABLE 299 REST OF THE WORLD: CONVEYOR SYSTEM MARKET, BY COUNTRY, 2024–2030 (USD MILLION)
TABLE 300 BRAZIL: CONVEYOR SYSTEM MARKET, BY INDUSTRY, 2019–2023 (THOUSAND METERS)
TABLE 301 BRAZIL: CONVEYOR SYSTEM MARKET, BY INDUSTRY, 2024–2030 (THOUSAND METERS)
TABLE 302 BRAZIL: CONVEYOR SYSTEM MARKET, BY INDUSTRY, 2019–2023 (USD MILLION)
TABLE 303 BRAZIL: CONVEYOR SYSTEM MARKET, BY INDUSTRY, 2024–2030 (USD MILLION)
TABLE 304 SOUTH AFRICA: CONVEYOR SYSTEM MARKET, BY INDUSTRY, 2019–2023 (THOUSAND METERS)
TABLE 305 SOUTH AFRICA: CONVEYOR SYSTEM MARKET, BY INDUSTRY, 2024–2030 (THOUSAND METERS)
TABLE 306 SOUTH AFRICA: CONVEYOR SYSTEM MARKET, BY INDUSTRY, 2019–2023 (USD MILLION)
TABLE 307 SOUTH AFRICA: CONVEYOR SYSTEM MARKET, BY INDUSTRY, 2024–2030 (USD MILLION)
TABLE 308 TURKEY: CONVEYOR SYSTEM MARKET, BY INDUSTRY, 2019–2023 (THOUSAND METERS)
TABLE 309 TURKEY: CONVEYOR SYSTEM MARKET, BY INDUSTRY, 2024–2030 (THOUSAND METERS)
TABLE 310 TURKEY: CONVEYOR SYSTEM MARKET, BY INDUSTRY, 2019–2023 (USD MILLION)
TABLE 311 TURKEY: CONVEYOR SYSTEM MARKET, BY INDUSTRY, 2024–2030 (USD MILLION)
TABLE 312 OTHERS: CONVEYOR SYSTEM MARKET, BY INDUSTRY, 2019–2023 (THOUSAND METERS)
TABLE 313 OTHERS: CONVEYOR SYSTEM MARKET, BY INDUSTRY, 2024–2030 (THOUSAND METERS)
TABLE 314 OTHERS: CONVEYOR SYSTEM MARKET, BY INDUSTRY, 2019–2023 (USD MILLION)
TABLE 315 OTHERS: CONVEYOR SYSTEM MARKET, BY INDUSTRY, 2024–2030 (USD MILLION)
TABLE 316 KEY PLAYER STRATEGIES/RIGHT TO WIN, 2020–2024
TABLE 317 CONVEYOR SYSTEM MARKET: MARKET SHARE ANALYSIS, 2023
TABLE 318 TYPE FOOTPRINT
TABLE 319 COMPONENT FOOTPRINT
TABLE 320 INDUSTRY FOOTPRINT
TABLE 321 OPERATION FOOTPRINT
TABLE 322 REGION FOOTPRINT
TABLE 323 LIST OF START-UPS/SMES
TABLE 324 COMPETITIVE BENCHMARKING OF START-UPS/SMES
TABLE 325 CONVEYOR SYSTEM MARKET: PRODUCT LAUNCHES/DEVELOPMENTS, 2020–2024
TABLE 326 CONVEYOR SYSTEM MARKET: DEALS, 2020–2024
TABLE 327 CONVEYOR SYSTEM MARKET: EXPANSIONS, 2020–2024
TABLE 328 CONVEYOR SYSTEM MARKET: OTHERS, 2020–2024
TABLE 329 SIEMENS AG: COMPANY OVERVIEW
TABLE 330 SIEMENS AG: PRODUCTS/SOLUTIONS OFFERED
TABLE 331 SIEMENS AG: PRODUCT LAUNCHES/DEVELOPMENTS
TABLE 332 SIEMENS AG: DEALS
TABLE 333 SIEMENS AG: EXPANSIONS
TABLE 334 SIEMENS AG: OTHERS
TABLE 335 CONTINENTAL AG: COMPANY OVERVIEW
TABLE 336 CONTINENTAL AG: PRODUCTS/SOLUTIONS OFFERED
TABLE 337 CONTINENTAL AG: PRODUCT LAUNCHES/DEVELOPMENTS
TABLE 338 CONTINENTAL AG: DEALS
TABLE 339 CONTINENTAL AG: EXPANSIONS
TABLE 340 CONTINENTAL AG: OTHERS
TABLE 341 DAIFUKU CO., LTD.: COMPANY OVERVIEW
TABLE 342 DAIFUKU CO., LTD.: PRODUCTS/SOLUTIONS OFFERED
TABLE 343 DAIFUKU CO., LTD.: PRODUCT LAUNCHES/DEVELOPMENTS
TABLE 344 DAIFUKU CO., LTD.: DEALS
TABLE 345 DAIFUKU CO., LTD.: OTHERS
TABLE 346 FIVES GROUP: COMPANY OVERVIEW
TABLE 347 FIVES GROUP: PRODUCTS/SOLUTIONS OFFERED
TABLE 348 FIVES GROUP: PRODUCT LAUNCHES/DEVELOPMENTS
TABLE 349 FIVES GROUP: DEALS
TABLE 350 FIVES GROUP: EXPANSIONS
TABLE 351 FIVES GROUP: OTHERS
TABLE 352 SWISSLOG HOLDING AG: COMPANY OVERVIEW
TABLE 353 SWISSLOG HOLDING AG: PRODUCTS/SOLUTIONS OFFERED
TABLE 354 SWISSLOG HOLDING AG: DEALS
TABLE 355 SWISSLOG HOLDING AG: EXPANSIONS
TABLE 356 SWISSLOG HOLDING AG: OTHERS
TABLE 357 TAIKISHA LTD: COMPANY OVERVIEW
TABLE 358 TAIKISHA LTD: PRODUCTS/SOLUTIONS OFFERED
TABLE 359 TAIKISHA LTD: EXPANSIONS
TABLE 360 HONEYWELL INTERNATIONAL INC.: COMPANY OVERVIEW
TABLE 361 HONEYWELL INTERNATIONAL INC.: PRODUCTS/SOLUTIONS OFFERED
TABLE 362 HONEYWELL INTERNATIONAL INC.: PRODUCT LAUNCHES/DEVELOPMENTS
TABLE 363 HONEYWELL INTERNATIONAL INC.: DEALS
TABLE 364 HONEYWELL INTERNATIONAL INC.: EXPANSIONS
TABLE 365 INTERROLL GROUP: COMPANY OVERVIEW
TABLE 366 INTERROLL GROUP: PRODUCTS/SOLUTIONS OFFERED
TABLE 367 INTERROLL GROUP: PRODUCT LAUNCHES/DEVELOPMENTS
TABLE 368 INTERROLL GROUP: DEALS
TABLE 369 INTERROLL GROUP: EXPANSIONS
TABLE 370 INTERROLL GROUP: OTHERS
TABLE 371 METSO OUTOTEC: COMPANY OVERVIEW
TABLE 372 METSO OUTOTEC: PRODUCTS/SOLUTIONS OFFERED
TABLE 373 METSO OUTOTEC: PRODUCT LAUNCHES/DEVELOPMENTS
TABLE 374 METSO OUTOTEC: DEALS
TABLE 375 METSO OUTOTEC: EXPANSIONS
TABLE 376 METSO OUTOTEC: OTHERS
TABLE 377 MURATA MACHINERY, LTD.: COMPANY OVERVIEW
TABLE 378 MURATA MACHINERY, LTD.: PRODUCTS/SOLUTIONS OFFERED
TABLE 379 MURATA MACHINERY, LTD.: PRODUCT LAUNCHES/DEVELOPMENTS
TABLE 380 MURATA MACHINERY, LTD.: DEALS
TABLE 381 DURR GROUP: COMPANY OVERVIEW
TABLE 382 DURR GROUP: PRODUCTS/SOLUTIONS OFFERED
TABLE 383 DURR GROUP: DEALS
TABLE 384 DURR GROUP: OTHERS
TABLE 385 BOSCH REXROTH KFT.: COMPANY OVERVIEW
TABLE 386 BOSCH REXROTH KFT.: PRODUCTS/SOLUTIONS OFFERED
TABLE 387 BOSCH REXROTH KFT.: PRODUCT LAUNCHES/DEVELOPMENTS
TABLE 388 BOSCH REXROTH KFT.: DEALS
TABLE 389 BOSCH REXROTH KFT.: EXPANSIONS
TABLE 390 KNAPP AG: COMPANY OVERVIEW
TABLE 391 VANDERLANDE INDUSTRIES: COMPANY OVERVIEW
TABLE 392 SEMPERIT AG HOLDING: COMPANY OVERVIEW
TABLE 393 BEUMER GROUP: COMPANY OVERVIEW
TABLE 394 KARDEX: COMPANY OVERVIEW
TABLE 395 DEMATIC: COMPANY OVERVIEW
TABLE 396 SSI SCHAEFER: COMPANY OVERVIEW
TABLE 397 BASTION SOLUTIONS, LLC: COMPANY OVERVIEW
TABLE 398 INVATA INTRALOGISTICS: COMPANY OVERVIEW
TABLE 399 WESTFALIA TECHNOLOGIES, INC.: COMPANY OVERVIEW
TABLE 400 MHS GLOBAL: COMPANY OVERVIEW
TABLE 401 DMW&H: COMPANY OVERVIEW
TABLE 402 OMNIA DELLA TOFFOLA SPA: COMPANY OVERVIEW
TABLE 403 FLEXLINK: COMPANY OVERVIEW
TABLE 404 FLEXICON CORPORATION: COMPANY OVERVIEW
TABLE 405 MECALUX, S.A.: COMPANY OVERVIEW
  
 
LIST OF FIGURES (88 Figures) 
 
FIGURE 1 CONVEYOR SYSTEM MARKET SEGMENTATION
FIGURE 2 RESEARCH DESIGN
FIGURE 3 RESEARCH DESIGN MODEL
FIGURE 4 RESEARCH METHODOLOGY: HYPOTHESIS BUILDING
FIGURE 5 BOTTOM-UP APPROACH (INDUSTRY AND REGION)
FIGURE 6 TOP-DOWN APPROACH (TYPE AND COMPONENT)
FIGURE 7 MARKET SIZE ESTIMATION NOTES
FIGURE 8 GROWTH PROJECTIONS FROM DEMAND-SIDE DRIVERS
FIGURE 9 DATA TRIANGULATION
FIGURE 10 DEMAND- AND SUPPLY-SIDE FACTOR ANALYSIS
FIGURE 11 REGIONAL ECONOMY IMPACT ANALYSIS
FIGURE 12 CONVEYOR SYSTEM MARKET OVERVIEW
FIGURE 13 ASIA PACIFIC TO BE FASTEST-GROWING MARKET DURING FORECAST PERIOD
FIGURE 14 DRIVING UNIT TO BE FASTEST-GROWING SEGMENT DURING FORECAST PERIOD
FIGURE 15 RISING DEMAND FROM MANUFACTURING INDUSTRIES TO DRIVE MARKET
FIGURE 16 BELT SEGMENT TO BE PREVALENT DURING FORECAST PERIOD
FIGURE 17 AUTOMATIC TO SURPASS OTHER SEGMENTS DURING FORECAST PERIOD
FIGURE 18 DRIVING UNIT SEGMENT TO SECURE LEADING POSITION DURING FORECAST PERIOD
FIGURE 19 BELT SEGMENT TO BE DOMINANT IN RETAIL & DISTRIBUTION INDUSTRY DURING FORECAST PERIOD
FIGURE 20 BELT SEGMENT TO BE DOMINANT IN ELECTRONICS INDUSTRY DURING FORECAST PERIOD
FIGURE 21 MEAT & POULTRY SEGMENT TO BE DOMINANT IN FOOD & BEVERAGE INDUSTRY DURING FORECAST PERIOD
FIGURE 22 ROLLER SEGMENT TO BE DOMINANT IN AUTOMOTIVE INDUSTRY DURING FORECAST PERIOD
FIGURE 23 BELT SEGMENT TO BE DOMINANT IN AIRPORT INDUSTRY DURING FORECAST PERIOD
FIGURE 24 BELT SEGMENT TO BE DOMINANT IN MINING INDUSTRY DURING FORECAST PERIOD
FIGURE 25 OPEN-PIT MINING SEGMENT TO BE LARGER THAN UNDERGROUND MINING SEGMENT DURING FORECAST PERIOD
FIGURE 26 GEARLESS TO BE FASTEST-GROWING SEGMENT DURING FORECAST PERIOD
FIGURE 27 EUROPE TO BE LARGEST MARKET FOR CONVEYOR SYSTEMS DURING FORECAST PERIOD
FIGURE 28 CONVEYOR SYSTEM MARKET DYNAMICS
FIGURE 29 TRENDS AND DISRUPTIONS IMPACTING CUSTOMERS’ BUSINESSES
FIGURE 30 AVERAGE SELLING PRICE OF CONVEYOR SYSTEMS, BY TYPE, 2021–2023 (USD)
FIGURE 31 AVERAGE SELLING PRICE OF CONVEYOR SYSTEMS, BY REGION, 2021–2023 (USD)
FIGURE 32 ECOSYSTEM ANALYSIS
FIGURE 33 PATENT ANALYSIS
FIGURE 34 SUPPLY CHAIN ANALYSIS
FIGURE 35 INVESTMENT AND FUNDING SCENARIO, 2022–2024
FIGURE 36 IMPORT DATA, BY COUNTRY, 2020–2023 (USD MILLION)
FIGURE 37 EXPORT DATA, BY COUNTRY, 2020–2023 (USD MILLION)
FIGURE 38 INFLUENCE OF STAKEHOLDERS ON BUYING PROCESS, BY INDUSTRY
FIGURE 39 KEY BUYING CRITERIA, BY INDUSTRY
FIGURE 40 CONVEYOR SYSTEM MARKET, BY TYPE, 2024–2030 (USD MILLION)
FIGURE 41 CONVEYOR SYSTEM MARKET, BY COMPONENT, 2024–2030 (USD MILLION)
FIGURE 42 CONVEYOR SYSTEM MARKET, BY OPERATION, 2024–2030 (USD MILLION)
FIGURE 43 CONVEYOR SYSTEM MARKET FOR AIRPORT INDUSTRY, BY TYPE, 2024–2030 (USD MILLION)
FIGURE 44 CONVEYOR SYSTEM MARKET FOR RETAIL & DISTRIBUTION INDUSTRY, BY TYPE 2024–2030 (USD MILLION)
FIGURE 45 CONVEYOR SYSTEM MARKET FOR MINING INDUSTRY, BY TYPE, 2024–2030 (USD MILLION)
FIGURE 46 MINING CONVEYOR SYSTEM MARKET, BY APPLICATION, 2024–2030 (USD MILLION)
FIGURE 47 MINING CONVEYOR SYSTEM MARKET, BY TECHNOLOGY, 2024–2030 (USD MILLION)
FIGURE 48 CONVEYOR SYSTEM MARKET FOR AUTOMOTIVE INDUSTRY, BY TYPE, 2024–2030 (USD MILLION)
FIGURE 49 CONVEYOR SYSTEM MARKET FOR ELECTRONICS INDUSTRY, BY TYPE, 2024–2030 (USD MILLION)
FIGURE 50 CONVEYOR SYSTEM MARKET FOR FOOD & BEVERAGE INDUSTRY, BY SUB-INDUSTRY, 2024–2030 (USD MILLION)
FIGURE 51 CONVEYOR SYSTEM MARKET, BY REGION, 2024–2030 (USD MILLION)
FIGURE 52 ASIA PACIFIC: CONVEYOR SYSTEM MARKET SNAPSHOT
FIGURE 53 ASIA PACIFIC: REAL GDP GROWTH RATE, BY COUNTRY, 2023–2025
FIGURE 54 ASIA PACIFIC: GDP PER CAPITA, BY COUNTRY, 2023–2025
FIGURE 55 ASIA PACIFIC: INFLATION RATE AVERAGE CONSUMER PRICES, BY COUNTRY, 2023–2025
FIGURE 56 ASIA PACIFIC: MANUFACTURING INDUSTRY CONTRIBUTION TO GDP, 2023
FIGURE 57 EUROPE: CONVEYOR SYSTEM MARKET SNAPSHOT
FIGURE 58 EUROPE: REAL GDP GROWTH RATE, BY COUNTRY, 2023–2025
FIGURE 59 EUROPE: GDP PER CAPITA, BY COUNTRY, 2023–2025
FIGURE 60 EUROPE: INFLATION RATE AVERAGE CONSUMER PRICES, BY COUNTRY, 2023–2025
FIGURE 61 EUROPE: MANUFACTURING INDUSTRY CONTRIBUTION TO GDP, 2023
FIGURE 62 NORTH AMERICA: CONVEYOR SYSTEM MARKET, BY COUNTRY, 2024–2030
FIGURE 63 NORTH AMERICA: REAL GDP GROWTH RATE, BY COUNTRY, 2023–2025
FIGURE 64 NORTH AMERICA: GDP PER CAPITA, BY COUNTRY, 2023–2025
FIGURE 65 NORTH AMERICA: CPI INFLATION RATE, BY COUNTRY, 2023–2025
FIGURE 66 NORTH AMERICA: MANUFACTURING INDUSTRY CONTRIBUTION TO GDP, 2023
FIGURE 67 REST OF THE WORLD: CONVEYOR SYSTEM MARKET, BY COUNTRY, 2024–2030
FIGURE 68 REST OF THE WORLD: REAL GDP ANNUAL PERCENTAGE CHANGE, 2023–2025
FIGURE 69 REST OF THE WORLD: GDP PER CAPITA, 2023–2025
FIGURE 70 REST OF THE WORLD: AVERAGE CPI INFLATION RATE, 2023–2025
FIGURE 71 REST OF THE WORLD: MANUFACTURING INDUSTRY VALUE (AS PART OF GDP), 2023
FIGURE 72 MARKET SHARE ANALYSIS OF KEY PLAYERS, 2023
FIGURE 73 REVENUE ANALYSIS OF TOP FIVE PLAYERS, 2019–2023
FIGURE 74 COMPANY VALUATION OF TOP FIVE PLAYERS
FIGURE 75 FINANCIAL MATRIX OF TOP FIVE PLAYERS
FIGURE 76 BRAND/PRODUCT COMPARISON
FIGURE 77 COMPANY EVALUATION MATRIX (KEY PLAYERS), 2024
FIGURE 78 COMPANY FOOTPRINT
FIGURE 79 COMPANY EVALUATION MATRIX (START-UPS/SMES), 2024
FIGURE 80 SIEMENS AG: COMPANY SNAPSHOT
FIGURE 81 CONTINENTAL AG: COMPANY SNAPSHOT
FIGURE 82 DAIFUKU CO., LTD.: COMPANY SNAPSHOT
FIGURE 83 FIVES GROUP: COMPANY SNAPSHOT
FIGURE 84 TAIKISHA LTD: COMPANY SNAPSHOT
FIGURE 85 HONEYWELL INTERNATIONAL INC.: COMPANY SNAPSHOT
FIGURE 86 INTERROLL GROUP: COMPANY SNAPSHOT
FIGURE 87 METSO OUTOTEC: COMPANY SNAPSHOT
FIGURE 88 DURR GROUP: COMPANY SNAPSHOT

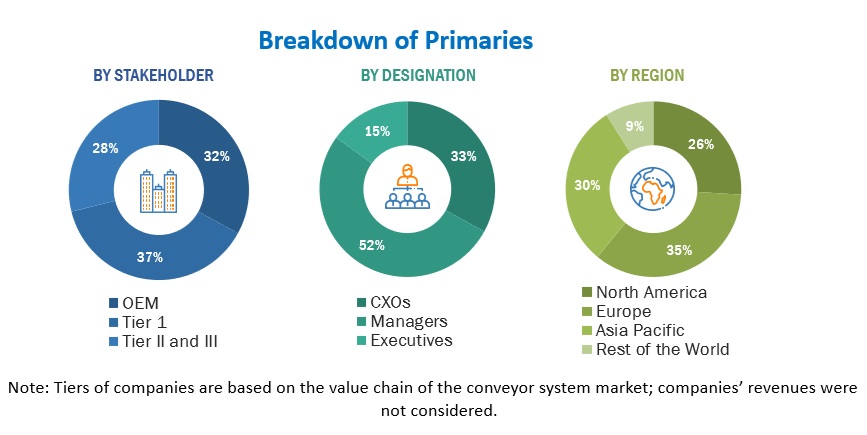
The research study involved extensive secondary sources, such as company annual reports/presentations, industry association publications, magazine articles, directories, technical handbooks, World Economic Outlook, trade websites, technical articles, and databases, to identify and collect information on the Conveyor System  market. Primary sources, such as experts from related industries, automobile OEMs, and suppliers, were interviewed to obtain and verify critical information and assess the growth prospects and market estimations.

Secondary Research

Secondary sources for this research study include corporate filings, such as annual reports, investor presentations, and financial statements; trade, business, and professional associations; whitepapers, marklines, and the OICA (International Organization of Motor Vehicle Manufacturers); certified publications; articles by recognized authors; directories; and databases. Secondary data was collected and analyzed to determine the overall market size, further validated by primary research.

Primary Research

Extensive primary research was conducted after understanding the Conveyor System  market scenario through secondary research. Several primary interviews were conducted with market experts from the demand side (vehicle manufacturers, country-level government associations, and trade associations) and the supply side (Conveyor System  and buses manufacturers, component providers, and system integrators). The regions considered for the research include North America, Europe, the Asia Pacific, and the Rest of the World. Primary data was collected through questionnaires, emails, and telephonic interviews. In the canvassing of primaries, various departments within organizations, such as sales, operations, and marketing, were covered to provide a holistic viewpoint in this report.

After interacting with industry experts, brief sessions were conducted with highly experienced independent consultants to reinforce the findings from the primaries. This, along with the in-house subject matter experts’ opinions, led to the findings described in this report.
Conveyor System Market  Size, and Share

To know about the assumptions considered for the study, download the pdf brochure

Market Size Estimation

A detailed market estimation approach was followed to estimate and validate the volume and value of the Conveyor System  market and other submarkets, as mentioned below.

  • Secondary research was done to identify key players in the Conveyor System  market. Their global market share was determined through primary and secondary research.
  • The research methodology included studying the annual and quarterly financial reports & regulatory filings of major market players and interviews with industry experts for detailed market insights.
  • All major penetration rates, percentage shares, splits, and breakdowns for the Conveyor System  market across end users were determined using secondary sources and verified through primary sources.
  • All key macro indicators affecting the revenue growth of the market segments and subsegments were accounted for, viewed in extensive detail, verified through primary research, and analyzed to get the validated and verified quantitative & qualitative data.
  • The gathered market data was consolidated and added with detailed inputs, analyzed, and presented in this report.

Conveyor System  market Size: Bottom-Up Approach
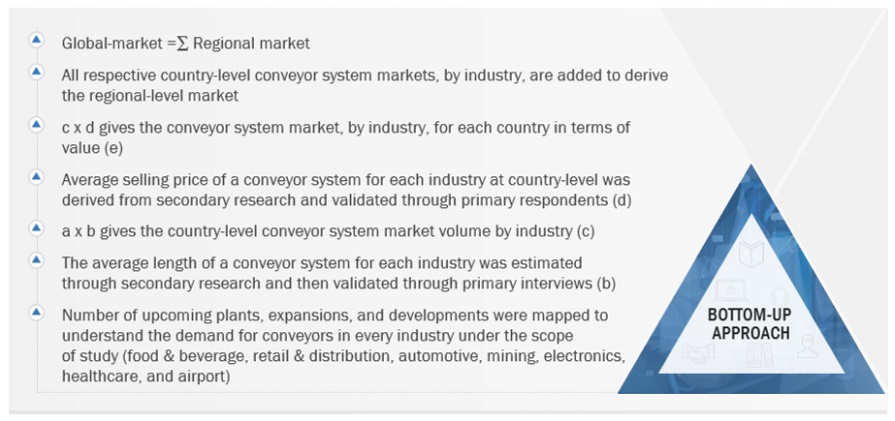
Conveyor System Market  Bottom Up Approach

To know about the assumptions considered for the study, Request for Free Sample Report

Conveyor System  market Size: Top-Down Approach
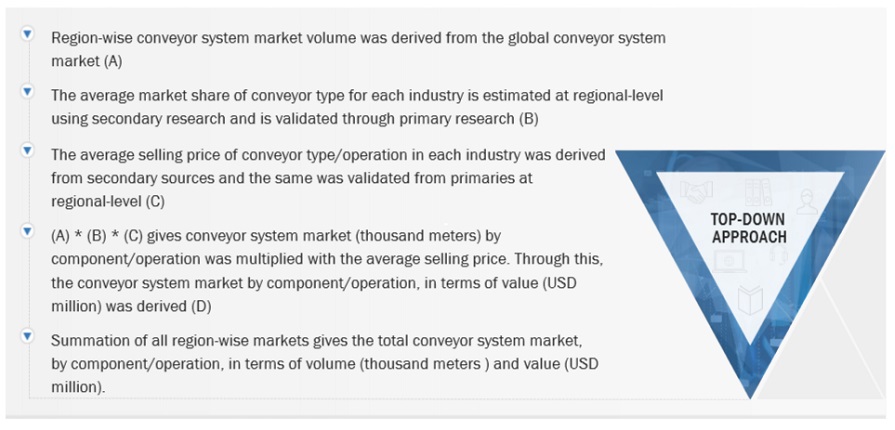
Conveyor System Market Top Down Approach

Data Triangulation

After arriving at the overall market size through bottom-up approach, the conveyor system market was split into several segments and subsegments. Where applicable, the data triangulation procedure was employed to complete the overall market engineering process and arrive at the exact market value for key segments and subsegments. The extrapolated market data was triangulated by studying various macro indicators and regional trends from both the demand- and supply-side participants.

Market Definition

Conveyor System  market: Britannica defines a conveyor as any device that provides mechanized movement of material, such as in a factory; it is used principally in industrial applications and on large farms, as well as in warehousing and freight handling for moving raw materials. Conveyors may be only a few inches in length, or they may be integrated systems several miles long.

Key Stakeholders

  • Automation System Manufacturers
  • Automotive Ancillary Players
  • Automotive OEMs
  • Conveyor Original Equipment Manufacturers (OEMs)
  • Conveyor System Component Manufacturers
  • Conveyor System Cybersecurity Providers
  • Electronics Companies
  • Food & Beverage Companies
  • Industrial Machinery Insurance Providers
  • Legal and Regulatory Authorities
  • Mining Companies
  • Raw Material Suppliers
  • Sensor Manufacturers
  • Software Providers
  • Traders, Distributors, and Suppliers

Report Objectives

  • To define, segment, analyze, and forecast the conveyor system market, in terms of volume (thousand meters) and value (USD million) between 2024 and 2030 based on:
  • To segment and forecast the market size, by type (roller, pallet, overhead, tri-planar, bucket, floor, cable, crescent, and other types)
  • To segment and forecast the market size, by operation (manual, automatic, and semi-automatic)
  • To segment and forecast the market size, by component (aluminum profile, driving unit, extremity unit, and other components)
  • To segment and forecast the market size for the airport industry, by type (belt, tri-planar, crescent, and other types)
  • To segment and forecast the market size for the retail & distribution industry, by type (belt, roller, pallet, and other types)
  • To segment and forecast the market size for the automotive industry, by type (overhead, floor, roller, and other types)
  • To segment and forecast the market size for the mining industry, by type (belt, cable, bucket, and other types)
  • To segment and forecast the market size for the electronics industry, by type (belt, roller, and other types)
  • To segment and forecast the market size for the food & beverage industry, by sub-industry (meat & poultry, dairy, and other types)
  • To segment and forecast the mining conveyor system market size, by application (open-pit mining and underground mining)
  • To segment and forecast the mining conveyor system market size, by technology (drive, gearless, and automated)
  • To segment and forecast the market size, by region (Asia Pacific, Europe, North America, and Rest of the World)
  • To provide detailed information about the factors influencing the market growth (drivers, challenges, restraints, and opportunities)
  • To strategically analyze the market, considering individual growth trends, prospects, and contributions to the total market
  • To study the following factors with respect to the market:
    • Supply Chain Analysis
    • Ecosystem Analysis
    • Technology Analysis
    • Pricing Analysis
    • Trade Data
    • Case Study Analysis
    • Patent Analysis
    • Impact of Generative AI
    • Regulatory Landscape
    • Key Stakeholders and Buying Criteria
    • Key Conferences and Events
  • To determine the following with respect to the market:
  • Market Share Analysis
  • To analyze the competitive landscape and prepare a competitive leadership mapping/market quadrant for the global players operating in the conveyor system market
  • To analyze recent developments, alliances, joint ventures, mergers & acquisitions, product launches, and other activities carried out by key participants in the conveyor system market

AVAILABLE CUSTOMIZATIONS

With the given market data, MarketsandMarkets offers customizations in accordance with a company’s specific needs.

RETAIL INDUSTRY CONVEYOR SYSTEM MARKET, BY TYPE (AT COUNTRY LEVEL)

  • Belt
  • Roller
  • Pallet

Note: The segment would be further segmented by region

Company profiles

  • Additional company profiles (up to five)
Custom Market Research Services

We will customize the research for you, in case the report listed above does not meet with your exact requirements. Our custom research will comprehensively cover the business information you require to help you arrive at strategic and profitable business decisions.

Request Customization

Instant Answers with GPT - Ask Now!

Ask real questions. Get complete answers !
Report Code
AT 4933
Published ON
Sep, 2024
Choose License Type
BUY NOW
  • SHARE
X
Request Customization
Speak to Analyst
Speak to Analyst
OR FACE-TO-FACE MEETING
PERSONALIZE THIS RESEARCH
  • Triangulate with your Own Data
  • Get Data as per your Format and Definition
  • Gain a Deeper Dive on a Specific Application, Geography, Customer or Competitor
  • Any level of Personalization
REQUEST A FREE CUSTOMIZATION
LET US HELP YOU!
  • What are the Known and Unknown Adjacencies Impacting the Conveyor System Market
  • What will your New Revenue Sources be?
  • Who will be your Top Customer; what will make them switch?
  • Defend your Market Share or Win Competitors
  • Get a Scorecard for Target Partners
CUSTOMIZED WORKSHOP REQUEST
  • Call Us
  • +1-888-600-6441 (Corporate office hours)
  • +1-888-600-6441 (US/Can toll free)
  • +44-800-368-9399 (UK office hours)
CONNECT WITH US
ABOUT TRUST ONLINE
©2024 MarketsandMarkets Research Private Ltd. All rights reserved
DMCA.com Protection Status Website Feedback