Cooling Tower Rental Market by Type (Wet,Dry,Hybrid), Design (Mechanical Draft,Natural Draft), Capacity (Up To 500 Tons,500-1000 Tons ,1000-1500 Tons,1500-3000 Tons and Above 3000 Tons), End-User , Region - Global Forecast to 2022


[145 Pages Report] The cooling tower rental market is estimated to be USD 0.77 Billion in 2017 and is expected to grow at a CAGR of 5.18% from 2017 to 2022 to reach the market size of USD 0.99 Billion by 2022.
This growth can be attributed to the increased demand for power generation.
- Base Year: 2015
- Estimated Year: 2017
- Projected Year: 2022
- Forecast Period: 2017 to 2022
The base year considered for company profiles is 2016. Whenever information was unavailable for the base year, the prior year has been considered.
Objectives of the Study
- To define, describe, and forecast the market by design, by capacity, by type, and region.
- To provide detailed information regarding the major factors influencing the growth of this market (drivers, restraints, opportunities, and industry-specific challenges)
- To strategically analyze the market with respect to individual growth trends, future prospects, and contribution of each segment to the market
- To strategically profile key players and comprehensively analyze their market shares and core competencies
- To track and analyze competitive developments such as contracts & agreements, partnerships, and collaborations in this market
Research Methodology
This research study involved the use of extensive secondary sources, directories, and databases, such as Hoover�s, Bloomberg Businessweek, Factiva, and OneSource, to identify and collect information useful for a technical, market-oriented, and commercial study of the market. Primary sources are mainly industry experts from core and related industries, preferred suppliers, manufacturers, distributors, service providers, technology developers, standards and certification organizations of companies, and organizations related to all the segments of this industry�s value chain. The research methodology has been explained below.
- Study of annual revenues and market developments of the major players that manufacturers cooling towers
- Assessment of future trends and increasing capacity of the market
- Assessment of the market with respect to the type of cooling tower rentals used by various end-users in various applications
- Study of the market trends in various regions or countries supported by the type of cooling tower rental
- Study of contracts & developments related to the market by key players across different regions
- Finalization of the overall market sizes by triangulating the supply-side data, which includes product developments, supply chain, and annual revenues of companies manufacturing cooling tower rentals across the globe
To know about the assumptions considered for the study, download the pdf brochure
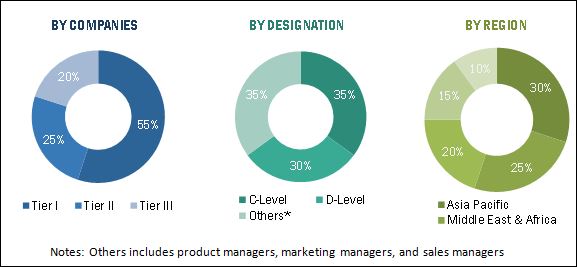
After arriving at the overall market size, the total market has been split into segments and subsegments. The figure given above illustrates the breakdown of primaries conducted during the research study on the basis of company type, designation, and region.
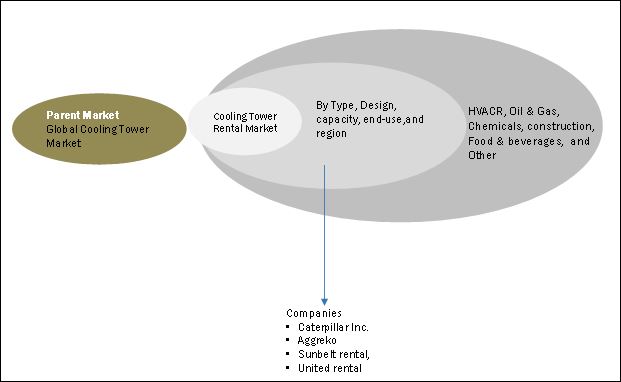
Market Ecosystem
The ecosystem of cooling tower rental market starts with the parent market which is further categorized, by capacity, into up to 500 tons, 500 to 1000 tons, 1000 to 1500 tons, 1500�3000 tons, and above 3000 tons The market is segmented, by design into mechanical draft, natural draft which includes biogas, landfill gas & sewage gas, and others, which includes producer gas, coal mine gas, wood gas, and propane gas. It has been further categorized into end-use type, into power generation and mechanical drive.
Target Audience:
The report�s target audience includes:
- Cooing tower rental manufacturing companies
- HVACR Suppliers
- Raw material suppliers
- Institutional investors
- Industry Associations
- Government and research organizations
- National and local government organizations
Scope of the Report:
The global market has been segmented as follows.
By Type:
- Wet
- Dry
- Hybrid
By Capacity:
- 500-1000 tons
- Up to 500 tons
- 1000-1500 tons
- 1500-3000 tons
- Above 3000 tons
By Design:
- Mechanical Draft
- Natural Draft
By End User:
- Industrial
- Commercial
By Region:
- North America
- South America
- Asia Pacific
- Middle East & Africa
- Europe
Available Customizations:
With the given market data, MarketsandMarkets offers customizations as per the client�s specific needs. The following customization options are available for this report:
Regional Analysis
Further breakdown of region-/country-specific analyses
Company Information
Detailed analyses and profiling of additional market players (up to five)
The global cooling tower rental market is expected to grow at a CAGR of 5.18%, from 2017 to 2022, to reach a projected USD 0.99 Billion by 2022. The growth will be mainly driven by rise in HVACR deployments and growth in industrial activities across globe.
The report segments the cooling towers rental market, on the basis of type, into wet, dry and hybrid. The wet segment led the cooling towers rental market in 2015. Wet cooling tower rental services are largely consumed for power generation by utilities and manufacturing facilities apart from other applications. Dry market is expected to grow most swiftly during the forecast period (2017 to 2022) mainly due to the increasing implementation of energy efficiency targets globally and growth of HVACR applications in the expanding commercial building and construction industry.
Global market, by design, is segmented into mechanical draft and natural draft of which Mechanical is the fastest growing segment. Manufacturing plants, commercial buildings, public buildings, and utilities mainly utilize cooling tower rentals for power generation application. Growing demand for global power requirement, especially in regions such as Europe, North America and Asia Pacific is contributing the demand growth for Mechanical draft cooling tower rentals.
The report further segments cooling towers rental market, by capacity which include up to 500 tons, 500-1,000 tons, 1,000-1,500 tons, 1,500-3,000 tons and above 3000 tons. The 1,000-1,500 ton capacity range cooling tower rental are expected to grow at the highest CAGR in the forecast period. This capacity range cooling towers are mostly rented for commercial, industrial or manufacturing facilities, indoor and outdoor applications, and high-temperature applications.
In terms of end-use, industrial segment hold the largest market share in the market. The industrial end-use segment has been further segmented into oil & gas, chemicals and petrochemicals, construction, food and beverage, metal & mining and utilities. Some of the processes and industries that use rental cooling include chemical, ethanol production, metals, mining, oil refining, textiles and steel production. Cooling towers play a significant role in various industries as they help overcome the issues of overheating of plants. Overheating may cause fire mishaps, breakdown of plants, and damage to machines. Cooling towers dissipate heat into the atmosphere through diffusion to prevent these concerns. Therefore, petroleum refineries, natural gas processing plants, petrochemical and chemical plants, nuclear power plants, and fossil-fuel power plants install these towers to prevent risks of accidents caused by overheating.
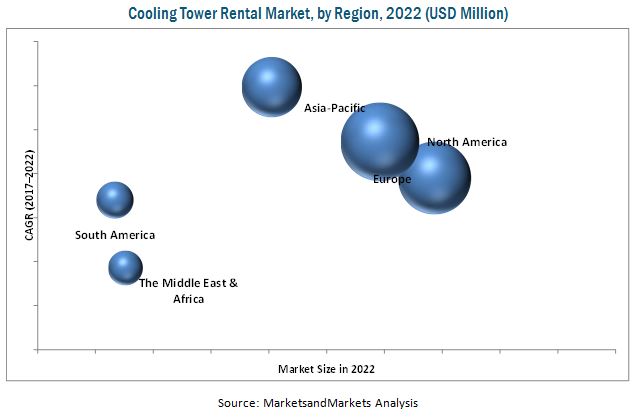
North America is projected to be the largest market for cooling tower rental due to its stringent environmental norms and increasing investments in major industries such as oil & gas, power utilities, metals and mining. This market is also expected to boost global market during the forecast period.
The major factor restraining the growth of the market is that it�s nature of being highly fragmented and stiff competition.
Some of the global players in this market include Aggreko, United rental, Sunbelt Rental, Caterpillar, Johnson Controls, Engie Refrigeration, together they hold a strong share of the global market.
To speak to our analyst for a discussion on the above findings, click Speak to Analyst
 Exclusive indicates content/data unique to MarketsandMarkets and not available with any competitors.
Table of Contents
1 Introduction (Page No. - 14)
1.1 Objectives of the Study
1.2 Market Definition
1.3 Markets Covered
1.4 Years Considered for the Study
1.5 Currency
1.6 Limitations
1.7 Stakeholders
2 Research Methodology (Page No. - 18)
2.1 Introduction
2.1.1 Secondary Data
2.1.1.1 Key Data From Secondary Sources
2.1.2 Primary Data
2.1.2.1 Key Data From Primary Sources
2.1.2.2 Key Industry Insights
2.1.2.3 Breakdown of Primaries
2.2 Market Size Estimation
2.3 Market Breakdown & Data Triangulation
2.4 Research Assumptions
3 Executive Summary (Page No. - 26)
4 Premium Insights (Page No. - 31)
4.1 Market Overview
4.2 Market, By Region
4.3 Market, By Design
4.4 Market, By Type
4.5 Market, By Capacity
5 Market Overview (Page No. - 34)
5.1 Introduction
5.1.1 Drivers
5.1.1.1 Rise in Hvacr Deployments and Growth in Industrial Activities
5.1.1.2 Economic Benefits of Rental Cooling Towers Over Purchased Cooling Towers
5.1.1.3 Need for Supplemental Cooling and Emergency Response
5.1.1.4 Stringent Environmental Regulations
5.1.2 Opportunities
5.1.2.1 Growth in the Nuclear Power Generation Industry
5.1.2.2 Increase in Adoption of Rental Cooling Towers in Refineries & Chemical Plants
5.1.2.3 Technological Advances in the Market
5.1.3 Restraints
5.1.3.1 Highly Fragmented and Competitive Industry
5.1.3.2 Influence of Oil Price Fluctuations on Oil-Dependent Sectors
5.1.3.3 Growing Focus on Renewable Energy
5.1.4 Challenges
5.1.4.1 Non-Availability of Technical Expertise for Complex Temperature-Control Issues
5.1.4.2 Need for Large Quantities of Water
6 Market, By Type (Page No. - 40)
6.1 Introduction
6.2 Wet
6.3 Dry
6.4 Hybrid
7 Market, By Design (Page No. - 45)
7.1 Introduction
7.2 Natural Draft
7.3 Mechanical Draft
8 Market, By Capacity (Page No. - 49)
8.1 Introduction
8.2 Up to 500 Tons
8.3 500 to 1000 Tons
8.4 1000 to 1500 Tons
8.5 1500 to 3000 Tons
8.6 Above 3000 Tons
9 Market, By End-User (Page No. - 55)
9.1 Introduction
9.2 Industrial
9.2.1 Oil & Gas
9.2.2 Chemicals & Petrochemicals
9.2.3 Construction
9.2.4 Food & Beverage
9.2.5 Others
9.3 Commercial
10 Market, By Region (Page No. - 62)
10.1 Introduction
10.2 North America
10.2.1 By Type
10.2.2 By Design
10.2.3 By Capacity
10.2.4 By End-User
10.2.5 By Country
10.2.5.1 US
10.2.5.2 Canada
10.2.5.3 Mexico
10.3 Europe
10.3.1 By Type
10.3.2 By Design
10.3.3 By Capacity
10.3.4 By End-User
10.3.5 France
10.3.6 By Country
10.3.6.1 UK
10.3.6.2 Germany
10.3.6.3 Sweden
10.3.6.4 Rest of Europe
10.4 Asia Pacific
10.4.1 By Type
10.4.2 By Design
10.4.3 By Capacity
10.4.4 By End-User
10.4.5 By Country
10.4.5.1 China
10.4.5.2 India
10.4.5.3 Japan
10.4.5.4 South Korea
10.4.5.5 Rest of Asia Pacific
10.5 South America
10.5.1 By Type
10.5.2 By Design
10.5.3 By Capacity
10.5.4 By End-User
10.5.5 By Country
10.5.5.1 Brazil
10.5.5.2 Argentina
10.5.5.3 Venezuela
10.5.5.4 Rest of South America
10.6 Middle East & Africa
10.6.1 By Type
10.6.2 By Design
10.6.3 By Capacity
10.6.4 By End-User
10.6.5 By Country
10.6.5.1 Saudi Arabia
10.6.5.2 UAE
10.6.5.3 South Africa
10.6.5.4 Rest of the Middle & Africa
11 Competitive Landscape (Page No. - 95)
11.1 Overview
11.2 Market Ranking Analysis
11.3 Competitive Situations & Trends
12 Company Profiles (Page No. - 99)
(Overview, Strength of Product Portfolio, Products Offered, Business Strategy Excellence & Recent Developments)*
12.1 Introduction
12.2 SPX Corporation
12.3 Aggreko
12.4 United Rentals
12.5 Caterpillar
12.6 Johnson Controls
12.7 Sunbelt Rentals
12.8 Carrier Rental Systems
12.9 Engie Refrigeration
12.10 Jacir
12.11 KTK K�hlturm
12.12 Cooling Tower Depot
12.13 Midwest Cooling Tower Services
12.14 Baltimore Aircoil Australia
12.15 Trane
12.16 ICS Cool Energy
*Details on Overview, Strength of Product Portfolio, Products Offered, Business Strategy Excellence & Recent Developments Might Not Be Captured in Case of Unlisted Companies.
13 Appendix (Page No. - 137)
13.1 Insights of Industry Experts
13.2 Discussion Guide
13.3 Knowledge Store: Marketsandmarkets� Subscription Portal
13.4 Introducing RT: Real-Time Market Intelligence
13.5 Available Customizations
13.6 Related Reports
13.7 Author Details
List of Tables (74 Tables)
Table 1 Global Market Snapshot
Table 2 Global Market Size, By Type, 2015�2022 (USD Million)
Table 3 Wet Market, By Region, 2015�2022 (USD Million)
Table 4 Dry Market, By Region, 2015�2022 (USD Million)
Table 5 Hybrid Market, By Region, 2015�2022 (USD Million)
Table 6 Global Market Size, By Design, 2015�2022 (USD Million)
Table 7 Natural Draft Market, By Region, 2015�2022 (USD Million)
Table 8 Mechanical Draft Market, By Region, 2015�2022 (USD Million)
Table 9 Global Market, By Capacity, 2015�2022 (USD Million)
Table 10 Upto 500 Tons Market, By Region, 2015�2022 (USD Million)
Table 11 500 to 1000 Tons Market, By Region, 2015�2022 (USD Million)
Table 12 1000 to 1500 Tons Market, By Region, 2015�2022 (USD Million)
Table 13 1500 to 3000 Tons Market, By Region, 2015�2022 (USD Million)
Table 14 Above 3000 Tons Market, By Region, 2015�2022 (USD Million)
Table 15 Global Market Size, By End-User, 2015�2022 (USD Million)
Table 16 Industrial Market Size, By End-User, 2015�2022 (USD Million)
Table 17 Oil & Gas Market Size, By Region, 2015�2022 (USD Million)
Table 18 Chemicals & Petrochemicals Market Size, By Region, 2015�2022 (USD Million)
Table 19 Construction Market Size, By Region, 2015�2022 (USD Million)
Table 20 Food & Beverage Market Size, By Region, 2015�2022 (USD Million)
Table 21 Others Market Size, By Region, 2015�2022 (USD Million)
Table 22 Commercial Market Size, By Region, 2015�2022 (USD Million)
Table 23 Market Size, By Region, 2015�2022 (USD Million)
Table 24 North America: Market Size, By Country, 2015�2022 (USD Million)
Table 25 North America: By Market Size, By Type, 2015�2022 (USD Million)
Table 26 North America: By Market Size, By Design, 2015�2022 (USD Million)
Table 27 North America: By Market Size, By Capacity, 2015�2022 (USD Million)
Table 28 North America: By Market Size, By End-User, 2015�2022 (USD Million)
Table 29 North America: Industrial Market Size, By End-User, 2015�2022 (USD Million)
Table 30 US: Market Size, By End-User, 2015�2022 (USD Million)
Table 31 Canada: Market Size, By End-User, 2015�2022 (USD Million)
Table 32 Mexico: Market Size, By End-User, 2015�2022 (USD Million)
Table 33 Europe: Market Size, By Country, 2015�2022 (USD Million)
Table 34 Europe: By Market Size, By Type, 2015�2022 (USD Million)
Table 35 Europe: By Market Size, By Design, 2015�2022 (USD Million)
Table 36 Europe: By Market Size, By Capacity, 2015�2022 (USD Million)
Table 37 Europe: By Market Size, By End-User, 2015�2022 (USD Million)
Table 38 Europe: Industrial Market Size, By End-User, 2015�2022 (USD Million)
Table 39 France: Market Size, By End-User, 2015�2022 (USD Million)
Table 40 UK: Market Size, By End-User, 2015�2022 (USD Million)
Table 41 Germany: Market Size, By End-User, 2015�2022 (USD Million)
Table 42 Sweden: Market Size, By End-User, 2015�2022 (USD Million)
Table 43 Rest of Europe: Market Size, By End-User, 2015�2022 (USD Million)
Table 44 Asia Pacific: Market Size, By Country, 2015�2022 (USD Million)
Table 45 Asia Pacific: By Market Size, By Type, 2015�2022 (USD Million)
Table 46 Asia Pacific: By Market Size, By Design, 2015�2022 (USD Million)
Table 47 Asia Pacific: By Market Size, By Capacity, 2015�2022 (USD Million)
Table 48 Asia Pacific: By Market Size, By End-User, 2015�2022 (USD Million)
Table 49 Asia Pacific: Industrial Market Size, By End-User, 2015�2022 (USD Million)
Table 50 China: Market Size, By End-User, 2015�2022 (USD Million)
Table 51 India: Market Size, By End-User, 2015�2022 (USD Million)
Table 52 Japan: Market Size, By End-User, 2015�2022 (USD Million)
Table 53 South Korea: Market Size, By End-User, 2015�2022 (USD Million)
Table 54 Rest of Asia Pacific: Market Size, By End-User, 2015�2022 (USD Million)
Table 55 South America: Market Size, By Country, 2015�2022 (USD Million)
Table 56 South America: By Market Size, By Type, 2015�2022 (USD Million)
Table 57 South America: By Market Size, By Design, 2015�2022 (USD Million)
Table 58 South America: By Market Size, By Capacity, 2015�2022 (USD Million)
Table 59 South America: By Market Size, By End-User, 2015�2022 (USD Million)
Table 60 South America: Industrial Market Size, By End-User, 2015�2022 (USD Million)
Table 61 Brazil: Market Size, By End-User, 2015�2022 (USD Million)
Table 62 Argentina: Market Size, By End-User, 2015�2022 (USD Million)
Table 63 Venezuela: Market Size, By End-User, 2015�2022 (USD Million)
Table 64 Rest of South America: Market Size, By End-User, 2015�2022 (USD Million)
Table 65 Middle East & Africa: Market Size, By Country, 2015�2022 (USD Million)
Table 66 Middle East & Africa: By Market Size, By Type, 2015�2022 (USD Million)
Table 67 Middle East & Africa: By Market Size, By Design, 2015�2022 (USD Million)
Table 68 Middle East & Africa: By Market Size, By Capacity, 2015�2022 (USD Million)
Table 69 Middle East & Africa: By Market Size, By End-User, 2015�2022 (USD Million)
Table 70 Middle East & Africa: Industrial Market Size, By End-User, 2015�2022 (USD Million)
Table 71 Saudi Arabia: Market Size, By End-User, 2015�2022 (USD Million)
Table 72 UAE: Market Size, By End-User, 2015�2022 (USD Million)
Table 73 South Africa: Market Size, By End-User, 2015�2022 (USD Million)
Table 74 Rest of the Middle East & Africa: Market Size, By End-User, 2015�2022 (USD Million)
List of Figures (38 Figures)
Figure 1 Markets Covered: Global Market
Figure 2 Regional Scope
Figure 3 Global Market: Research Design
Figure 4 Breakdown of Primary Interviews: By Company Type, Designation, & Region
Figure 5 Market Size Estimation Methodology: Bottom-Up Approach
Figure 6 Market Size Estimation Methodology: Top-Down Approach
Figure 7 Global Market: Market Estimation Approach & Data Triangulation Methodology
Figure 8 North America is Estimated to Hold the Largest Share of the Market in 2016
Figure 9 The Wet Segment is Expected to Dominate the Market During the Forecast Period
Figure 10 The Mechanical Draft Segment is Expected to Grow at the Highest CAGR During the Forecast Period
Figure 11 The 500�1000 Tons Capacity Segment is Expected to Dominate the Market During the Forecast Period
Figure 12 The Industrial Segment is Expected to Dominate the Market During the Forecast Period
Figure 13 Attractive Opportunities in the Market, 2017�2022
Figure 14 The Market in Asia Pacific is Expected to Grow at the Highest CAGR From 2017 to 2022
Figure 15 The Mechanical Segment is Expected to Lead During the Forecast Period
Figure 16 The Wet Subsegment is Expected to Dominate the Market in 2017
Figure 17 The 1000�1500 Tons Segment is Expected to Grow at the Highest CAGR From 2017 to 2022
Figure 18 Market Dynamics for the Market
Figure 19 Crude Oil Price Trend (June 2014�April 2017)
Figure 20 Global Market, By Type, 2017 & 2022 (USD Million)
Figure 21 Global Market, By Design, 2017 & 2022 (USD Million)
Figure 22 Global Market, By Capacity, 2017 & 2022 (USD Million)
Figure 23 Global Market, By End-User, 2017 & 2022 (USD Million)
Figure 24 Regional Snapshot: Market (2017 & 2022)
Figure 25 The North American Market is Expected to Be the Largest Market During the Forecast Period
Figure 26 North America: Market Snapshot
Figure 27 Europe: Market Snapshot
Figure 28 China is Estimated to Hold the Largest Share of the Market in 2017
Figure 29 Rest of the Middle East & Africa is Estimated to Hold the Largest Share of the Market, 2016
Figure 30 Key Developments in the Market, 2014�2017
Figure 31 Market Ranking for the Market, 2016
Figure 32 Battle for Market Share (2014�2017): New Product Developments Was the Key Strategy Adopted By the Players in the Market
Figure 33 Market Evaluation Framework, 2014�2017
Figure 34 SPX Corporation: Company Snapshot
Figure 35 Aggreko: Company Snapshot
Figure 36 United Rentals: Company Snapshot
Figure 37 Caterpillar: Company Snapshot
Figure 38 Johnson Controls: Company Snapshot


Growth opportunities and latent adjacency in Cooling Tower Rental Market