Coupling Agents Market by Type (Sulfur Silane, Vinyl Silane, Amino Silane, Epoxy Silane), Application (Rubber & Plastics, Fiber Treatment, Adhesives & Sealant, Paints & Coatings), and Region (North America, Europe, APAC) - Global Forecast to 2023


[136 Pages Report] Coupling agents are additives used to enhance the interfacial properties between two functionally dissimilar surfaces. They contain two or more functional groups which help to form adhesion bond between organic and inorganic surfaces. They function as surface modifiers and are an important part of the rubber & plastics sector, especially the tire industry.
The major applications of coupling agents include fiber treatment, adhesives & sealants, paints & coatings, and others. The use of coupling agents in the automotive, aerospace, and building & construction industries is expected to witness high growth rates in the next five years. The scope of the report includes only silane coupling agents.
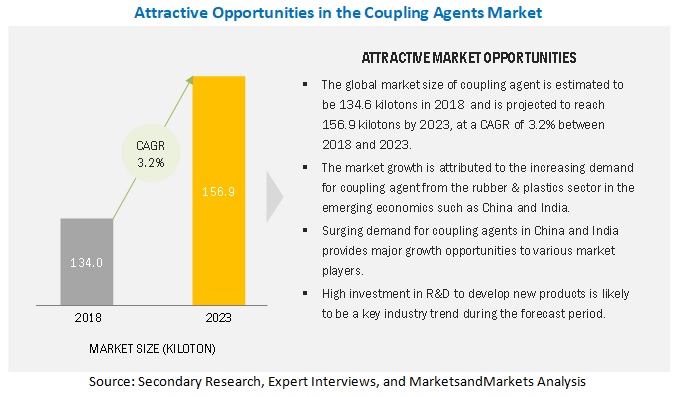
The coupling agent market is projected to reach USD 614.1 million by 2023 registering a CAGR of 3.5% between 2018 and 2023. APAC was the largest market for coupling agents in 2017. The global market size of coupling agents is estimated to be 134.6 kilotons in 2018 and is projected to reach 156.9 kilotons by 2023, at a CAGR of 3.2% between 2018 and 2023. The rising demand from the automotive and building & construction sectors in developing countries such as China and India are driving the market. North America and Europe have introduced stringent regulations for tire labeling and fuel efficiency which act as drivers for the green tires market. Also, the new trend of low VOC paints & coatings is now changing the focus of industry toward powder coatings.
Sulfur Silane Coupling agent to dominate the market
Sulfur silane is the largest type of coupling agent. The growth is attributed to its rising demand in various end-use industries.
Rubber & plastics application to dominate the coupling agents market during the forecast period
Rubber & plastics application dominated the coupling agent market due to the growing usage of green tires. The need for high fuel efficiency and better performance has raised the demand for green tires. These tires are made using the silica-silane technology and are easy to recycle or dispose of. In addition, regions such as North America and Europe have issued new norms about pollution and tire labeling. As per these norms, manufacturers have to mention the performance parameters of the tire on itslabel.
APAC to account for the largest market size during the forecast period
APAC accounted for the largest share of 34.5% in 2017 and is projected to register a CAGR of 5.6% between 2018 and 2023. The demand for coupling agent is expected to grow due to the developing automotive and industrial sectors. In APAC, China dominated the coupling agent market in 2017. However, the market is projected to register a higher CAGR in India and China, during the forecast period.

Market Dynamics
Driver: Growing initiatives on fuel efficiency and regulation compliance
The automotive manufacturers are focusing on increasing fuel efficiency and road safety. Use of the silica silane technology in tire manufacturing increases their performance. Depending on the requirements of OEMs, the use of coupling agents is increasing to reduce the rolling resistance and improve the traction on wet or slippery surfaces. The use of coupling agents in silica-reinforced green tires instead of traditional tires could improve fuel efficiency by 5%. It could save millions of barrels of fuel per year and could also reduce carbon dioxide emissions. Environmental Protection Agency (EPA) Greenhouse Gas (GHG) has projected the need for a standard, as the industry average of 163 g/mile of CO2 and fleet-wide basis, this is the same as 54.5 mpg (4.3 L/100km), from 2017 to 2025. The European Union (EU) has set the regulation on carbon dioxide emission from new cars to be lower than 96 grams/km by 2020.
November 2012 onwards, the EU regulation has mandated tire manufacturers to label all tire characteristics indicating energy efficiency in terms of fuel consumption and CO2 emission, wet grip, and noise emission level. The tires will be categorized according to the lowest to the highest standard from the red G category to the green A category, respectively. Cars equipped with category A tires consume 7.5% less fuel, have a stopping distance of approximately 18 meters shorter on a wet road, and have noise emission less than 69 dB.
Restraint: Decreasing demand for plastic packaging
The demand for environmentally friendly materials such as paper and jute is increasing in the packaging industry. This is decreasing the demand for plastics in the packaging industry. Consumers prefer paper and glass over plastics. Paper packaging that replaces plastic is most often a multi-layered material that includes metallic foil in addition to the paper. Coupling agents are mostly used in plastic packaging, and the ban on such packaging material will affect the market growth.
Opportunity: Rapidly expanding economies of APAC
APAC is experiencing radical growth, with China leading the market. Major economies in APAC, such as China, India, and Indonesia are seen as promising markets due to the increased focus of corresponding governments on infrastructure developments. In China, many projects such as renewable energy, airports, and residential buildings have received funding in a cycle of 12�15 years. Malaysia, following its Economic Transformation Plan 2011-20, has received a large amount of foreign direct investment in its building & construction sector. Therefore, these rapidly expanding economies are providing ample opportunities for industry players in APAC.
Challenge: High cost of production
Manufacturers need to come up with solutions to minimize the cost of production through the implementation of new technology or minimizing the cost of raw materials. Extensive R&D and innovations are needed to reduce the cost. Currently, the switching cost for coupling agents is very high, which makes it difficult to penetrate in the end-use industries. For example, in tire production, the application of silica silane technology was approximately 65% more costly than carbon black. Hence, the green tire produced using the silica silane technology contributes approximately 28 to 30% of the total tire industry. Although Dow Corning and Evonik Industries, the leading market players, are making continuous efforts to minimize the prices of coupling agents, they are still unable to overcome the challenge.
Scope of the Report
|
Report Metric |
Details |
|
Market size available for years |
2016 � 2023 |
|
Base year considered |
2017 |
|
Forecast period |
2018 � 2023 |
|
Forecast units |
Million/Billion (USD), Kilotons |
|
Segments covered |
Type, Application, and Region |
|
Geographies covered |
North America, Europe, APAC, RoW (South America, Middle East, and Africa) |
|
Companies covered |
Key market players, including |
The research report categorizes the Coupling Agents market to forecast the revenues and analyze the trends in each of the following sub-segments:
Coupling Agents Market, By Type
- Sulphur Silane
- Vinyl Silane
- Amino Silane
- Epoxy Silane
- Others
Coupling Agents Market, By Application
- Rubber & Plastics
- Fiber Treatment
- Paints & Coatings
- Adhesives & Sealants
- Others
Coupling Agents Market, By Region
- North America
- Europe
- APAC
- Middle East & Africa
- South America
Key Market Players
DowDuPont (US), Momentive Performance Materials (US), Evonik Industries (Germany), Wacker Chemie AG (Germany), Shin-Etsu Chemical Co., Ltd. (Japan), and China National BlueStar (Group) Co., Ltd (China).
Recent Developments
Date |
Company |
Description |
|
June 2018 |
Evonik |
Evonik expanded its production capacity of precipitated silica in Turkey. This will increase its capacity by 40,000 metric tons from 2020. This expansion is undertaken to meet the increasing demand for green tires and the raw material required to manufacture the tires. |
|
August 2017 |
Shin-Etsu Chemical Co. Ltd |
Shin-Etsu plans to expand its capacity for manufacturing silicones in the US. This will help meet the growing demand for functional silanes that are used as coupling agents in several applications. |
|
December 2016 |
Evonik |
A new production plant for precipitated silica is expected to be built in South Carolina. This decision is taken in order to cater to the tire industry, with sulfur silane and other silane coupling agents. |
|
October 2016 |
Shin-Etsu Chemical Co. Ltd |
With an investment of around USD 19 million, Shin-Etsu decided to expand its functional silane production capacity. This will help to produce a small number of various kinds of coupling agents to cater to the automobile and electronics sectors. |
|
October 2016 |
Shin-Etsu Chemical Co. Ltd |
Shin-Etsu established a new technical center in New Jersey, US. This will enable the company to meet the rising demand from local customers and also carry out research on new products and applications. |
Critical questions the report answers:
- What are the upcoming trends for the Coupling Agents market?
- Which segment provides the most opportunity for growth?
- Who are the leading vendors operating in this market?
- What are the opportunities for new market entrants?
To speak to our analyst for a discussion on the above findings, click Speak to Analyst
 Exclusive indicates content/data unique to MarketsandMarkets and not available with any competitors.
Table of Contents
1 Introduction (Page No. - 14)
1.1 Objectives of the Study
1.2 Market Definition
1.3 Market Scope
1.3.1 Years Considered for the Study
1.4 Currency
1.5 Unit Considered
1.6 Stakeholders
1.7 Limitations
2 Research Methodology (Page No. - 17)
2.1 Research Data
2.1.1 Secondary Data
2.1.1.1 Key Data From Secondary Sources
2.1.2 Primary Data
2.1.2.1 Key Data From Primary Sources
2.1.2.2 Key Industry Insights
2.1.2.3 Breakdown of Primary Interviews
2.2 Market Size Estimation
2.2.1 Bottom-Up Approach
2.2.2 Top-Down Approach
2.3 Data Triangulation
2.4 Assumptions
3 Executive Summary (Page No. - 25)
4 Premium Insights (Page No. - 28)
4.1 Significant Opportunities in the Coupling Agent Market
4.2 APAC Coupling Agent Market, By Application and Country
4.3 Coupling Agent Market, By Application and Region
4.4 Coupling Agent Market Attractiveness
5 Market Overview (Page No. - 31)
5.1 Introduction
5.2 Market Dynamics
5.2.1 Drivers
5.2.1.1 Growing Initiatives on Fuel Efficiency and Regulation Compliance
5.2.1.2 Increasing Demand From Automotive and Building & Construction Industries
5.2.2 Restraints
5.2.2.1 Decreasing Demand for Plastic Packaging
5.2.3 Opportunities
5.2.3.1 Emerging Applications in the Pharmaceutical and Cosmetics Industries
5.2.3.2 Rapidly Expanding Economies of APAC
5.2.4 Challenges
5.2.4.1 High Cost of Production
5.3 Porter�s Five Forces Analysis
5.3.1 Bargaining Power of Suppliers
5.3.2 Threat of New Entrants
5.3.3 Threat of Substitutes
5.3.4 Bargaining Power of Buyers
5.3.5 Intensity of Competitive Rivalry
5.4 Macroeconomic Overview and Key Trends
5.4.1 Introduction
5.4.2 Manufacturing Industry Trends, By Country
5.4.3 Automotive Industry Trends, By Country
5.4.3.1 Automotive Production Statistics
6 Coupling Agent Market, By Type (Page No. - 40)
6.1 Introduction
6.1.1 Sulfur Silane Coupling Agent
6.1.2 Vinyl Silane Coupling Agent
6.1.3 Amino Silane Coupling Agent
6.1.4 Epoxy Silane Coupling Agent
6.1.5 Others
7 Coupling Agent Market, By Application (Page No. - 50)
7.1 Introduction
7.2 Rubber & Plastics
7.3 Fiber Treatment
7.4 Adhesives & Sealants
7.5 Paints & Coatings
7.6 Others
8 Coupling Agent Market, By Region (Page No. - 60)
8.1 Introduction
8.2 North America
8.2.1 US
8.2.2 Canada
8.2.3 Mexico
8.3 Europe
8.3.1 Germany
8.3.2 UK
8.3.3 Italy
8.3.4 France
8.4 APAC
8.4.1 China
8.4.2 Japan
8.4.3 South Korea
8.4.4 India
8.5 South America
8.5.1 Brazil
8.5.2 Argentina
8.6 Middle East & Africa
8.6.1 Saudi Arabia
8.6.2 UAE
9 Competitive Landscape (Page No. - 93)
9.1 Overview
9.2 Market Ranking
9.3 Competitive Scenario
9.3.1 Expansions
9.3.2 Mergers & Acquisitions
9.3.3 New Product Launches
9.3.4 Agreements & Collaborations
10 Company Profiles (Page No. - 99)
(Business Overview, Products Offered, Recent Developments, SWOT Analysis, MnM View)*
10.1 Evonik Industries
10.2 Shin-Etsu Chemical Co. Ltd.
10.3 Momentive Performance Materials Holdings LLC
10.4 Dowdupont
10.5 Wacker Chemie AG
10.6 Gelest Inc.
10.7 WD Silicone Company Limited
10.8 Jingzhou Jianghan Fine Chemical Company Limited
10.9 Nanjing Union Silicon Chemical Co. Ltd.
10.10 Nanjing Shuguang Chemical Group Company Limited
10.11 China National Bluestar (Group) Co, Ltd.
*Details on Business Overview, Products Offered, Recent Developments, SWOT Analysis, MnM View Might Not Be Captured in Case of Unlisted Companies.
11 Appendix (Page No. - 120)
11.1 Insights From Industry Experts
11.2 Discussion Guide
11.3 Knowledge Store: Marketsandmarkets� Subscription Portal
11.4 Available Customizations
11.5 Related Reports
11.6 Author Details
List of Tables (92 Tables)
Table 1 Contribution of Manufacturing Industry to GDP, By Country, Percent of GDP (2015�2017)
Table 2 Automotive Production Statistics, 2015�2017 (Unit)
Table 3 Coupling Agent Market Size, By Type, 2016�2023 (Kiloton)
Table 4 Coupling Agent Market Size, By Type, 2016�2023 (USD Million)
Table 5 Sulfur Silane Coupling Agent Market Size, By Region, 2016�2023 (Kiloton)
Table 6 Sulfur Silane Coupling Agent Market Size, By Region, 2016�2023 (USD Million)
Table 7 Vinyl Silane Coupling Agent Market Size, By Region, 2016�2023 (Kiloton)
Table 8 Vinyl Silane Coupling Agent Market Size, By Region, 2016�2023 (USD Million)
Table 9 Amino Silane Coupling Agent Market Size, By Region, 2016�2023 (Kiloton)
Table 10 Amino Silane Coupling Agent Market Size, By Region, 2016�2023 (USD Million)
Table 11 Epoxy Silane Coupling Agent Market Size, By Region, 2016�2023 (Kiloton)
Table 12 Epoxy Silane Coupling Agent Market Size, By Region, 2016�2023 (USD Million)
Table 13 Other Coupling Agent Market Size, By Region, 2016�2023 (Kiloton)
Table 14 Other Coupling Agent Market Size, By Region, 2016�2023 (USD Million)
Table 15 Coupling Agent Market Size, By Application, 2016�2023 (Kiloton)
Table 16 By Market Size, By Application, 2016�2023 (USD Million)
Table 17 By Market Size in Rubber & Plastics Application, By Region, 2016�2023 (Kiloton)
Table 18 By Market Size in Rubber & Plastics Application, By Region, 2016�2023 (USD Million)
Table 19 By Market Size in Fiber Treatment Application, By Region, 2016�2023 (Kiloton)
Table 20 By Market Size in Fiber Treatment Application, By Region, 2016�2023 (USD Million)
Table 21 By Market Size in Adhesives & Sealants Application, By Region, 2016�2023 (Kiloton)
Table 22 By Market Size in Adhesives & Sealants Application, By Region, 2016�2023 (USD Million)
Table 23 By Market Size in Paints & Coatings Application, By Region, 2016�2023 (Kiloton)
Table 24 By Market Size in Paints & Coatings Application, By Region, 2016�2023 (USD Million)
Table 25 By Market Size in Other Applications, By Region, 2016�2023 (Kiloton)
Table 26 By Market Size in Other Applications, By Region, 2016�2023 (USD Million)
Table 27 By Market Size, By Region, 2016�2023 (Kiloton)
Table 28 By Market Size, By Region, 2016-2023 (USD Million)
Table 29 North America: By Market Size, By Country, 2016�2023 (Kiloton)
Table 30 North America: By Market Size, By Country, 2016�2023 (USD Million)
Table 31 North America: By Market Size, By Application, 2016�2023 (Kiloton)
Table 32 North America: By Market Size, By Application, 2016�2023 (USD Million)
Table 33 North America: By Market Size, By Type, 2016�2023 (Kiloton)
Table 34 North America: By Market Size, By Type, 2016�2023 (USD Million)
Table 35 US: By Market Size, By Application, 2016�2023 (Kiloton)
Table 36 US: By Market Size, By Application, 2016�2023 (USD Million)
Table 37 Canada: By Market Size, By Application, 2016�2023 (Kiloton)
Table 38 Canada: By Market Size, By Application, 2016�2023 (USD Million)
Table 39 Mexico: By Market Size, By Application, 2016�2023 (Kiloton)
Table 40 Mexico: By Market Size, By Application, 2016�2023 (USD Million)
Table 41 Europe: By Market Size, By Country, 2016�2023 (Kiloton)
Table 42 Europe: By Market Size, By Country, 2016�2023 (USD Million)
Table 43 Europe: By Market Size, By Application, 2016�2023 (Kiloton)
Table 44 Europe: By Market Size, By Application, 2016�2023 (USD Million)
Table 45 Europe: By Market Size, By Type, 2016�2023 (Kiloton)
Table 46 Europe: By Market Size, By Type, 2016�2023 (USD Million)
Table 47 Germany: By Market Size, By Application, 2016�2023 (Kiloton)
Table 48 Germany: By Market Size, By Application, 2016�2023 (USD Million)
Table 49 UK: By Market Size, By Application, 2016�2023 (Kiloton)
Table 50 UK: By Market Size, By Application, 2016�2023 (USD Million)
Table 51 Italy: By Market Size, By Application, 2016�2023 (Kiloton)
Table 52 Italy: By Market Size, By Application, 2016�2023 (USD Million)
Table 53 France: By Market Size, By Application, 2016�2023 (Kiloton)
Table 54 France: By Market Size, By Application, 2016�2023 (USD Million)
Table 55 APAC: By Market Size, By Country, 2016�2023 (Kiloton)
Table 56 APAC: By Market Size, By Country, 2016�2023 (USD Million)
Table 57 APAC: By Market Size, By Application, 2016�2023 (Kiloton)
Table 58 APAC: By Market Size, By Application, 2016�2023 (USD Million)
Table 59 APAC: By Market Size, By Type, 2016�2023 (Kiloton)
Table 60 APAC: By Market Size, By Type, 2016�2023 (USD Million)
Table 61 China: By Market Size, By Application, 2016�2023 (Kiloton)
Table 62 China: By Market Size, By Application, 2016�2023 (USD Million)
Table 63 Japan: By Market Size, By Application, 2016�2023 (Kiloton)
Table 64 Japan: By Market Size, By Application, 2016�2023 (USD Million)
Table 65 South Korea: By Market Size, By Application, 2016�2023 (Kiloton)
Table 66 South Korea: By Market Size, By Application, 2016�2023 (USD Million)
Table 67 India: By Market Size, By Application, 2016�2023 (Kiloton)
Table 68 India: By Market Size, By Application, 2016�2023 (USD Million)
Table 69 South America: By Market Size, By Country, 2016�2023 (Kiloton)
Table 70 South America: By Market Size, By Country, 2016�2023 (USD Million)
Table 71 South America: By Market Size, By Application, 2016�2023 (Kiloton)
Table 72 South America: By Market Size, By Application, 2016�2023 (USD Million)
Table 73 South America: By Market Size, By Type, 2016�2023 (Kiloton)
Table 74 South America: By Market Size, By Type, 2016�2023 (USD Million)
Table 75 Brazil: By Market Size, By Application, 2016�2023 (Kiloton)
Table 76 Brazil: By Market Size, By Application, 2016�2023 (USD Million)
Table 77 Argentina: By Market Size, By Application, 2016�2023 (Kiloton)
Table 78 Argentina: By Market Size, By Application, 2016�2023 (USD Million)
Table 79 Middle East & Africa: By Market Size, By Country, 2016�2023 (Kiloton)
Table 80 Middle East & Africa: By Market Size, By Country, 2016�2023 (USD Million)
Table 81 Middle East & Africa: By Market Size, By Application, 2016�2023 (Kiloton)
Table 82 Middle East & Africa: By Market Size, By Application, 2016�2023 (USD Million)
Table 83 Middle East & Africa: By Market Size, By Type, 2016�2023 (Kiloton)
Table 84 Middle East & Africa: By Market Size, By Type, 2016�2023 (USD Million)
Table 85 Saudi Arabia: By Market Size, By Application, 2016�2023 (Kiloton)
Table 86 Saudi Arabia: By Market Size, By Application, 2016�2023 (USD Million)
Table 87 UAE: By Market Size, By Application, 2016�2023 (Kiloton)
Table 88 UAE: By Market Size, By Application, 2016�2023 (USD Million)
Table 89 Expansions, 2014�2018
Table 90 Mergers & Acquisitions, 2014�2018
Table 91 New Product Launches, 2014�2018
Table 92 Agreements & Collaborations, 2014�2018
List of Figures (37 Figures)
Figure 1 Coupling Agent Market Segmentation
Figure 2 Coupling Agent Market: Research Design
Figure 3 Market Size Estimation Methodology: Bottom-Up Approach
Figure 4 Market Size Estimation Methodology: Top-Down Approach
Figure 5 Coupling Agent Market: Data Triangulation
Figure 6 Sulfur Silane Coupling Agent to Dominate the Market
Figure 7 Rubber & Plastics Application to Be the Largest Application of Coupling Agents
Figure 8 APAC to Be the Largest Coupling Agent Market During the Forecast Period
Figure 9 High Market Growth is Expected During the Forecast Period
Figure 10 China Accounted for the Largest Share of the APAC Coupling Agent Market in 2017
Figure 11 Rubber & Plastics Application to Drive the Market During the Forecast Period
Figure 12 APAC to Be the Fastest-Growing Market During the Forecast Period
Figure 13 Overview of Factors Driving the Coupling Agent Market
Figure 14 Coupling Agent Market: Porter�s Five Forces Analysis
Figure 15 Contribution of Manufacturing Industry to GDP, 2017
Figure 16 Sulfur Silane Accounted for the Largest Share of the Coupling Agent Market in 2017
Figure 17 APAC to Be the Largest Sulfur Silane Coupling Agent Market During the Forecast Period
Figure 18 APAC to Be the Largest Vinyl Silane Coupling Agent Market During the Forecast Period
Figure 19 APAC to Register the Highest CAGR in the Amino Silane Segment of the Coupling Agent Market
Figure 20 APAC to Be the Largest Epoxy Silane Coupling Agent Market
Figure 21 APAC to Register the Highest CAGR in the Other Coupling Agent Market
Figure 22 Rubber & Plastics to Be the Largest Application of Coupling Agents
Figure 23 APAC to Lead the Coupling Agent Market in the Rubber & Plastics Application
Figure 24 APAC to Lead the Coupling Agent Market in the Fiber Treatment Application
Figure 25 APAC to Lead the Coupling Agent Market in the Adhesives & Sealants Application
Figure 26 APAC to Be the Fastest-Growing Coupling Agent Market in the Paints & Coatings Application
Figure 27 APAC to Be the Largest Coupling Agent Market in Other Applications
Figure 28 North America: Coupling Agent Market Snapshot
Figure 29 Europe: Coupling Agent Market Snapshot
Figure 30 APAC: Coupling Agent Market Snapshot
Figure 31 Companies Adopted Expansion as the Key Growth Strategy Between 2014 and 2018
Figure 32 Ranking of Key Coupling Agent Manufacturers for Passenger Cars, 2017
Figure 33 Evonik Industries: Company Snapshot
Figure 34 Shin-Etsu Chemical Co. Ltd.: Company Snapshot
Figure 35 Momentive Performance Materials Holdings LLC: Company Snapshot
Figure 36 Dowdupont: Company Snapshot
Figure 37 Wacker Chemie AG: Company Snapshot


Growth opportunities and latent adjacency in Coupling Agents Market