Crawler Camera System Market by Component (Hardware, Software, Service), Application (Drain Inspection; Pipeline Inspection; Tank, Void, and Cavity/Conduit Inspection), Vertical (Residential, Municipal, Industrial), and Region - Global Forecast to 2036


 Exclusive indicates content/data unique to MarketsandMarkets and not available with any competitors.
Table of Contents
1 Introduction (Page No. - 16)
1.1 Study Objectives
1.2 Definition and Scope
1.2.1 Inclusions and Exclusions
1.3 Study Scope
1.3.1 Markets Covered
1.3.2 Regional Scope
1.3.3 Years Considered
1.4 Currency
1.5 Stakeholders
2 Research Methodology (Page No. - 20)
2.1 Research Data
2.1.1 Secondary Data
2.1.1.1 Key Data From Secondary Sources
2.1.2 Primary Data
2.1.2.1 Breakdown of Primaries
2.1.2.2 Key Data From Primary Sources
2.1.3 Secondary and Primary Research
2.2 Market Size Estimation
2.2.1 Bottom-Up Approach
2.2.1.1 Approach Used to Arrive at Market Share By Bottom-Up Analysis (Demand Side)
2.2.1.2 Approach for Capturing Company-Specific Information in Crawler Camera System Value Chain
2.2.2 Top-Down Approach
2.2.2.1 Approach Used to Arrive at Market Size By Top-Down Analysis (Supply Side)
2.3 Market Breakdown and Data Triangulation
2.4 Research Assumptions
3 Executive Summary (Page No. - 29)
4 Premium Insights (Page No. - 32)
4.1 Attractive Growth Opportunities in Market
4.2 Market, By Application
4.3 Market in APAC, By Application and Country
4.4 Market in North America, By Vertical
4.5 Market, By Region
5 Market Overview (Page No. - 35)
5.1 Introduction
5.2 Market Dynamics: Crawler Camera System Market
5.2.1 Drivers
5.2.1.1 Rising Demand From Municipal and Residential Applications
5.2.1.2 Increasing Government Mandates and Regulations for Pipeline Assessment
5.2.1.3 Growing Demand for Advanced Inspection Systems for Underwater Operations
5.2.1.4 Growing Demand for Sewer Inspection Systems
5.2.2 Restraints
5.2.2.1 Fast Battery Drainage of Crawler Camera Systems
5.2.3 Opportunities
5.2.3.1 Introduction of Magnetic Crawlers
5.2.3.2 Big Data Analytics Would Increase the Scope of Pipeline Monitoring Systems
5.2.3.3 Increasing Demand for Pipeline Monitoring Solutions Due to Enhanced Pipeline Infrastructure
5.2.4 Challenges
5.2.4.1 More Time Required for Data Analytics
6 Crawler Camera System Market, By Component (Page No. - 40)
6.1 Introduction
6.2 Hardware
6.2.1 Cameras
6.2.1.1 Market for Cameras to Grow at Highest CAGR in APAC
6.2.2 Crawlers
6.2.2.1 North America is Expected to Lead Crawlers Market During Forecast Period
6.2.3 Cable Drums
6.2.3.1 Cable Drums are Responsible for the Movement of Crawler Camera Systems
6.2.4 Control Units
6.2.4.1 Control Units are Responsible for Safety of Crawler Camera Systems
6.2.5 Others
6.2.5.1 Use of Other Components in Crawler Camera Systems Varies According to Application Requirements
6.3 Software
6.3.1 Software are Responsible for Data Gathering and Report Generation in Crawler Camera Systems
6.4 Services
6.4.1 APAC Crawler Camera System Services Market to Grow at Highest CAGR During Forecast Period
7 Market, By Application (Page No. - 47)
7.1 Introduction
7.2 Drain Inspection
7.2.1 North America to Lead Market for Drain Inspection During Forecast Period
7.3 Pipeline Inspection
7.3.1 Market for Pipeline Inspection in APAC to Grow at Highest CAGR During Forecast Period
7.4 Tank, Void, and Cavity/Conduit Inspection
7.4.1 Market for Tank, Void, and Cavity/Conduit Inspection to Grow at Highest CAGR in US During Forecast Period
8 Market, By Vertical (Page No. - 55)
8.1 Introduction
8.2 Residential
8.2.1 Residential Segment to Grow Owing to Increasing Use of Crawler Camera Systems in Water Management Sector Across the World
8.3 Municipal
8.3.1 Municipal Vertical to Witness Highest Growth in APAC Due to Ongoing Infrastructural Developments in the Pipeline Industry in This Region
8.4 Industrial
8.4.1 North America to Dominate Market for Industrial Vertical During Forecast Period
8.5 Commercial
8.5.1 Market for Commercial Vertical to Witness Highest Growth in APAC
9 Geographic Analysis (Page No. - 65)
9.1 Introduction
9.2 North America
9.2.1 US
9.2.1.1 Market in North America Will Be Dominated By US During Forecast Period
9.2.2 Canada
9.2.2.1 Growing Awareness About Use of Crawler Cameras for Pipeline Inspection is Expected to Drive Market in Canada
9.2.3 Mexico
9.2.3.1 Increase in Pipeline Projects in Mexico Will Drive Market During Forecast Period
9.3 Europe
9.3.1 UK
9.3.1.1 Increasing Production of Oil & Gas Will Drive Market in UK
9.3.2 Germany
9.3.2.1 German Market for Crawler Camera System Will Witness High Growth Owing to Increasing Concerns Over Safety of Pipelines and Energy Infrastructure
9.3.3 France
9.3.3.1 Growing Demand for Sewer Inspection Will Boost Market in France
9.3.4 Spain
9.3.4.1 Rising Demand From Municipal and Residential Verticals for Inspection of Pipes Will Boost Market in Spain
9.3.5 Rest of Europe
9.4 APAC
9.4.1 China
9.4.1.1 China to Hold Largest Share of Market in APAC
9.4.2 Japan
9.4.2.1 Market in Japan to Grow at Highest CAGR Among APAC Countries During Forecast Period
9.4.3 South Korea
9.4.3.1 Requirement of Crawler Camera for Pipeline and Sewer Line Inspection Will Help the Market to Grow in South Korea
9.4.4 Australia
9.4.4.1 Increasing Investment Opportunities and Government Policies in Energy Sector Will Drive Australian Market
9.4.5 Rest of APAC
9.5 RoW
9.5.1 Middle East
9.5.1.1 Rising Environmental Concerns and Increasing Export Activities Will Boost Market in Middle East
9.5.2 Africa
9.5.2.1 Growing Number of Pipeline Projects in Africa Will Drive African Market
9.5.3 South America
9.5.3.1 Growing Number of Pipelines in South America Will Boost Market in the Region
10 Competitive Landscape (Page No. - 94)
10.1 Overview
10.2 Ranking Analysis of Key Players in Crawler Camera System Market
10.3 Competitive Situations and Trends
10.3.1 Product Developments
10.3.2 Contracts
10.3.3 Partnerships
10.3.4 Acquisitions
10.4 Competitive Leadership Mapping, 2019
10.4.1 Visionary Leaders
10.4.2 Dynamic Differentiators
10.4.3 Innovators
10.4.4 Emerging Companies
11 Company Profiles (Page No. - 100)
(Business Overview, Products Offered, Recent Developments, SWOT Analysis, and MnM View)*
11.1 Key Players
11.1.1 Cues Inc. (Acquired By Spx Corporation)
11.1.2 Deep Trekker
11.1.3 Eddyfi
11.1.4 Mini-Cam (A Halma Group Company)
11.1.5 IPEK International (An Idex Group Company)
11.1.6 ULC Robotics
11.1.7 Ratech Electronics
11.1.8 Envirosight
11.1.9 Rausch Electronics USA
11.1.10 Insight | Vision
11.2 Right to Win
11.3 Other Players
11.3.1 Riezler Inspection Systems
11.3.2 NDT Technologies (P) Limited
11.3.3 Scanprobe
11.3.4 Subsite Electronics (The Charles Machine Works Company)
11.3.5 Am Industrial Group
11.4 Key Innovators
11.4.1 Source One Environmental (Fernco Company)
11.4.2 Crawler Pipeline Services
11.4.3 Laveer Engineering
11.4.4 Ac-Cess
11.4.5 Spectis Robotics
*Details on Business Overview, Products Offered, Recent Developments, SWOT Analysis, and MnM View Might Not Be Captured in Case of Unlisted Companies.
12 Appendix (Page No. - 125)
12.1 Insights From Industry Experts
12.2 Discussion Guide
12.3 Knowledge Store: Marketsandmarkets’ Subscription Portal
12.4 Available Customizations
12.5 Related Reports
12.6 Author Details
List of Tables (105 Tables)
Table 1 Crawler Camera System Market, By Component, 2017–2025 (USD Million)
Table 2 Crawler Camera System Hardware Market, 2017–2025 (USD Million)
Table 3 Crawler Camera System Hardware Market, By Region, 2017–2025 (USD Million)
Table 4 Cameras Market, By Region, 2017–2025 (USD Thousand)
Table 5 Crawlers Market, By Region, 2017–2025 (USD Thousand)
Table 6 Cable Drums Market, By Region, 2017–2025 (USD Thousand)
Table 7 Control Units Market, By Region, 2017–2025 (USD Thousand)
Table 8 Other Hardware Components Market, By Region, 2017–2025 (USD Thousand)
Table 9 Crawler Camera System Software Market, By Region, 2017–2025 (USD Million)
Table 10 Crawler Camera System Services Market, By Region, 2017–2025 (USD Million)
Table 11 Crawler Camera System Market, By Application, 2017–2025 (USD Million)
Table 12 Market for Drain Inspection, By Region, 2017–2025 (USD Million)
Table 13 Market for Drain Inspection in North America, By Country, 2017–2025 (USD Thousand)
Table 14 Market for Drain Inspection in Europe, By Country, 2017–2025 (USD Thousand)
Table 15 Market for Drain Inspection in APAC, By Country, 2017–2025 (USD Thousand)
Table 16 Market for Drain Inspection in RoW, By Region, 2017–2025 (USD Thousand)
Table 17 Market for Pipeline Inspection, By Region, 2017–2025 (USD Million)
Table 18 Market for Pipeline Inspection in North America, By Country, 2017–2025 (USD Thousand)
Table 19 Market for Pipeline Inspection in Europe, By Country, 2017–2025 (USD Thousand)
Table 20 Market for Pipeline Inspection in APAC, By Country, 2017–2025 (USD Thousand)
Table 21 Market for Pipeline Inspection, By Region, 2017–2025 (USD Thousand)
Table 22 Market for Tank, Void, and Cavity/Conduit Inspection, By Region, 2017–2025 (USD Million)
Table 23 Market for Tank, Void, and Cavity/Conduit Inspection in North America, By Country, 2017–2025 (USD Thousand)
Table 24 Market for Tank, Void, and Cavity/Conduit Inspection in Europe, By Country, 2017–2025 (USD Thousand)
Table 25 Market for Tank, Void, and Cavity/Conduit Inspection in APAC, By Country, 2017–2025 (USD Thousand)
Table 26 Market for Tank, Void, and Cavity/Conduit Inspection in RoW, By Region, 2017–2025 (USD Thousand)
Table 27 Market, By Vertical, 2017–2025 (USD Million)
Table 28 Crawler Camera System Market for Residential Vertical, By Region, 2017–2025 (USD Thousand)
Table 29 Market for Residential Vertical in North America, By Country, 2017–2025 (USD Thousand)
Table 30 Market for Residential Vertical in Europe, By Country, 2017–2025 (USD Thousand)
Table 31 Market for Residential Vertical in APAC, By Country, 2017–2025 (USD Thousand)
Table 32 Market for Residential Vertical in RoW, By Region, 2017–2025 (USD Thousand)
Table 33 Market for Municipal Vertical, By Region, 2017–2025 (USD Thousand)
Table 34 Market for Municipal Vertical in North America, By Country, 2017–2025 (USD Thousand)
Table 35 Market for Municipal Vertical in Europe, By Country, 2017–2025 (USD Thousand)
Table 36 Market for Municipal Vertical in APAC, By Country, 2017–2025 (USD Thousand)
Table 37 Market for Municipal Vertical in RoW, By Region, 2017–2025 (USD Thousand)
Table 38 Market for Industrial Vertical, By Region, 2017–2025 (USD Thousand)
Table 39 Market for Industrial Vertical in North America, By Country, 2017–2025 (USD Thousand)
Table 40 Market for Industrial Vertical in Europe, By Country, 2017–2025 (USD Thousand)
Table 41 Market for Industrial Vertical in APAC, By Country, 2017–2025 (USD Thousand)
Table 42 Market for Industrial Vertical in RoW, By Region, 2017–2025 (USD Thousand)
Table 43 Market for Commercial Vertical, By Region, 2017–2025 (USD Thousand)
Table 44 Market for Commercial Vertical in North America, By Country, 2017–2025 (USD Thousand)
Table 45 Market for Commercial Vertical in Europe, By Country, 2017–2025 (USD Thousand)
Table 46 Market for Commercial Vertical in APAC, By Country, 2017–2025 (USD Thousand)
Table 47 Market for Commercial Vertical in RoW, By Region, 2017–2025 (USD Thousand)
Table 48 Crawler Camera System Market, By Region, 2017–2025 (USD Million)
Table 49 Crawler Camera System Market in North America, By Country, 2017–2025 (USD Million)
Table 50 Market in North America, By Component, 2017–2025 (USD Million)
Table 51 Market in North America, By Hardware Component, 2017–2025 (USD Thousand)
Table 52 Market in North America, By Application, 2017–2025 (USD Million)
Table 53 Market in North America, By Vertical, 2017–2025 (USD Million)
Table 54 Market in US, By Application, 2017–2025 (USD Thousand)
Table 55 Market in US, By Vertical, 2017–2025 (USD Thousand)
Table 56 Market in Canada, By Application, 2017–2025 (USD Thousand)
Table 57 Market in Canada, By Vertical, 2017–2025 (USD Thousand)
Table 58 Market in Mexico, By Application, 2017–2025 (USD Thousand)
Table 59 Market in Mexico, By Vertical, 2017–2025 (USD Thousand)
Table 60 Market in Europe, By Country, 2017–2025 (USD Thousand)
Table 61 Market in Europe, By Component, 2017–2025 (USD Million)
Table 62 Market in Europe, By Hardware Component, 2017–2025 (USD Thousand)
Table 63 Market in Europe, By Application, 2017–2025 (USD Million)
Table 64 Market in Europe, By Vertical, 2017–2025 (USD Million)
Table 65 Market in UK, By Application, 2017–2025 (USD Thousand)
Table 66 Market in UK, By Vertical, 2017–2025 (USD Thousand)
Table 67 Market in Germany, By Application, 2017–2025 (USD Thousand)
Table 68 Market in Germany, By Vertical, 2017–2025 (USD Thousand)
Table 69 Market in France, By Application, 2017–2025 (USD Thousand)
Table 70 Market in France, By Vertical, 2017–2025 (USD Thousand)
Table 71 Market in Spain, By Application, 2017–2025 (USD Thousand)
Table 72 Market in Spain, By Vertical, 2017–2025 (USD Thousand)
Table 73 Market in Rest of Europe, By Application, 2017–2025 (USD Thousand)
Table 74 Market in Rest of Europe, By Vertical, 2017–2025 (USD Thousand)
Table 75 Market in APAC, By Country, 2017–2025 (USD Thousand)
Table 76 Market in APAC, By Component, 2017–2025 (USD Thousand)
Table 77 Market in APAC, By Hardware Component, 2017–2025 (USD Thousand)
Table 78 Market in APAC, By Application, 2017–2025 (USD Million)
Table 79 Market in APAC, By Vertical, 2017–2025 (USD Million)
Table 80 Market in China, By Application, 2017–2025 (USD Thousand)
Table 81 Market in China, By Vertical, 2017–2025 (USD Thousand)
Table 82 Market in Japan, By Application, 2017–2025 (USD Thousand)
Table 83 Market in Japan, By Vertical, 2017–2025 (USD Thousand)
Table 84 Market in South Korea, By Application, 2017–2025 (USD Thousand)
Table 85 Market in South Korea, By Vertical, 2017–2025 (USD Thousand)
Table 86 Market in Australia, By Application, 2017–2025 (USD Thousand)
Table 87 Market in Australia, By Vertical, 2017–2025 (USD Thousand)
Table 88 Market in Rest of APAC, By Application, 2017–2025 (USD Thousand)
Table 89 Market in Rest of APAC, By Vertical, 2017–2025 (USD Thousand)
Table 90 Market in RoW, By Region, 2017–2025 (USD Thousand)
Table 91 Market in RoW, By Component, 2017–2025 (USD Thousand)
Table 92 Market in RoW, By Hardware Component, 2017–2025 (USD Thousand)
Table 93 Market in RoW, By Application, 2017–2025 (USD Thousand)
Table 94 Market in RoW, By Vertical, 2017–2025 (USD Million)
Table 95 Market in Middle East, By Application, 2017–2025 (USD Thousand)
Table 96 Market in Middle East, By Vertical, 2017–2025 (USD Thousand)
Table 97 Market in Africa, By Application, 2017–2025 (USD Thousand)
Table 98 Market in Africa, By Vertical, 2017–2025 (USD Thousand)
Table 99 Market in South America, By Application, 2017–2025 (USD Thousand)
Table 100 Market in South America, By Vertical, 2017–2025 (USD Thousand)
Table 101 Crawler Camera System Market: Ranking of Key Companies
Table 102 Product Developments, 2016–2019
Table 103 Contracts, 2017–2019
Table 104 Partnerships, 2018–2019
Table 105 Acquisitions, 2016–2019
List of Figures (33 Figures)
Figure 1 Market Segmentation
Figure 2 Crawler Camera Market: Research Design
Figure 3 Market Size Estimation Methodology: Bottom-Up Approach
Figure 4 Market Size Estimation Methodology: Top-Down Approach
Figure 5 Data Triangulation Methodology
Figure 6 Services to Capture Largest Market Share During Forecast Period
Figure 7 Cameras to Dominate Crawler Camera System Hardware Market During Forecast Period
Figure 8 Municipal Vertical to Hold Largest Market Share in 2020
Figure 9 North America Accounted for Largest Share of Market in 2019
Figure 10 Increasing Demand From Municipal and Residential Applications Drives Market
Figure 11 Pipeline Inspection to Dominate Market During Forecast Period
Figure 12 Pipeline Inspection to Account for Largest Share of Market in APAC By 2025
Figure 13 Residential Segment to Witness Highest CAGR in North American Market From 2020 to 2025
Figure 14 APAC Market to Witness Highest CAGR During Forecast Period
Figure 15 Market: Drivers, Restraints, Opportunities, and Challenges
Figure 16 Impact Analysis: Drivers
Figure 17 Crawler Camera System Market, By Component
Figure 18 Services to Hold Largest Share of Market in 2020
Figure 19 Market, By Application
Figure 20 Pipeline Inspection to Hold Largest Share of Market in 2020
Figure 21 Market, By Vertical
Figure 22 Municipal Segment to Hold Largest Share of Market in 2020
Figure 23 Market, By Region
Figure 24 Geographic Snapshot: Crawler Camera System Market
Figure 25 Crawler Camera System Market in North America
Figure 26 Snapshot: Market in North America
Figure 27 Market in Europe
Figure 28 Snapshot: Market in Europe
Figure 29 Market in APAC
Figure 30 Snapshot: Market in APAC
Figure 31 Market in RoW
Figure 32 New Product Launches Was the Key Growth Strategy From 2016 to 2019
Figure 33 Market (Global) Competitive Leadership Mapping, 2019
The study involved 4 major activities in estimating the current size of the crawler camera system market. Exhaustive secondary research was done to collect information on the market, the peer markets, and the parent market. The next step was to validate these findings, assumptions, and sizing with industry experts across the value chain through primary research. Both top-down and bottom-up approaches were employed to estimate the complete market size. Thereafter, market breakdown and data triangulation were used to estimate the market size of segments and subsegments.
Secondary Research
Secondary sources referred to in this research study include corporate filings (such as company websites, investor presentations, and financial statements); trade, business, and professional associations; white papers, crawler camera system-related journals, IEST publications; directories; and databases. The secondary data has been collected and analyzed to arrive at the overall market size estimations, which has been further validated by primary research.
Primary Research
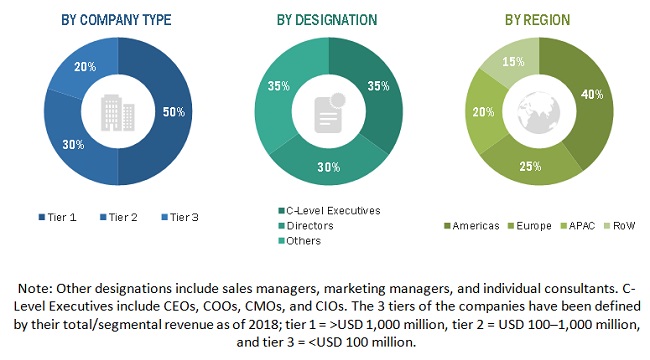
In the primary research process, various primary sources from both supply and demand sides have been interviewed to obtain qualitative and quantitative information relevant to this report. Extensive primary research has been conducted after understanding and analyzing the market through secondary research. Several primary interviews have been conducted with key opinion leaders from both demand- and supply-side vendors across 4 regions: the Americas, Europe, APAC, and RoW. RoW comprises the Middle East, Africa, and South America. Approximately 25% of the primary interviews have been conducted with the demand side and 75% with the supply side. This primary data has been collected mainly through telephonic interviews, which accounted for 80% of the total primary interviews. Besides, questionnaires and emails were also used to collect the data.
To know about the assumptions considered for the study, download the pdf brochure
Market Size Estimation
Both top-down and bottom-up approaches were implemented to estimate and validate the total size of the crawler camera system market. These methods were also used extensively to estimate the size of the markets based on various subsegments. The research methodology used to estimate the market size includes the following steps:
- The key players in the industry and markets have been identified through extensive secondary research.
- The industry’s supply chain and market size, in terms of value, have been determined through primary and secondary research processes.
- All percentage shares, splits, and breakdowns have been determined using secondary sources and verified through primary sources.
Data Triangulation
After arriving at the overall market size—using the market size estimation processes as explained above—the market was split into several segments and subsegments. To complete the overall market engineering process and arrive at the exact statistics of each market segment and subsegment, data triangulation and market breakdown procedures were employed, wherever applicable. The data was triangulated by studying various factors and trends from the demand and supply sides across different end-use applications.
Study Objectives
- To describe and forecast the market, in terms of value, by component, application, and vertical
- To describe and forecast the market size by regions—North America, Europe, Asia Pacific (APAC), and Rest of the World (RoW)
- To provide detailed information regarding the major factors such as drivers, restraints, opportunities, and challenges influencing the growth of the market
- To describe the components and functions of crawler camera systems
- To strategically analyze micromarkets with respect to individual growth trends, prospects, and their contributions to the overall market
- To analyze opportunities in the market for stakeholders and provide a detailed competitive landscape of the market
- To strategically profile key players in the market and comprehensively analyze their market ranking and core competencies
- To analyze competitive developments such as contracts, product launches/developments, expansions, and research and development (R&D) activities carried out by players in the crawler camera system market
Available Customizations
With the given market data, MarketsandMarkets offers customizations according to a company's specific needs. The following customization options are available for this report:
Regional Analysis
- Country-wise breakdown for America, Europe, APAC, and RoW
Company Information
- Detailed analysis and profiling of additional market players (up to 5)


Growth opportunities and latent adjacency in Crawler Camera System Market