Cybersecurity Mesh Market

Cybersecurity Mesh Market by Offering (Solutions, Services), Deployment Mode (Cloud, On-premises), Vertical (IT and ITeS, Healthcare, BFSI, Energy and Utilities), Organization Size (SMEs, Large Enterprises) and Region - Global Forecast to 2027

Report Code: TC 8583 Feb, 2023, by marketsandmarkets.com

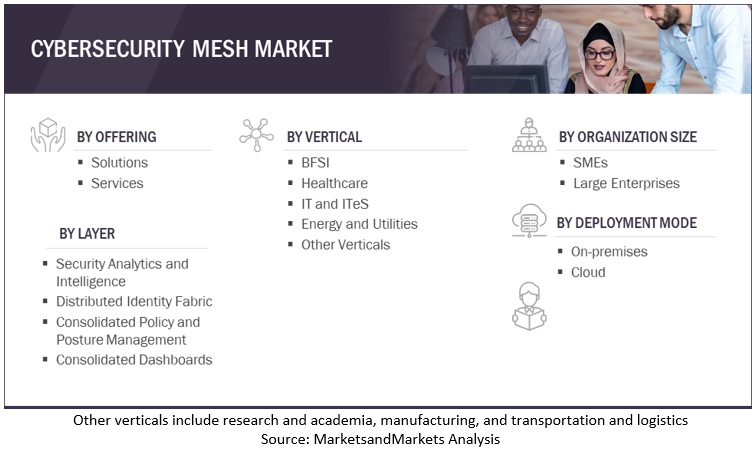
The global Cybersecurity Mesh Market is projected to grow from an estimated value of USD 0.9 billion in 2023 to USD 2.6 billion by 2027, at a Compound Annual Growth Rate (CAGR) of 28.6% from 2023 to 2027. There has been a rise in the cyberattacks faced by organizations in the recent years. This factor is expected to contribute to the growth of the cybersecurity mesh market. There is a significant demand for cybersecurity mesh solutions across verticals, such as IT & ITeS, BFSI, healthcare, energy and utilities, and others.
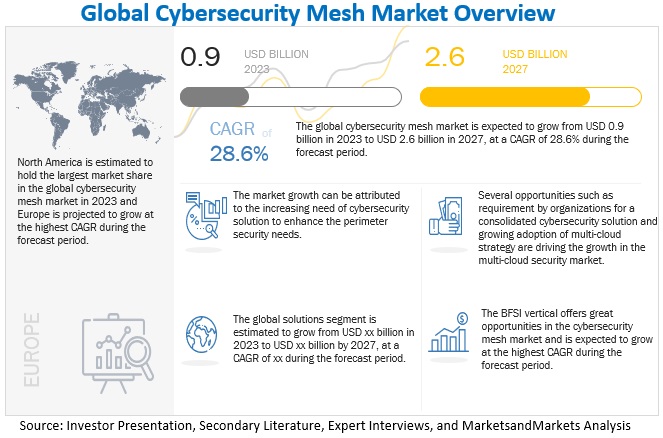
Cybersecurity Mesh Market

To know about the assumptions considered for the study, Request for Free Sample Report

Cybersecurity Mesh Market Dynamics

Driver: Perimeter becoming fragmented

Cyberspace has evolved in the recent years. Earlier companies were focused on securing the perimeter, ensuring the inside of the network remained a safe, trusted environment. The COVID-19 pandemic has significantly expanded cyberspace by organizations. IT organizations have complex security demands, making the existing security architectural approaches obsolete. This rapidly changing digital landscape requires a newer security approach to eliminate any security risk and operational overhead. The corporate network perimeter has evolved. Various applications and data are no longer in the company-owned data center, and users are accessing cloud-based applications from anywhere. In a traditional data center, network perimeter security was a common mechanism for controlling access. The extension to cyberspace comes with additional risks as traditional protection techniques are insufficient and isolated, generally focused on an organization's perimeter with little attention to what is out there. Within a distributed environment that supports assets everywhere and access from anywhere, identity and context have become the ultimate control surface. Implementing a cybersecurity mesh architecture would lead to a much better and more stable security infrastructure that benefits administrators and end users.

Restraint: Limited skilled expertise for deployment and usage of cybersecurity mesh solutions

The cybersecurity industry is becoming more complex as the technology vertical is growing. There are too many entry points for threats to attack today's virtual enterprise. However, few trained cybersecurity professionals can comprehend and respond to such advanced cyberattacks. Due to this shortage of qualified security talent, organizations are exposed to severe risks. According to the Fortinet 2022 Cybersecurity Skills Gap Global Research Report, 80% of organizations worldwide witnessed  cyberattacks due to lack of skilled expertise. A major problem faced by organizations worldwide is to be able to hire and retain the workforce. According to the report, 67% of the organizations feel that organizations are at greater risk of facing cyberattacks due to lack of skilled cybersecurity professionals. Cyber threats target and use network vulnerabilities to enter the enterprise network. With sophistication levels rising, many new zero-day threats have emerged. To enable the detection and remediation of these attacks, deploying cybersecurity mesh solutions can play an essential role for organizations. Due to low awareness about advanced cyber threats, organizations fail to spend on cybersecurity training adequately. Organizations need qualified cybersecurity professionals now more than ever, so 76% of organizations indicate that their board of directors recommends increasing IT and cybersecurity headcount. According to the report by Fortinet, Cloud security specialists and security operations analysts remain among the most sought-after roles in cybersecurity, followed by security administrators and architects. However, organizations are not just looking to ramp up hires arbitrarily. They are deliberately trying to build teams of specialized talent who are equipped to handle an increasingly complex threat landscape.

Opportunity: Growing adoption of multi-cloud strategy

Organizations are increasingly using multi-cloud deployments. Organizations tend to consume services from more than one cloud provider. According to Flexera's 2021 State of the Cloud Report, 92% of enterprises have a multi-cloud strategy, and 80% have a hybrid cloud strategy. Distributed IT assets in the multi-cloud add to the fragmentation problem when securing assets. When an organization has a single cloud, management is a lot easier because there is a single interface. In multi-cloud deployments, multiple interfaces must be managed, and one must know each component running in each of those clouds. From a cost and compliance perspective, organizations also need to know when something is running. Still, it is no longer because assets are typically spun up and down based on demand. For example, Alibaba Cloud, Amazon Web Services, Google, and Microsoft Azure use different methodologies to secure assets within their ecosystems. Every cloud provider supports a different set of policies. This makes creating a consistent security posture across cloud providers challenging. The huge on-premises estate of services found in most organizations only compounds the challenges. However, organizations seek to adopt a coherent security posture across the multi-cloud. CSMA provides the foundation for people and machines to connect securely from multiple locations across hybrid and multi-cloud environments, channels, and diverse generations of applications, protecting all the organizations' digital assets.

Challenge: Management of evolviong cyberthreats environment

Deploying the cybersecurity model on new or existing infrastructure has various design and implementation challenges. The model forces IT teams in enterprises to rethink their security infrastructure. Most networks are not designed keeping cybersecurity in mind, and upgrading to the cybersecurity model requires an in-depth network analysis of network hardware, services, and traffic. Remodeling networks using the cybersecurity model requires an accurate and clear understanding of every user, device, application, and resource. Cybersecurity mesh solutions are not entirely proven as they do not address all the issues; human errors and misconfigured devices include some of these problems. In today's virtual enterprise environment, targeted threats are increasing in volume, breadth, and complexity, becoming one of the organizations' most important security challenges. With the rapidly changing nature of threats and to avoid any loss of sensitive or critical information, it is vital to deploy cybersecurity mesh solutions, enabling protection against any cyberattacks.

Cybersecurity Mesh Market Ecosystem
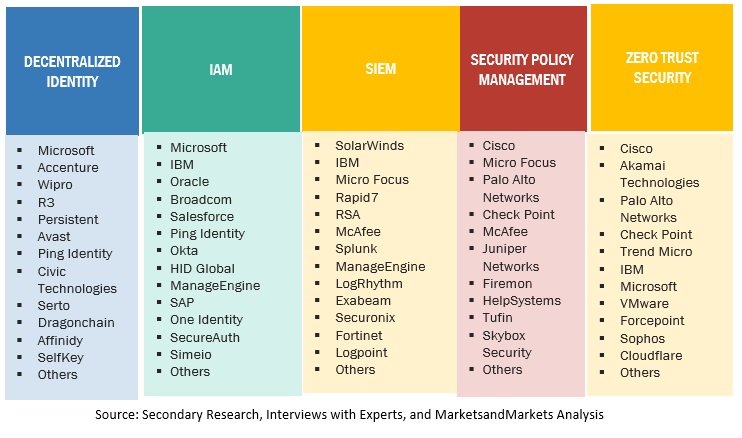
List of Top Companies in Cybersecurity Mesh Market

To know about the assumptions considered for the study, download the pdf brochure

By vertical, BFSI segment to grow at higher CAGR, during the forecast period

The BFSI vertical comprises commercial banks, insurance companies, mutual funds, cooperatives, non-banking financial companies, pension funds, and other smaller financial institutions. Due to highly sensitive financial data, the vertical is an early adopter of cutting-edge cybersecurity solutions. Because of the high frequency and large sums of money transferred between organizations, cyberattacks are rife in the finance sector. It faces challenges related to stringent regulatory and security requirements, providing superior service to customers and others. It frequently introduces new and improved financial products and services to enhance its business operations, which makes it attractive for fraudsters to target sensitive customer information. Different government mandates, including PCI DSS, necessitate financial institutions to meet these standards. There is an increasing need for cybersecurity mesh solutions and services in the BFSI vertical to combat the growing cyber-attacks on critical infrastructures. The emerging trend of cloud banking also leads to the need for securing confidential businesses and financial data in real time. Security consultants analyze IT ecosystems and business processes in organizations and suggest effective security policies to mitigate potential cyber risks and maintain a secure environment.

By offering, solutions segment to grow at the highest CAGR during the forecast period

The cybersecurity mesh solution includes an ecosystem of security tools to secure a distributed enterprise. The cybersecurity mesh solution defines supportive layers for essential security capabilities. It includes integrating composable, distributed security tools by centralizing the data and control plane and achieving collaboration between devices. For instance, Check Point Infinity provides unified protection across the entire IT infrastructure, including networks, cloud, endpoints, and mobile and IoT devices; uses 64 different threat prevention engines to block against known and zero-day threats, powered by shared threat intelligence, and enables unified security management, completely automated and integrated.

By deployment mode, cloud segment to hold largest market size during the forecast period

In the cloud deployment mode, a third-party service provider takes all the hosting and maintenance requirements. The organization involved in implementing and deploying solutions in the cloud utilizes the pay-as-you-use model. The deployment is flexible and scalable, and organizations can upgrade and downgrade their plans as per their business growth and scalability. The cloud mode involves built-in data backups and recovery. The maintenance costs are low, and the price is for the resources and space consumed. Organizations deploying the cloud mode must comply with the cybersecurity regulations and check if their service providers comply with the industry standards and regulations. As the data is shared with the service provider, the security offered is lesser, and the data is at a greater risk. The cloud-based deployment mode has been increasingly being used in recent years. Cybersecurity mesh solutions have increasingly used the cloud deployment model in recent years.

By region, North America to account for the larger market size during the forecast period
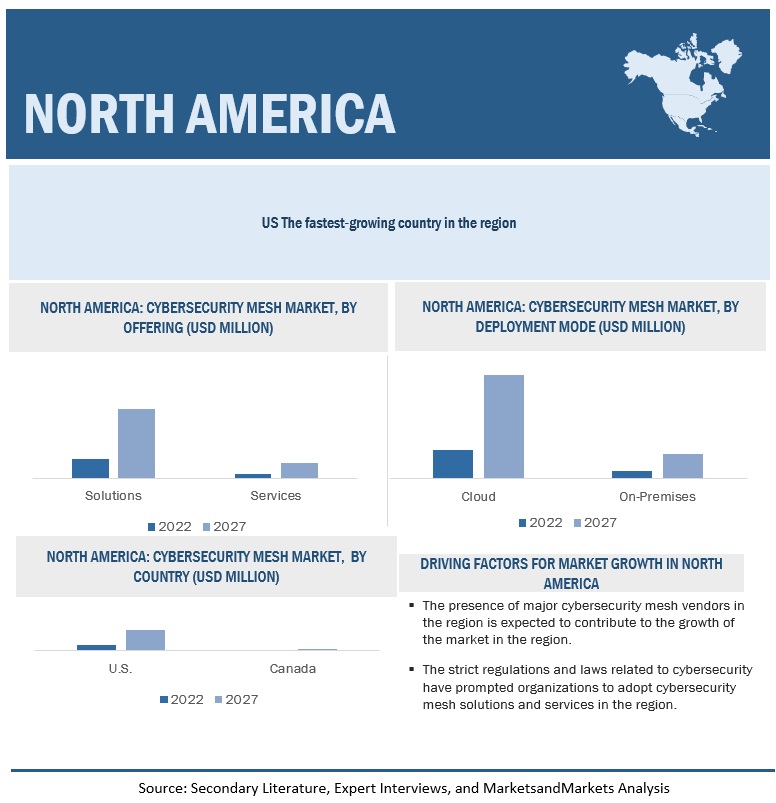
North American Cybersecurity Mesh Market

North America is expected to be the largest contributor in terms of the market size in the global cybersecurity mesh market. It is one of the most advanced regions in terms of security technology adoption and infrastructure. The region is experiencing increasing digitalization in the recent years. There is rise in the use of technologies, such as digital payments, cloud-based applications, and IoT, that have added complexities and concerns for enterprises, making this region increasingly vulnerable to cyberattacks. The increasing digitalization in the region has also increased the risk of cyberattacks on organizations. The region witnesses a high concentration of security vendors operating in the cybersecurity mesh market, which acts as a driver for the growth of the market in the region. Regulations implemented, such as PCI-DSS and HIPAA, act as driving factors for the adoption of cybersecurity mesh solutions. The implementation of such privacy laws have prompted organizations to adopt cybersecurity mesh solutions. The countries analyzed in the North America region include the United States and Canada.

Key Market Players

The major vendors in the cybersecurity mesh market include IBM (US), Palo Alto Networks (US), Check Point (Israel), Zscaler (US), Fortinet (US), GCA Technology (US), Forcepoint (US), SonicWall (US), Ivanti (US), Cato Networks (Israel), Aryaka Networks (US), SailPoint (US), appNovi (US), Appgate (US), Mesh Security (Israel), Primeter 81 (Israel), Naoris Protocol (Portugal), and Exium (US).

Get online access to the report on the World's First Market Intelligence Cloud

  • Easy to Download Historical Data & Forecast Numbers
  • Company Analysis Dashboard for high growth potential opportunities
  • Research Analyst Access for customization & queries
  • Competitor Analysis with Interactive dashboard
  • Latest News, Updates & Trend analysis
Request Sample

Scope of the Report

Report Metrics

Details

Market size value in 2023

US $0.9 billion

Market size value in 2027

US $2.6 billion

Growth Rate

28.6% CAGR

Market size available for years

2023-2027

Base year considered

2022

Segments covered

Layers, Offering, Deployment Mode, Organization Size, Verticals, and Region

Geographies covered

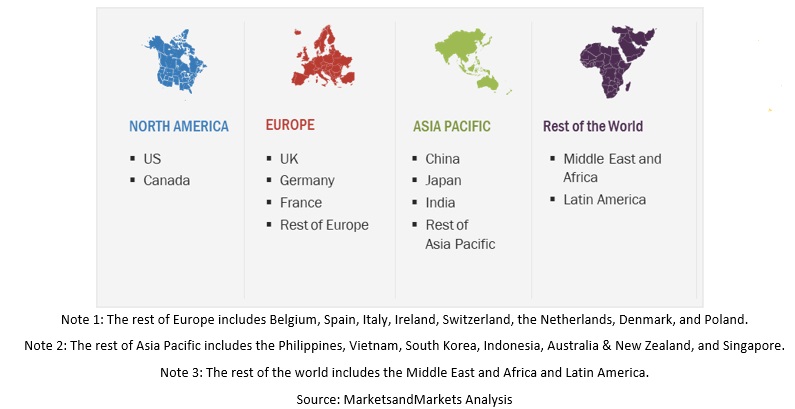
North America, Europe, Asia Pacific, Middle East and Africa, and Latin America

Major companies covered

IBM (US), Palo Alto Networks (US), Check Point (Israel), Zscaler (US), Fortinet (US), GCA Technology (US), Forcepoint (US), SonicWall (US), Ivanti (US), Cato Networks (Israel), Aryaka Networks (US), SailPoint (US), appNovi (US), Appgate (US), Mesh Security (Israel), Primeter 81 (Israel), Naoris Protocol (Portugal), and Exium (US).

Market Segmentation

Cybersecurity Mesh Market By Segmentation

Cybersecurity Mesh Market By Region

Recent Developments

  • In October 2022, Check Point announced the introduction of Check Point Quantum Titan, a new release of the Check Point Quantum cybersecurity platform. The Quantum Titan release introduces three new software blades that leverage AI and deep learning to deliver advanced threat prevention against DNS, phishing, and autonomous IoT security. It provides IoT device discovery and automatically applies zero-trust threat prevention profiles to protect IoT devices.
  • In September 2022, Zscaler announced that it had completed the acquisition of ShiftRight, a leader in closed-loop security workflow automation technology currently being integrated into the Zscaler Zero Trust Exchange cloud security platform to automate security management for the growing influx of risks and incidents organizations are experiencing. This integration will provide a simple, sophisticated solution to reduce incident resolution time dramatically.
  • In May 2022, Lookout, a leader in endpoint-to-cloud security, and Ivanti announced that they had joined forces to help organizations accelerate cloud adoption and mature their zero-trust security posture in the everywhere workplace. Ivanti and Lookout have integrated Ivanti Neurons for Zero trust access, Lookout CASB, and Lookout SWG to help customers achieve complete threat prevention and data security both on-premises and in the cloud, inside and outside the network while following zero trust access security principles.

Frequently Asked Questions (FAQ):

To speak to our analyst for a discussion on the above findings, click Speak to Analyst

TABLE OF CONTENTS
 
1 INTRODUCTION (Page No. - 20)
    1.1 STUDY OBJECTIVES 
    1.2 MARKET DEFINITION 
           1.2.1 INCLUSIONS AND EXCLUSIONS
    1.3 MARKET SCOPE 
           1.3.1 MARKET SEGMENTATION
    1.4 YEARS CONSIDERED 
    1.5 CURRENCY CONSIDERED 
           TABLE 1 USD EXCHANGE RATES, 2022
    1.6 STAKEHOLDERS 
 
2 RESEARCH METHODOLOGY (Page No. - 25)
    2.1 RESEARCH DATA 
           FIGURE 1 CYBERSECURITY MESH MARKET: RESEARCH DESIGN
           2.1.1 SECONDARY DATA
           2.1.2 PRIMARY DATA
                    2.1.2.1 Breakup of primary profiles
                    2.1.2.2 Key industry insights
    2.2 DATA TRIANGULATION 
           FIGURE 2 MARKET: DATA TRIANGULATION
    2.3 MARKET SIZE ESTIMATION 
           2.3.1 TOP-DOWN APPROACH
           2.3.2 BOTTOM-UP APPROACH
                    FIGURE 3 MARKET SIZE ESTIMATION METHODOLOGY—APPROACH 1 (SUPPLY SIDE): REVENUE FROM SOFTWARE/SERVICES OF CYBERSECURITY MESH VENDORS
                    FIGURE 4 MARKET SIZE ESTIMATION METHODOLOGY: APPROACH 1 (SUPPLY SIDE) ANALYSIS
                    FIGURE 5 CYBERSECURITY MESH MARKET ESTIMATION APPROACH: RESEARCH FLOW
                    FIGURE 6 MARKET SIZE ESTIMATION METHODOLOGY: APPROACH 2, BOTTOM-UP (DEMAND SIDE): PRODUCTS/SOLUTIONS/SERVICES
    2.4 MARKET FORECAST 
           TABLE 2 FACTOR ANALYSIS
    2.5 COMPANY QUADRANT EVALUATION METHODOLOGY 
           FIGURE 7 COMPANY QUADRANT EVALUATION: CRITERIA WEIGHTAGE
    2.6 QUADRANT EVALUATION METHODOLOGY FOR STARTUPS 
           FIGURE 8 QUADRANT EVALUATION FOR STARTUPS: CRITERIA WEIGHTAGE
    2.7 ASSUMPTIONS 
           TABLE 3 MARKET: ASSUMPTIONS
    2.8 LIMITATIONS 
           TABLE 4 MARKET: LIMITATIONS
 
3 EXECUTIVE SUMMARY (Page No. - 39)
    FIGURE 9 GLOBAL CYBERSECURITY MESH MARKET TO WITNESS SIGNIFICANT GROWTH DURING FORECAST PERIOD 
    FIGURE 10 MARKET: SEGMENTS SNAPSHOT 
    FIGURE 11 MARKET: REGIONAL SNAPSHOT 
 
4 PREMIUM INSIGHTS (Page No. - 43)
    4.1 ATTRACTIVE OPPORTUNITIES FOR KEY PLAYERS IN MARKET 
           FIGURE 12 INCREASING ADOPTION OF MULTI-CLOUD BY ORGANIZATIONS AND INCREASING CYBER BREACHING CASES TO DRIVE CYBERSECURITY MESH MARKET GROWTH
    4.2 MARKET, BY OFFERING, 2023–2027 
           FIGURE 13 SOLUTIONS SEGMENT TO HOLD LARGER MARKET SIZE DURING FORECAST PERIOD
    4.3 MARKET, BY DEPLOYMENT MODE, 2023–2027 
           FIGURE 14 CLOUD DEPLOYMENT SEGMENT TO HOLD LARGER MARKET SIZE DURING FORECAST PERIOD
    4.4 MARKET, BY ORGANIZATION SIZE, 2023–2027 
           FIGURE 15 LARGE ENTERPRISES SEGMENT TO HOLD LARGER MARKET SIZE DURING FORECAST PERIOD
    4.5 MARKET, BY VERTICAL, 2023–2027 
           FIGURE 16 IT AND ITES VERTICAL TO HOLD LARGEST MARKET SIZE DURING FORECAST PERIOD
    4.6 MARKET INVESTMENT SCENARIO 
           FIGURE 17 EUROPE TO EMERGE AS FRUITFUL MARKET FOR INVESTMENTS IN NEXT FIVE YEARS
 
5 MARKET OVERVIEW AND INDUSTRY TRENDS (Page No. - 46)
    5.1 INTRODUCTION 
    5.2 MARKET DYNAMICS 
           FIGURE 18 CYBERSECURITY MESH MARKET: DRIVERS, RESTRAINTS, OPPORTUNITIES, AND CHALLENGES
           5.2.1 DRIVERS
                    5.2.1.1 Perimeter becoming fragmented
                    5.2.1.2 Increasing cyberattacks faced by organizations
           5.2.2 RESTRAINTS
                    5.2.2.1 Limited skilled expertise in deployment and usage of cybersecurity mesh solutions
           5.2.3 OPPORTUNITIES
                    5.2.3.1 Requirement by organizations for consolidated cybersecurity solution
                    5.2.3.2 Growing adoption of multi-cloud strategy
           5.2.4 CHALLENGES
                    5.2.4.1 Managing evolving cyber threats
                    5.2.4.2 Financial constraints among SMEs and startups
    5.3 ECOSYSTEM ANALYSIS 
           FIGURE 19 CYBERSECURITY MESH MARKET: ECOSYSTEM
           TABLE 5 MARKET: ECOSYSTEM
    5.4 TECHNOLOGY ANALYSIS 
           5.4.1 AI/ML
           5.4.2 IOT
           5.4.3 BIG DATA ANALYTICS
           5.4.4 BLOCKCHAIN
           5.4.5 ZERO TRUST SECURITY
    5.5 REGULATORY IMPLICATIONS 
           5.5.1 GENERAL DATA PROTECTION REGULATION
           5.5.2 HEALTH INSURANCE PORTABILITY AND ACCOUNTABILITY ACT
           5.5.3 PAYMENT CARD INDUSTRY DATA SECURITY STANDARD
           5.5.4 INTERNATIONAL ORGANIZATION FOR STANDARDIZATION STANDARD 27001
           5.5.5 CALIFORNIA CONSUMER PRIVACY ACT
           5.5.6 PERSONAL INFORMATION PROTECTION AND ELECTRONIC DOCUMENTS ACT
           5.5.7 GRAMM-LEACH-BLILEY ACT
           5.5.8 FEDERAL INFORMATION SECURITY MODERNIZATION ACT 2014
           5.5.9 SARBANES-OXLEY ACT
           5.5.10 STOP HACKS AND IMPROVE ELECTRONIC DATA SECURITY ACT
           5.5.11 REGULATORY BODIES, GOVERNMENT AGENCIES, AND OTHER ORGANIZATIONS
                    TABLE 6 LIST OF REGULATORY BODIES, GOVERNMENT AGENCIES, AND OTHER ORGANIZATIONS
    5.6 PATENT ANALYSIS 
           FIGURE 20 CYBERSECURITY MESH MARKET: PATENT ANALYSIS
    5.7 USE CASES 
           5.7.1 USE CASE 1: CSK IMPROVES NETWORK VISIBILITY AND MANAGEMENT BY CONSOLIDATING ON FORTINET SECURITY FABRIC SOLUTION
           5.7.2 USE CASE 2: EUROWIND PROTECTS CRITICAL ENERGY INFRASTRUCTURE FROM GEN V CYBERATTACKS WITH CHECK POINT’S INFINITY TOTAL PROTECTION
           5.7.3 USE CASE 3: PERKINELMER STOPS ADVANCED THREATS IN ITS TRACKS WITH PROOFPOINT
           5.7.4 USE CASE 4: FORTIDECEPTOR DELIVERS BREACH PROTECTION FOR CRITICAL HEALTHCARE SERVICES
           5.7.5 USE CASE 5: INVENTEC DEPLOYED HIGHLY SCALABLE, PROACTIVE DEFENSES WITH CHECK POINT
    5.8 PRICING ANALYSIS 
    5.9 SUPPLY CHAIN ANALYSIS 
           FIGURE 21 SUPPLY CHAIN ANALYSIS: MARKET
           5.9.1 CYBERSECURITY MESH SOLUTION AND SERVICE PROVIDERS
           5.9.2 PLANNING AND DESIGN
           5.9.3 INFRASTRUCTURE DEPLOYMENT
           5.9.4 SYSTEM INTEGRATORS
           5.9.5 SALES AND DISTRIBUTION
           5.9.6 END USERS
    5.10 PORTER'S FIVE FORCES MODEL ANALYSIS 
           FIGURE 22 CYBERSECURITY MESH MARKET: PORTER'S FIVE FORCE ANALYSIS
           TABLE 7 MARKET: IMPACT OF PORTER'S FIVE FORCES
           5.10.1 THREAT OF NEW ENTRANTS
           5.10.2 THREAT OF SUBSTITUTES
           5.10.3 BARGAINING POWER OF SUPPLIERS
           5.10.4 BARGAINING POWER OF BUYERS
           5.10.5 RIVALRY AMONG EXISTING COMPETITORS
    5.11 TRENDS AND DISRUPTIONS IMPACTING CUSTOMERS 
                    FIGURE 23 MARKET: TRENDS AND DISRUPTIONS IMPACTING CUSTOMERS
    5.12 KEY STAKEHOLDERS AND BUYING CRITERIA 
                    FIGURE 24 INFLUENCE OF STAKEHOLDERS ON BUYING PROCESS (%)
                    TABLE 8 INFLUENCE OF STAKEHOLDERS ON BUYING PROCESS (%)
    5.13 KEY CONFERENCES AND EVENTS IN 2022–2023 
                    TABLE 9 MARKET: LIST OF CONFERENCES AND EVENTS
 
6 CYBERSECURITY MESH MARKET, BY LAYER (Page No. - 68)
    6.1 INTRODUCTION 
    6.2 SECURITY ANALYTICS AND INTELLIGENCE 
           6.2.1 ENABLES COLLECTION AND ANALYSIS OF DATA
    6.3 DISTRIBUTED IDENTITY FABRIC 
           6.3.1 ALLOWS EFFICIENT MANAGEMENT OF IDENTITIES
    6.4 CONSOLIDATED POLICY AND POSTURE MANAGEMENT 
           6.4.1 ENABLES ENFORCING SECURITY POLICIES
    6.5 CONSOLIDATED DASHBOARDS 
           6.5.1 PROVIDES HOLISTIC VIEW OF SECURITY INFRASTRUCTURE
 
7 CYBERSECURITY MESH MARKET, BY OFFERING (Page No. - 70)
    7.1 INTRODUCTION 
           FIGURE 25 SOLUTIONS SEGMENT TO GROW AT HIGHER CAGR DURING FORECAST PERIOD
           TABLE 10 MARKET, BY OFFERING, 2022–2027 (USD MILLION)
    7.2 SOLUTIONS 
           7.2.1 DEPLOYED BY ORGANIZATIONS TO MITIGATE CYBER THREATS
           7.2.2 SOLUTIONS: MARKET DRIVERS
                    TABLE 11 SOLUTIONS: MARKET, BY REGION, 2022–2027 (USD MILLION)
    7.3 SERVICES 
           7.3.1 ENABLES IMPLEMENTATION OF CYBERSECURITY MESH SOLUTIONS
           7.3.2 SERVICES: MARKET DRIVERS
                    TABLE 12 SERVICES: MARKET, BY REGION, 2022–2027 (USD MILLION)
 
8 CYBERSECURITY MESH MARKET, BY DEPLOYMENT MODE (Page No. - 74)
    8.1 INTRODUCTION 
           FIGURE 26 CLOUD SEGMENT TO REGISTER HIGHER CAGR DURING FORECAST PERIOD
           TABLE 13 MARKET, BY DEPLOYMENT MODE, 2022–2027 (USD MILLION)
    8.2 CLOUD 
           8.2.1 LOW MAINTENANCE COSTS AND INCREASED SCALABILITY
           8.2.2 CLOUD: MARKET DRIVERS
                    TABLE 14 CLOUD: MARKET, BY REGION, 2022–2027 (USD MILLION)
    8.3 ON-PREMISES 
           8.3.1 INCREASED SECURITY IN DEPLOYMENT OF SOLUTIONS
           8.3.2 ON-PREMISES: MARKET DRIVERS
                    TABLE 15 ON-PREMISES: MARKET, BY REGION, 2022–2027 (USD MILLION)
 
9 CYBERSECURITY MESH MARKET, BY ORGANIZATION SIZE (Page No. - 78)
    9.1 INTRODUCTION 
           FIGURE 27 SMES SEGMENT TO REGISTER HIGHER CAGR DURING FORECAST PERIOD
           TABLE 16 MARKET, BY ORGANIZATION SIZE, 2022–2027 (USD MILLION)
    9.2 LARGE ENTERPRISES 
           9.2.1 INCREASING CYBER THREATS REPORTED
           9.2.2 LARGE ENTERPRISES: MARKET DRIVERS
                    TABLE 17 LARGE ENTERPRISES: MARKET, BY REGION, 2022–2027 (USD MILLION)
    9.3 SMES 
           9.3.1 SURGE IN CYBERCRIMES REPORTED
           9.3.2 SMES: MARKET DRIVERS
                    TABLE 18 SMES: MARKET, BY REGION, 2022–2027 (USD MILLION)
 
10 CYBERSECURITY MESH MARKET, BY VERTICAL (Page No. - 82)
     10.1 INTRODUCTION 
               FIGURE 28 BFSI VERTICAL TO REGISTER HIGHEST CAGR DURING FORECAST PERIOD
               TABLE 19 MARKET, BY VERTICAL, 2022–2027 (USD MILLION)
     10.2 IT AND ITES 
             10.2.1 ENHANCING SECURITY POSTURE OF ORGANIZATIONS
             10.2.2 IT AND ITES: MARKET DRIVERS
                       TABLE 20 IT AND ITES: MARKET, BY REGION, 2022–2027 (USD MILLION)
     10.3 BFSI 
             10.3.1 COMPLIANCE WITH REGULATIONS
             10.3.2 BFSI: MARKET DRIVERS
                       TABLE 21 BFSI: MARKET, BY REGION, 2022–2027 (USD MILLION)
     10.4 HEALTHCARE 
             10.4.1 STRICT REGULATIONS IMPLEMENTED
             10.4.2 HEALTHCARE: MARKET DRIVERS
                       TABLE 22 HEALTHCARE: MULTI-CLOUD SECURITY MARKET, BY REGION, 2022–2027 (USD MILLION)
     10.5 ENERGY AND UTILITIES 
             10.5.1 INCREASING ADOPTION OF DIGITAL TECHNOLOGIES
                       TABLE 23 ENERGY AND UTILITIES: MULTI-CLOUD SECURITY MARKET, BY REGION, 2022–2027 (USD MILLION)
     10.6 OTHER VERTICALS 
             10.6.1 INCREASING CYBERCRIMES REPORTED AND REGULATIONS IMPLEMENTED
 
11 CYBERSECURITY MESH MARKET, BY REGION (Page No. - 89)
     11.1 INTRODUCTION 
               FIGURE 29 EUROPE TO GROW AT HIGHEST CAGR DURING FORECAST PERIOD
               TABLE 24 MARKET, BY REGION, 2022–2027 (USD MILLION)
     11.2 NORTH AMERICA 
             11.2.1 NORTH AMERICA: MARKET DRIVERS
             11.2.2 NORTH AMERICA: REGULATORY LANDSCAPE
                       FIGURE 30 NORTH AMERICA: CYBERSECURITY MESH MARKET SNAPSHOT
                       TABLE 25 NORTH AMERICA: MARKET, BY OFFERING, 2022–2027 (USD MILLION)
                       TABLE 26 NORTH AMERICA: MARKET, BY DEPLOYMENT MODE, 2022–2027 (USD MILLION)
                       TABLE 27 NORTH AMERICA: MARKET, BY ORGANIZATION SIZE, 2022–2027 (USD MILLION)
                       TABLE 28 NORTH AMERICA: MARKET, BY VERTICAL, 2022–2027 (USD MILLION)
                       TABLE 29 NORTH AMERICA: MARKET, BY COUNTRY, 2022–2027 (USD MILLION)
             11.2.3 US
                       11.2.3.1 Large number of cybersecurity mesh vendors and strict regulations implemented
                                   TABLE 30 US: CYBERSECURITY MESH MARKET, BY OFFERING, 2022–2027 (USD MILLION)
                                   TABLE 31 US: MARKET, BY DEPLOYMENT MODE, 2022–2027 (USD MILLION)
                                   TABLE 32 US: MARKET, BY ORGANIZATION SIZE, 2022–2027 (USD MILLION)
                                   TABLE 33 US: MARKET, BY VERTICAL, 2022–2027 (USD MILLION)
             11.2.4 CANADA
                       11.2.4.1 Increasing initiatives by government
                                   TABLE 34 CANADA: MARKET, BY OFFERING, 2022–2027 (USD MILLION)
                                   TABLE 35 CANADA: MARKET, BY DEPLOYMENT MODE, 2022–2027 (USD MILLION)
                                   TABLE 36 CANADA: MARKET, BY ORGANIZATION SIZE, 2022–2027 (USD MILLION)
                                   TABLE 37 CANADA: MARKET, BY VERTICAL, 2022–2027 (USD MILLION)
     11.3 EUROPE 
             11.3.1 EUROPE: MARKET DRIVERS
             11.3.2 EUROPE: REGULATORY LANDSCAPE
                       FIGURE 31 EUROPE: MARKET SNAPSHOT
                       TABLE 38 EUROPE: CYBERSECURITY MESH MARKET, BY OFFERING, 2022–2027 (USD MILLION)
                       TABLE 39 EUROPE: MARKET, BY DEPLOYMENT MODE, 2022–2027 (USD MILLION)
                       TABLE 40 EUROPE: MARKET, BY ORGANIZATION SIZE, 2022–2027 (USD MILLION)
                       TABLE 41 EUROPE: MARKET, BY VERTICAL, 2022–2027 (USD MILLION)
                       TABLE 42 EUROPE: MARKET, BY COUNTRY, 2022–2027 (USD MILLION)
             11.3.3 UK
                       11.3.3.1 Several cybersecurity initiatives by government
                                   TABLE 43 UK: MARKET, BY OFFERING, 2022–2027 (USD MILLION)
                                   TABLE 44 UK: MARKET, BY DEPLOYMENT MODE, 2022–2027 (USD MILLION)
                                   TABLE 45 UK: MARKET, BY ORGANIZATION SIZE, 2022–2027 (USD MILLION)
                                   TABLE 46 UK: MARKET, BY VERTICAL, 2022–2027 (USD MILLION)
             11.3.4 GERMANY
                       11.3.4.1 Increasing cyberattacks faced by organizations
                                   TABLE 47 GERMANY: CYBERSECURITY MESH MARKET, BY OFFERING, 2022–2027 (USD MILLION)
                                   TABLE 48 GERMANY: MARKET, BY DEPLOYMENT MODE, 2022–2027 (USD MILLION)
                                   TABLE 49 GERMANY: MARKET, BY ORGANIZATION SIZE, 2022–2027 (USD MILLION)
                                   TABLE 50 GERMANY: MARKET, BY VERTICAL, 2022–2027 (USD MILLION)
             11.3.5 FRANCE
                       11.3.5.1 Rising cybercrimes witnessed
                                   TABLE 51 FRANCE: MARKET, BY OFFERING, 2022–2027 (USD MILLION)
                                   TABLE 52 FRANCE: MARKET, BY DEPLOYMENT MODE, 2022–2027 (USD MILLION)
                                   TABLE 53 FRANCE: MARKET, BY ORGANIZATION SIZE, 2022–2027 (USD MILLION)
                                   TABLE 54 FRANCE: MARKET, BY VERTICAL, 2022–2027 (USD MILLION)
             11.3.6 REST OF EUROPE
                       TABLE 55 REST OF EUROPE: CYBERSECURITY MESH MARKET, BY OFFERING, 2022–2027 (USD MILLION)
                       TABLE 56 REST OF EUROPE: MARKET, BY DEPLOYMENT MODE, 2022–2027 (USD MILLION)
                       TABLE 57 REST OF EUROPE: MARKET, BY ORGANIZATION SIZE, 2022–2027 (USD MILLION)
                       TABLE 58 REST OF EUROPE: MARKET, BY VERTICAL, 2022–2027 (USD MILLION)
     11.4 ASIA PACIFIC 
             11.4.1 ASIA PACIFIC: MARKET DRIVERS
             11.4.2 ASIA PACIFIC: REGULATORY LANDSCAPE
                       TABLE 59 ASIA PACIFIC: MARKET, BY OFFERING, 2022–2027 (USD MILLION)
                       TABLE 60 ASIA PACIFIC: MARKET, BY DEPLOYMENT MODE, 2022–2027 (USD MILLION)
                       TABLE 61 ASIA PACIFIC: MARKET, BY ORGANIZATION SIZE, 2022–2027 (USD MILLION)
                       TABLE 62 ASIA PACIFIC: MARKET, BY VERTICAL, 2022–2027 (USD MILLION)
                       TABLE 63 ASIA PACIFIC: MARKET, BY COUNTRY, 2022–2027 (USD MILLION)
             11.4.3 CHINA
                       11.4.3.1 Growth in digitalization
                                   TABLE 64 CHINA: CYBERSECURITY MESH MARKET, BY OFFERING, 2022–2027 (USD MILLION)
                                   TABLE 65 CHINA: MARKET, BY DEPLOYMENT MODE, 2022–2027 (USD MILLION)
                                   TABLE 66 CHINA: MARKET, BY ORGANIZATION SIZE, 2022–2027 (USD MILLION)
                                   TABLE 67 CHINA: MARKET, BY VERTICAL, 2022–2027 (USD MILLION)
             11.4.4 JAPAN
                       11.4.4.1 Digital transformation initiatives by government
                                   TABLE 68 JAPAN: MARKET, BY OFFERING, 2022–2027 (USD MILLION)
                                   TABLE 69 JAPAN: MARKET, BY DEPLOYMENT MODE, 2022–2027 (USD MILLION)
                                   TABLE 70 JAPAN: MARKET, BY ORGANIZATION SIZE, 2022–2027 (USD MILLION)
                                   TABLE 71 JAPAN: MARKET, BY VERTICAL, 2022–2027 (USD MILLION)
             11.4.5 INDIA
                       11.4.5.1 Growing adoption of digital technologies by SMEs
                                   TABLE 72 INDIA: CYBERSECURITY MESH MARKET, BY OFFERING, 2022–2027 (USD MILLION)
                                   TABLE 73 INDIA: MARKET, BY DEPLOYMENT MODE, 2022–2027 (USD MILLION)
                                   TABLE 74 INDIA: MARKET, BY ORGANIZATION SIZE, 2022–2027 (USD MILLION)
                                   TABLE 75 INDIA: MARKET, BY VERTICAL, 2022–2027 (USD MILLION)
             11.4.6 REST OF ASIA PACIFIC
                       TABLE 76 REST OF ASIA PACIFIC: MARKET, BY OFFERING, 2022–2027 (USD MILLION)
                       TABLE 77 REST OF ASIA PACIFIC: MARKET, BY DEPLOYMENT MODE, 2022–2027 (USD MILLION)
                       TABLE 78 REST OF ASIA PACIFIC: MARKET, BY ORGANIZATION SIZE, 2022–2027 (USD MILLION)
                       TABLE 79 REST OF ASIA PACIFIC: MARKET, BY VERTICAL, 2022–2027 (USD MILLION)
     11.5 REST OF THE WORLD 
               TABLE 80 REST OF THE WORLD: CYBERSECURITY MESH MARKET, BY OFFERING, 2022–2027 (USD MILLION)
               TABLE 81 REST OF THE WORLD: MARKET, BY DEPLOYMENT MODE, 2022–2027 (USD MILLION)
               TABLE 82 REST OF THE WORLD: MARKET, BY ORGANIZATION SIZE, 2022–2027 (USD MILLION)
               TABLE 83 REST OF THE WORLD: MARKET, BY VERTICAL, 2022–2027 (USD MILLION)
               TABLE 84 REST OF THE WORLD: MARKET, BY REGION, 2022–2027 (USD MILLION)
             11.5.1 MIDDLE EAST AND AFRICA
                       11.5.1.1 Middle East and Africa market drivers
                       11.5.1.2 Middle East and Africa: Regulatory landscape
                       11.5.1.3 Middle East
                                   11.5.1.3.1 Growing digital initiatives by government
                       11.5.1.4 Africa
                                   11.5.1.4.1 Regulations implemented related to cybersecurity
             11.5.2 LATIN AMERICA
                       11.5.2.1 Latin America market drivers
                       11.5.2.2 Latin America: Regulatory landscape
                       11.5.2.3 Brazil
                                   11.5.2.3.1 Increasing cyberattacks
                       11.5.2.4 Mexico
                                   11.5.2.4.1 Investment in digitalization initiatives
                       11.5.2.5 Rest of Latin America
 
12 COMPETITIVE LANDSCAPE (Page No. - 124)
     12.1 OVERVIEW 
     12.2 CYBERSECURITY MESH MARKET: RANKING OF KEY PLAYERS 
               FIGURE 32 RANKINGS OF KEY PLAYERS
     12.3 COMPANY EVALUATION QUADRANT 
             12.3.1 STARS
             12.3.2 EMERGING LEADERS
             12.3.3 PERVASIVE PLAYERS
             12.3.4 PARTICIPANTS
                       FIGURE 33 MARKET: KEY COMPANY EVALUATION QUADRANT (2022)
             12.3.5 COMPETITIVE BENCHMARKING FOR KEY PLAYERS
                       FIGURE 34 PRODUCT FOOTPRINT OF KEY COMPANIES
     12.4 STARTUP/SME EVALUATION QUADRANT 
             12.4.1 PROGRESSIVE COMPANIES
             12.4.2 RESPONSIVE COMPANIES
             12.4.3 DYNAMIC COMPANIES
             12.4.4 STARTING BLOCKS
                       FIGURE 35 CYBERSECURITY MESH MARKET: STARTUP EVALUATION QUADRANT (2022)
             12.4.5 COMPETITIVE BENCHMARKING FOR STARTUPS
                       TABLE 85 LIST OF STARTUPS/SMES AND FUNDING
                       TABLE 86 REGIONAL FOOTPRINT OF STARTUPS/SMES
     12.5 COMPETITIVE SCENARIO AND TRENDS 
             12.5.1 PRODUCT LAUNCHES & ENHANCEMENTS
                       TABLE 87 MARKET: PRODUCT LAUNCHES & ENHANCEMENTS, 2022– JANUARY 2023
             12.5.2 DEALS
                       TABLE 88 CYBERSECURITY MESH MARKET: DEALS, 2022–JANUARY 2023
 
13 COMPANY PROFILES (Page No. - 134)
     13.1 KEY PLAYERS 
             13.1.1 IBM
(Business Overview, Products/Solutions/Services offered, Recent Developments, MnM View)*
                       TABLE 89 IBM: BUSINESS OVERVIEW
                       FIGURE 36 IBM: COMPANY SNAPSHOT
                       TABLE 90 IBM: PRODUCTS/SOLUTIONS/SERVICES OFFERED
                       TABLE 91 IBM: PRODUCT LAUNCHES AND ENHANCEMENTS
             13.1.2 PALO ALTO NETWORKS
                       TABLE 92 PALO ALTO NETWORKS: BUSINESS OVERVIEW
                       FIGURE 37 PALO ALTO NETWORKS: COMPANY SNAPSHOT
                       TABLE 93 PALO ALTO NETWORKS: PRODUCTS/SOLUTIONS/SERVICES OFFERED
                       TABLE 94 PALO ALTO NETWORKS: PRODUCT LAUNCHES AND ENHANCEMENTS
                       TABLE 95 PALO ALTO NETWORKS: DEALS
             13.1.3 CHECK POINT
                       TABLE 96 CHECK POINT: BUSINESS OVERVIEW
                       FIGURE 38 CHECK POINT: COMPANY SNAPSHOT
                       TABLE 97 CHECK POINT: PRODUCTS/SOLUTIONS/SERVICES OFFERED
                       TABLE 98 CHECK POINT: PRODUCT LAUNCHES AND ENHANCEMENTS
                       TABLE 99 CHECK POINT: DEALS
             13.1.4 ZSCALER
                       TABLE 100 ZSCALER: BUSINESS OVERVIEW
                       FIGURE 39 ZSCALER: COMPANY SNAPSHOT
                       TABLE 101 ZSCALER: PRODUCTS/SOLUTIONS/SERVICES OFFERED
                       TABLE 102 ZSCALER: PRODUCT LAUNCHES AND ENHANCEMENTS
                       TABLE 103 ZSCALER: DEALS
             13.1.5 FORTINET
                       TABLE 104 FORTINET: BUSINESS OVERVIEW
                       FIGURE 40 FORTINET: COMPANY SNAPSHOT
                       TABLE 105 FORTINET: PRODUCTS/SOLUTIONS/SERVICES OFFERED
             13.1.6 GCA TECHNOLOGY
                       TABLE 106 GCA TECHNOLOGY: BUSINESS OVERVIEW
                       TABLE 107 GCA TECHNOLOGY: PRODUCTS/SOLUTIONS/SERVICES OFFERED
             13.1.7 FORCEPOINT
                       TABLE 108 FORCEPOINT: BUSINESS OVERVIEW
                       TABLE 109 FORCEPOINT: PRODUCTS/SOLUTIONS/SERVICES OFFERED
                       TABLE 110 FORCEPOINT: PRODUCT LAUNCHES AND ENHANCEMENTS
             13.1.8 SONICWALL
                       TABLE 111 SONICWALL: BUSINESS OVERVIEW
                       TABLE 112 SONICWALL: PRODUCTS/SOLUTIONS/SERVICES OFFERED
                       TABLE 113 SONICWALL: PRODUCT LAUNCHES AND ENHANCEMENTS
             13.1.9 IVANTI
                       TABLE 114 IVANTI: BUSINESS OVERVIEW
                       TABLE 115 IVANTI: PRODUCTS/SOLUTIONS/SERVICES OFFERED
                       TABLE 116 IVANTI: PRODUCT LAUNCHES AND ENHANCEMENTS
                       TABLE 117 IVANTI: DEALS
             13.1.10 CATO NETWORKS
                       TABLE 118 CATO NETWORKS: BUSINESS OVERVIEW
                       TABLE 119 CATO NETWORKS: PRODUCTS/SOLUTIONS/SERVICES OFFERED
                       TABLE 120 CATO NETWORKS: DEALS
             13.1.11 ARYAKA NETWORKS
                       TABLE 121 ARYAKA NETWORKS: BUSINESS OVERVIEW
                       TABLE 122 ARYAKA NETWORKS: PRODUCTS/SOLUTIONS/SERVICES OFFERED
                       TABLE 123 ARYAKA NETWORKS: DEALS
             13.1.12 SAILPOINT
                       TABLE 124 SAILPOINT: BUSINESS OVERVIEW
                       TABLE 125 SAILPOINT: PRODUCTS/SOLUTIONS/SERVICES OFFERED
                       TABLE 126 SAILPOINT: DEALS
     13.2 OTHER PLAYERS 
             13.2.1 APPNOVI
             13.2.2 APPGATE
             13.2.3 MESH SECURITY
             13.2.4 PERIMETER 81
             13.2.5 NAORIS PROTOCOL
             13.2.6 EXIUM
(Business Overview, Products/Solutions/Services offered, Recent Developments, MnM View)*
 
14 APPENDIX (Page No. - 171)
     14.1 ADJACENT MARKETS 
               TABLE 127 ADJACENT MARKETS AND FORECAST
     14.2 LIMITATIONS 
             14.2.1 ZERO TRUST SECURITY MARKET
                       TABLE 128 ZERO TRUST SECURITY MARKET SIZE AND GROWTH, 2016–2021 (USD MILLION)
                       TABLE 129 ZERO TRUST SECURITY MARKET SIZE AND GROWTH, 2022–2027 (USD MILLION)
                       TABLE 130 ZERO TRUST SECURITY MARKET, BY SOLUTION TYPE, 2016–2021 (USD MILLION)
                       TABLE 131 ZERO TRUST SECURITY MARKET, BY SOLUTION TYPE, 2022–2027 (USD MILLION)
                       TABLE 132 ZERO TRUST SECURITY MARKET, BY DEPLOYMENT MODE, 2016–2021 (USD MILLION)
                       TABLE 133 ZERO TRUST SECURITY MARKET, BY DEPLOYMENT MODE, 2022–2027 (USD MILLION)
                       TABLE 134 ZERO TRUST SECURITY MARKET, BY ORGANIZATION SIZE, 2016–2021 (USD MILLION)
                       TABLE 135 ZERO TRUST SECURITY MARKET, BY ORGANIZATION SIZE, 2022–2027 (USD MILLION)
                       TABLE 136 ZERO TRUST SECURITY MARKET, BY VERTICAL, 2016–2021 (USD MILLION)
                       TABLE 137 ZERO TRUST SECURITY MARKET, BY VERTICAL, 2022–2027 (USD MILLION)
                       TABLE 138 ZERO TRUST SECURITY MARKET, BY REGION, 2016–2021 (USD MILLION)
                       TABLE 139 ZERO TRUST SECURITY MARKET, BY REGION, 2022–2027 (USD MILLION)
             14.2.2 SECURE ACCESS SERVICE EDGE MARKET
                       TABLE 140 SECURE ACCESS SERVICE EDGE MARKET, BY OFFERING, 2016–2020 (USD MILLION)
                       TABLE 141 SECURE ACCESS SERVICE EDGE MARKET, BY OFFERING 2021–2026 (USD MILLION)
                       TABLE 142 SECURE ACCESS SERVICE EDGE MARKET, BY ORGANIZATION SIZE, 2016–2020 (USD MILLION)
                       TABLE 143 SECURE ACCESS SERVICE EDGE MARKET, BY ORGANIZATION SIZE, 2021–2026 (USD MILLION)
                       TABLE 144 SECURE ACCESS SERVICE EDGE MARKET, BY VERTICAL, 2016–2020 (USD MILLION)
                       TABLE 145 SECURE ACCESS SERVICE EDGE MARKET, BY VERTICAL, 2021–2026 (USD MILLION)
                       TABLE 146 SECURE ACCESS SERVICE EDGE MARKET, BY REGION, 2016–2020 (USD MILLION)
                       TABLE 147 SECURE ACCESS SERVICE EDGE MARKET, BY REGION, 2021–2026 (USD MILLION)
             14.2.3 DECENTRALIZED IDENTITY MARKET
                       TABLE 148 DECENTRALIZED IDENTITY MARKET SIZE AND GROWTH, 2019–2026 (USD MILLION, Y-O-Y %)
                       TABLE 149 DECENTRALIZED IDENTITY MARKET, BY IDENTITY TYPE, 2019–2027 (USD MILLION)
                       TABLE 150 DECENTRALIZED IDENTITY MARKET, BY END USER, 2019–2027 (USD MILLION)
                       TABLE 151 DECENTRALIZED IDENTITY MARKET, BY ORGANIZATION SIZE, 2019–2027 (USD MILLION)
                       TABLE 152 DECENTRALIZED IDENTITY MARKET, BY VERTICAL, 2019–2027 (USD MILLION)
                       TABLE 153 DECENTRALIZED IDENTITY MARKET, BY REGION, 2019–2027 (USD MILLION)
     14.3 DISCUSSION GUIDE 
     14.4 KNOWLEDGESTORE: MARKETSANDMARKETS' SUBSCRIPTION PORTAL 
     14.5 CUSTOMIZATION OPTIONS 
     14.6 RELATED REPORTS 
     14.7 AUTHOR DETAILS 

The study involved major activities in estimating the current market size of the cybersecurity mesh market. Exhaustive secondary research was done to collect information on the cybersecurity mesh industry. The next step was to validate these findings, assumptions, and sizing with industry experts across the value chain using primary research. Different approaches, such as top-down, bottom-up, etc., were employed to estimate the total market size. After that, the market breakup and data triangulation procedures were used to estimate the market size of the segments and sub-segments of the cybersecurity mesh market.

Secondary Research

In the secondary research process, various secondary sources were referred to, for identifying and collecting information related to the study. Secondary sources included annual reports, press releases, and investor presentations of cybersecurity mesh vendors, forums, certified publications, and whitepapers. The secondary research was used to obtain critical information on the industry's value chain, the total pool of key players, market classification, and segmentation from the market and technology-oriented perspectives. The factors considered for estimating regional level market size include gross domestic product growth, ICT security spending, recent market developments, technology adoption, and adoption of adjacent markets such as the zero trust security market, SASE market, and decentralized identity market.

Primary Research

Various primary sources from both supply and demand sides were interviewed to obtain qualitative and quantitative information for this report in the primary research process. The primary sources from the supply side included various industry experts, including Chief Executive Officers (CEOs), Vice Presidents (VPs), marketing directors, technology and innovation directors, and related key executives from various key companies and organizations operating in the Cybersecurity Mesh market.

Following is the breakup of primary respondents:
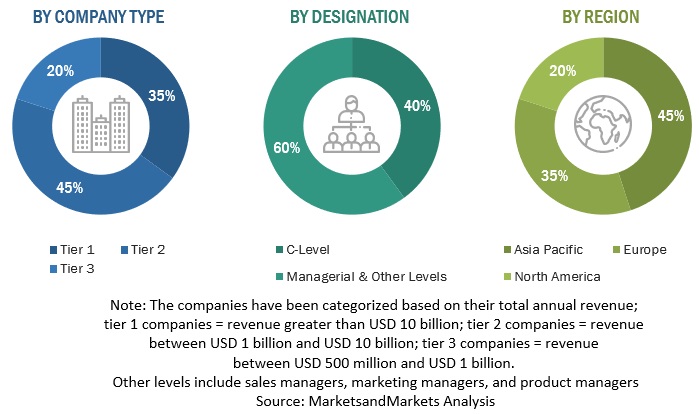
Cybersecurity Mesh Market Size, and Share

To know about the assumptions considered for the study, download the pdf brochure

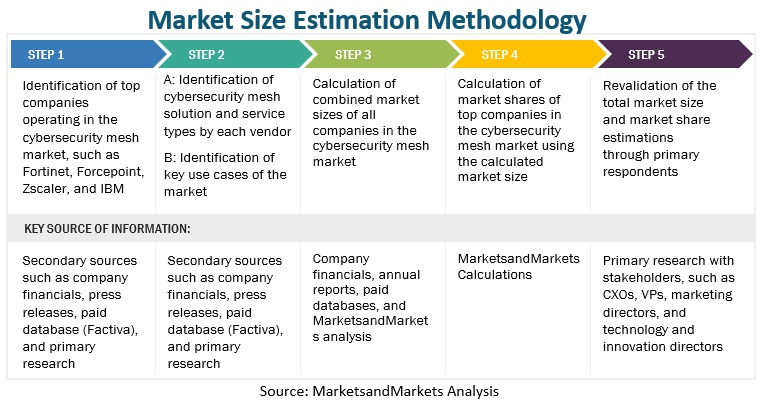
Cybersecurity Mesh Market Size Estimation

Cybersecurity Mesh Market Size Estimation

To know about the assumptions considered for the study, Request for Free Sample Report

Multiple approaches were adopted to estimate and forecast the size of the cybersecurity mesh market. In the market engineering process, the top-down and bottom-up approaches were extensively used, along with several data triangulation methods, to perform the market estimation and market forecasting for the overall market segments and sub-segments listed in this report. Extensive qualitative and quantitative analyses were performed on the complete market engineering process to list key information/insights throughout the report. This entire procedure included the study of the annual and financial reports of top market players and extensive interviews for key insights from industry leaders, such as CEOs, VPs, directors, and marketing executives. All percentage splits and breakups were determined using secondary sources and verified through primary sources. All possible parameters that affect the market covered in this research study have been accounted for, viewed in extensive detail, verified through primary research, and analyzed to get the final quantitative and qualitative data. This data is consolidated and added to detailed inputs and analysis from MarketsandMarkets.

Data Triangulation

After arriving at the overall market size using the market size estimation processes, as explained above, the market was split into several segments and subsegments. The data triangulation and market breakup procedures were employed, wherever applicable, to complete the overall market engineering process and arrive at the exact statistics of each market segment and sub-segments. The data was triangulated by studying various factors and trends from the demand and supply sides.

Report Objectives

  • To describe and forecast the global cybersecurity mesh market by layers, offering, deployment mode, organization size, vertical, and region
  • To predict the market size of four main regions: North America, Europe, Asia Pacific (APAC), and Rest of World (ROW)
  • To analyze the subsegments of the market concerning individual growth trends, prospects, and contributions to the overall market
  • To provide detailed information related to significant factors (drivers, restraints, opportunities, and challenges) influencing the growth of the market
  • To analyze the opportunities in the market for stakeholders and provide the competitive landscape details of major players
  • To profile the key players of the cybersecurity mesh market and comprehensively analyze their market shares and core competencies
  • To track and analyze competitive developments, such as mergers and acquisitions (M&A), new product developments, partnerships, and collaborations in the market

Customization Options

With the given market data, MarketsandMarkets offers customizations based on company-specific needs. The following customization options are available for the report:

Geographic Analysis

  • Further breakup of the Asia Pacific market into countries contributing 75% to the regional market size
  • Further breakup of the North American market into countries contributing 75% to the regional market size
  • Further breakup of the Latin American market into countries contributing 75% to the regional market size
  • Further breakup of the Middle Eastern and African market into countries contributing 75% to the regional market size
  • Further breakup of the European market into countries contributing 75% to the regional market size

Company Information

  • Detailed analysis and profiling of additional market players (up to 5)
Custom Market Research Services

We will customize the research for you, in case the report listed above does not meet with your exact requirements. Our custom research will comprehensively cover the business information you require to help you arrive at strategic and profitable business decisions.

Request Customization

Instant Answers with GPT - Ask Now!

Ask real questions. Get complete answers !
Report Code
TC 8583
Published ON
Feb, 2023
Choose License Type
BUY NOW
  • SHARE
X
Request Customization
Speak to Analyst
Speak to Analyst
OR FACE-TO-FACE MEETING
PERSONALIZE THIS RESEARCH
  • Triangulate with your Own Data
  • Get Data as per your Format and Definition
  • Gain a Deeper Dive on a Specific Application, Geography, Customer or Competitor
  • Any level of Personalization
REQUEST A FREE CUSTOMIZATION
LET US HELP YOU!
  • What are the Known and Unknown Adjacencies Impacting the Cybersecurity Mesh Market
  • What will your New Revenue Sources be?
  • Who will be your Top Customer; what will make them switch?
  • Defend your Market Share or Win Competitors
  • Get a Scorecard for Target Partners
CUSTOMIZED WORKSHOP REQUEST
  • Call Us
  • +1-888-600-6441 (Corporate office hours)
  • +1-888-600-6441 (US/Can toll free)
  • +44-800-368-9399 (UK office hours)
CONNECT WITH US
ABOUT TRUST ONLINE
©2024 MarketsandMarkets Research Private Ltd. All rights reserved
DMCA.com Protection Status Website Feedback