Data Bus Market by Protocol (MIL-STD-1553, AFDX/ARINC 664, ARINC 429/629, CAN, TTP), Application (Marine, Commercial Aviation, Military Aviation, Automotive), Component (Micro couplers, Cables, Connectors, Accessories), and Region - Global Forecast to 2036


Data Bus Market Summary
The global Data Bus Market is experiencing steady expansion as aerospace, defense, automotive, industrial automation, and transportation industries increasingly rely on high-speed, secure, and reliable communication systems for mission-critical operations. Data bus systems enable seamless communication between electronic components, sensors, controllers, avionics, and onboard computers, making them an essential part of modern connected platforms. Growing investments in digital transformation, Industry 4.0, autonomous systems, AI-powered analytics, and IoT-enabled infrastructure are significantly accelerating the adoption of advanced data bus architectures across commercial and defense sectors.
The Data Bus Market is estimated at approximately USD 2–3 billion in 2026 and is projected to reach USD 5–6 billion by 2036, registering a CAGR of 8%–10% during the forecast period. Increasing aircraft production, military modernization programs, electric vehicle development, smart manufacturing initiatives, and next-generation industrial automation continue to create substantial growth opportunities. The integration of artificial intelligence, cloud computing, edge processing, and predictive maintenance platforms is transforming traditional data bus networks into intelligent communication ecosystems capable of supporting real-time decision-making and high-speed digital operations.
Key Market Trends & Insights
-
North America dominates the global Data Bus Market due to strong aerospace, defense, and industrial automation investments.
-
Asia Pacific is projected to register the fastest growth driven by expanding manufacturing industries and increasing defense procurement.
-
MIL-STD-1553 and Ethernet-based data bus systems remain the dominant product categories across aerospace and defense applications.
-
AI-enabled diagnostics, predictive maintenance, and intelligent network management are emerging technology trends.
-
High-speed Ethernet, fiber optic communication, Time-Sensitive Networking (TSN), and deterministic networking are reshaping industrial communication systems.
-
IoT-enabled smart factories and autonomous platforms are significantly increasing demand for advanced data bus technologies.
Market Size & Forecast
-
Base Year Market Size (2026): USD 2–3 Billion
-
Forecast Market Size (2036): USD 5–6 Billion
-
Expected CAGR (2026–2036): 8%–10%
-
Market growth is supported by expanding aerospace production, digital manufacturing, industrial automation, autonomous vehicles, AI-enabled communication systems, and increasing demand for high-speed data transmission.
Data Bus Market Top 10 Key Takeaway
-
North America remains the largest regional market.
-
Asia Pacific represents the fastest-growing region.
-
Aerospace and defense account for the largest application share.
-
Ethernet-based data bus solutions continue gaining market share.
-
AI-powered diagnostics improve network reliability.
-
Industrial automation accelerates demand for deterministic communication.
-
IoT integration enhances operational visibility.
-
Autonomous platforms create new market opportunities.
-
Military modernization programs support long-term growth.
-
Cloud-connected communication architectures are transforming system capabilities.
Product Insights
The Data Bus Market is segmented into MIL-STD-1553 data buses, ARINC data buses, CAN Bus, Ethernet-based buses, Fiber Optic Data Bus Systems, SpaceWire, RapidIO, and proprietary high-speed communication buses. Among these, MIL-STD-1553 and Ethernet-based data buses collectively account for the largest market share due to their widespread adoption across commercial aviation, military aircraft, naval platforms, and defense communication systems.
MIL-STD-1553 remains a preferred communication protocol for mission-critical aerospace applications because of its exceptional reliability, deterministic communication capability, fault tolerance, and proven operational performance. Commercial aircraft increasingly integrate ARINC-based communication networks for avionics interoperability, while Ethernet-based solutions continue expanding due to higher bandwidth requirements generated by digital cockpits, autonomous flight technologies, and aircraft health monitoring systems.
Fiber optic data bus solutions are emerging rapidly as industries seek higher transmission speeds, improved cybersecurity, electromagnetic interference resistance, and lightweight communication architectures. In industrial automation, CAN Bus continues to dominate factory automation, robotics, heavy machinery, and automotive electronics owing to its cost-effectiveness and real-time communication capability.
Artificial intelligence is further enhancing product performance through intelligent traffic management, automated fault isolation, predictive diagnostics, and adaptive communication routing. Manufacturers are increasingly integrating embedded processors capable of supporting edge analytics and autonomous network optimization.
Technology / Component Insights
Communication Technology & Component Insights
Technological innovation remains the primary growth engine for the Data Bus Market. High-speed serial communication protocols, deterministic Ethernet, Time-Sensitive Networking (TSN), fiber optic communication, and intelligent communication controllers are enabling increasingly sophisticated digital ecosystems across aerospace, automotive, industrial automation, and defense applications.
Artificial intelligence is playing an expanding role in network management by continuously monitoring communication quality, identifying anomalies, predicting component failures, and automatically rerouting data traffic when communication disruptions occur. AI-powered diagnostics significantly reduce maintenance costs while improving operational reliability.
IoT connectivity enables real-time communication between distributed sensors, actuators, embedded controllers, and cloud-based analytics platforms. Modern smart factories rely heavily on interconnected communication buses capable of supporting thousands of simultaneously connected industrial devices.
Cloud computing complements onboard communication systems by enabling centralized monitoring, digital twins, predictive maintenance, fleet-wide performance optimization, and remote software updates. Automation technologies further enhance communication efficiency by dynamically allocating network bandwidth based on operational priorities.
Future innovations are expected to include quantum-resistant cybersecurity protocols, software-defined networking, edge AI processors, wireless deterministic communication systems, and ultra-low latency industrial Ethernet architectures capable of supporting next-generation autonomous operations.
Application Insights
Aerospace and defense continue to represent the largest application segment within the Data Bus Market, driven by increasing aircraft production, avionics modernization, military communication upgrades, satellite systems, and autonomous defense platforms. Reliable real-time communication remains essential for flight control systems, navigation equipment, surveillance systems, radar integration, weapons management, and mission computers.
Industrial automation is another rapidly expanding application area as manufacturers accelerate digital transformation initiatives. Modern factories increasingly require deterministic communication between robotic systems, programmable logic controllers (PLCs), industrial sensors, automated guided vehicles (AGVs), and manufacturing execution systems.
The automotive sector is experiencing significant demand for advanced data bus architectures due to growing adoption of electric vehicles, autonomous driving technologies, advanced driver assistance systems (ADAS), and intelligent vehicle communication networks.
Rail transportation, marine systems, healthcare equipment, and energy infrastructure also represent promising application areas where reliable communication networks enable improved operational efficiency, safety, and predictive maintenance capabilities.
As autonomous systems continue expanding across industries, demand for secure, low-latency, AI-enabled communication networks is expected to increase substantially throughout the forecast period.
Regional Insights
North America currently dominates the global Data Bus Market, supported by its well-established aerospace and defense ecosystem, advanced manufacturing capabilities, and continuous investments in digital technologies. The presence of major aircraft manufacturers, defense contractors, semiconductor companies, and industrial automation providers contributes significantly to regional leadership. Government investments in military modernization and smart manufacturing initiatives continue strengthening market growth.
Europe maintains a strong market position owing to its advanced automotive industry, commercial aerospace manufacturing, Industry 4.0 adoption, and stringent industrial communication standards. Countries across the region continue investing in intelligent manufacturing systems, electric mobility, and digital industrial infrastructure.
Asia Pacific is expected to register the fastest CAGR during the forecast period due to expanding manufacturing sectors, increasing aircraft production, government-led industrial modernization programs, and rising investments in defense technologies. China, Japan, South Korea, and India continue strengthening domestic electronics manufacturing and industrial automation capabilities.
Latin America and the Middle East are gradually expanding their adoption of advanced communication systems as infrastructure modernization and industrial digitalization initiatives gain momentum.
Regional Insights Summary
-
North America leads overall market revenue.
-
Asia Pacific records the highest forecast CAGR.
-
Europe remains a major industrial automation hub.
-
Aerospace investments continue driving regional demand.
-
Smart manufacturing accelerates communication technology adoption.
Country-Specific Market Trends
China (CAGR: 10%–11%) continues expanding domestic electronics manufacturing, aerospace production, and industrial automation through government-supported smart manufacturing initiatives. Increasing investments in autonomous vehicles and industrial IoT further stimulate demand for advanced communication systems.
Japan (CAGR: 8%–9%) remains a technology leader in robotics, factory automation, automotive electronics, and semiconductor manufacturing. Strong adoption of AI-powered industrial systems supports continued market growth.
United States (CAGR: 8%–9%) maintains global leadership through large-scale investments in aerospace, defense, cloud computing, industrial automation, and next-generation avionics communication systems.
Canada (CAGR: 7%–8%) experiences steady growth driven by aerospace manufacturing, defense modernization, industrial digitalization, and transportation infrastructure development.
Mexico (CAGR: 7%–8%) benefits from expanding automotive manufacturing, electronics production, and industrial automation investments supported by international manufacturing partnerships.
Germany (CAGR: 7%–8%) remains Europe's industrial automation leader through extensive Industry 4.0 deployment, advanced manufacturing technologies, and automotive innovation.
France (CAGR: 7%–8%) continues investing in aerospace manufacturing, railway modernization, defense communication technologies, and smart industrial infrastructure.
Country-Level Insights Summary
-
China remains the fastest-growing national market.
-
Japan advances AI-driven industrial communication technologies.
-
The United States leads aerospace and defense innovation.
-
Germany strengthens Industry 4.0 communication infrastructure.
-
France expands digital aerospace and manufacturing capabilities.
Key Data Bus Market Company Insights
Competition within the Data Bus Market is characterized by continuous innovation in high-speed communication technologies, deterministic networking, AI-enabled diagnostics, cybersecurity, and integrated avionics solutions. Companies are increasingly investing in software-defined communication platforms, intelligent network controllers, cloud connectivity, and edge computing technologies to strengthen their competitive positioning.
Major market participants include TE Connectivity, Amphenol Corporation, Curtiss-Wright Corporation, Collins Aerospace, Honeywell Aerospace, TTTech Computertechnik AG, North Atlantic Industries, Astronics Corporation, Data Device Corporation (DDC), and Ballard Technology Inc.
These companies continue focusing on product innovation, strategic acquisitions, AI-enabled communication management, embedded cybersecurity, and high-speed Ethernet technologies to address evolving customer requirements across aerospace, defense, transportation, and industrial automation sectors.
Company Strategy Summary
-
Continuous investment in high-speed Ethernet technologies.
-
AI-powered diagnostics improve communication reliability.
-
Expansion of deterministic networking solutions.
-
Strategic partnerships strengthen industrial automation portfolios.
-
Embedded cybersecurity remains a major product differentiator.
Recent Developments
-
Several aerospace communication suppliers introduced next-generation Time-Sensitive Networking (TSN)-enabled Ethernet data bus solutions designed to support advanced avionics and autonomous aircraft systems.
-
Industrial automation companies launched AI-powered network monitoring software capable of predicting communication failures and optimizing industrial data traffic in real time.
-
Leading communication technology providers announced strategic partnerships with semiconductor manufacturers to develop high-speed embedded communication processors supporting next-generation autonomous platforms.
Market Segmentation
The Data Bus Market is segmented by Product, Technology/Component, Application, and Region. By product, the market comprises MIL-STD-1553, ARINC, CAN Bus, Ethernet, Fiber Optic Data Bus, SpaceWire, and other high-speed communication protocols. Ethernet-based architectures are gaining momentum due to increasing bandwidth requirements across connected systems.
By technology and component, the market includes communication controllers, interface modules, transceivers, processors, switches, embedded software, fiber optic components, and AI-enabled communication management platforms. Integration of cloud computing, IoT connectivity, cybersecurity, and edge computing continues driving technological advancement.
By application, aerospace and defense remain the largest segment, followed by industrial automation, automotive, railway transportation, marine systems, healthcare equipment, and energy infrastructure. Growing adoption of autonomous systems is expected to further diversify market opportunities.
Regionally, North America leads the market, Europe maintains strong industrial demand, Asia Pacific demonstrates the highest growth rate, while Latin America and the Middle East continue expanding digital infrastructure investments.
Segmentation Summary
-
MIL-STD-1553 and Ethernet dominate product adoption.
-
AI-enabled communication controllers drive innovation.
-
Aerospace remains the largest application segment.
-
Asia Pacific delivers the fastest forecast growth.
-
Industrial automation creates long-term growth opportunities.
Conclusion
The global Data Bus Market is expected to maintain robust growth through 2036, supported by increasing digital transformation across aerospace, defense, automotive, transportation, and industrial automation industries. Artificial intelligence, IoT, cloud computing, edge processing, and deterministic networking are fundamentally transforming communication architectures into intelligent, highly reliable, and self-optimizing ecosystems.
As organizations continue investing in autonomous systems, connected infrastructure, smart manufacturing, and digital aviation, advanced data bus technologies will become increasingly critical for ensuring secure, real-time communication between complex electronic systems. Companies focusing on AI integration, high-speed networking, embedded cybersecurity, and next-generation communication standards will be well positioned to capitalize on the expanding opportunities within the global Data Bus Market.
FAQs
1. What is the current Data Bus Market size?
The global Data Bus Market is estimated at USD 2–3 billion in 2026.
2. What is the expected growth rate of the Data Bus Market?
The market is projected to grow at a CAGR of 8%–10% from 2026 to 2036.
3. What are the major drivers of the Data Bus Market?
Key drivers include aerospace modernization, industrial automation, AI integration, IoT adoption, autonomous systems, digital manufacturing, and increasing demand for high-speed, reliable communication networks.
4. Which region dominates the Data Bus Market?
North America currently leads the market, while Asia Pacific is expected to witness the fastest growth during the forecast period.
5. Who are the leading companies in the Data Bus Market?
Major companies include TE Connectivity, Amphenol Corporation, Curtiss-Wright Corporation, Collins Aerospace, Honeywell Aerospace, TTTech Computertechnik AG, North Atlantic Industries, Astronics Corporation, Data Device Corporation (DDC), and Ballard Technology Inc.
 Exclusive indicates content/data unique to MarketsandMarkets and not available with any competitors.
Table of Contents
1 Introduction (Page No. - 16)
1.1 Objectives of the Study
1.2 Market Definition
1.3 Study Scope
1.3.1 Market Covered
1.3.2 Geographical Coverage
1.3.3 Years Considered for the Study
1.4 Currency & Pricing
1.5 Study Limitations
1.6 Market Shareholders
2 Research Methodology (Page No. - 20)
2.1 Research Data
2.1.1 Secondary Data
2.1.1.1 Key Data From Secondary Sources
2.1.2 Primary Data
2.1.2.1 Key Data From Primary Sources
2.1.2.2 Key Industry Insights
2.1.2.3 Breakdown of Primaries
2.2 Factor Analysis
2.2.1 Demand-Side Analysis
2.2.1.1 New Airline Business Models & Emerging Economies
2.2.2 Supply Side Analysis
2.2.2.1 Global It Spending
2.2.2.2 Aircraft Deliveries (2016-2035)
2.3 Market Size Estimation
2.3.1 Bottom-Up Approach
2.3.2 Top-Down Approach
2.4 Market Breakdown & Data Triangulation
2.5 Assumptions
3 Executive Summary (Page No. - 35)
3.1 Evolution of Military Data Bus
3.2 North America to Lead Data Bus Market
3.3 Can Protocol to Have Largest Market Share During Forecast Period
3.4 New Product Launches are the Key Focus to Cater to New Requirements Across Applications
4 Premium Insights (Page No. - 41)
4.1 Increasing Global Demand for Data Bus
4.2 Data Bus Market Size, By Protocol, 2016 & 2021
4.3 Market Size, By Application, 2016 & 2021
4.4 Market Size, By Component, 2016 & 2021
4.5 Market Share and Growth Analysis, By Region
4.6 Life Cycle Analysis, By Region
5 Market Overview (Page No. - 44)
5.1 Introduction
5.2 Market Segmentation
5.2.1 By Protocol
5.2.2 By Application
5.2.3 By Component
5.2.4 By Region
5.3 Evolution of Data Bus Protocols
5.4 Market Dynamics
5.4.1 Drivers
5.4.1.1 Need to Reduce Swap Specifications
5.4.1.2 Increase in Commercial Aircraft Deliveries
5.4.1.3 Need for Data Integrity & Reliability
5.4.1.4 Need for Acquisition of Flight Data Units
5.4.1.5 Need to Reduce Wiring in Aircraft
5.4.1.6 Telematics
5.4.1.7 Modernization of Military Aircraft
5.4.1.8 Intensive Electrification in Automotive, Commercial Aviation, and Maritime Applications
5.4.2 Restraints
5.4.2.1 Defense Budget Cuts
5.4.2.2 Product Life Cycle
5.4.3 Challenges
5.4.3.1 Increasing Bandwidth
5.4.3.2 Certification Process
5.4.4 Opportunities
5.4.4.1 Glass Cockpits
5.4.4.2 Luxury Car Segment
5.4.5 Burning Issues
5.4.5.1 Safety Critical AFDX
5.4.5.2 Evolution of Mil-Std 1553
5.4.6 Wining Imperative
5.4.6.1 Developing Cost-Efficient Data Bus
6 Industry Trends (Page No. - 55)
6.1 Introduction
6.2 Supply Chain Analysis
6.3 Value Chain Analysis
6.4 Industry Trends
6.5 Strategic Benchmarking
6.5.1 Technological Integration & Product Enhancement
6.6 Technology Trends
6.6.1 Fiber Optic Cables Over Copper Cables
6.6.2 Ethernet
6.6.3 Distributed Architecture
6.6.4 Emerging TTP to As6802
6.6.5 Flexray as an Emerging Automotive Protocol
6.6.6 Fly-By-Optics
6.6.7 Lightweight Data Bus Cables
7 Data Bus Market, By Component (Page No. - 63)
7.1 Introduction
7.2 Micro Couplers
7.3 Cables
7.4 Connectors
7.5 Accessories
8 Data Bus Market, By Application (Page No. - 70)
8.1 Introduction
8.2 Marine
8.3 Commercial Aviation
8.4 Military Aviation
8.5 Automotive
9 Data Bus Market, By Protocol (Page No. - 78)
9.1 Introduction
9.2 Arinc 429/629
9.3 Can
9.4 TTP
9.5 AFDX/Arinc 664
9.6 Mil-Std 1553
9.6.1 Factors Influencing the Growth of the Mil-Std 1553 Segment in the Data Bus Market
10 Data Bus Market, By Region (Page No. - 83)
10.1 Introduction
10.2 North America
10.2.1 By Protocol
10.2.2 By Application
10.2.3 By Component
10.2.4 By Country
10.2.4.1 U.S.
10.2.4.1.1 By Protocol
10.2.4.1.2 By Application
10.2.4.1.3 By Component
10.2.4.2 Canada
10.2.4.2.1 By Protocol
10.2.4.2.2 By Application
10.2.4.2.3 By Component
10.3 Europe
10.3.1 By Protocol
10.3.2 By Application
10.3.3 By Component
10.3.4 By Country
10.3.4.1 U.K.
10.3.4.1.1 By Protocol
10.3.4.1.2 By Application
10.3.4.1.3 By Component
10.3.4.2 Russia
10.3.4.2.1 By Protocol
10.3.4.2.2 By Application
10.3.4.2.3 By Component
10.3.4.3 France
10.3.4.3.1 By Protocol
10.3.4.3.2 By Application
10.3.4.3.3 By Component
10.3.4.4 Germany
10.3.4.4.1 By Protocol
10.3.4.4.2 By Application
10.3.4.4.3 By Component
10.4 Asia-Pacific
10.4.1 By Protocol
10.4.2 By Application
10.4.3 By Component
10.4.4 By Country
10.4.4.1 China
10.4.4.1.1 By Protocol
10.4.4.1.2 By Application
10.4.4.1.3 By Component
10.4.4.2 India
10.4.4.2.1 By Protocol
10.4.4.2.2 By Application
10.4.4.2.3 By Component
10.4.4.3 South Korea
10.4.4.3.1 By Protocol
10.4.4.3.2 By Application
10.4.4.3.3 By Component
10.4.4.4 Japan
10.4.4.4.1 By Protocol
10.4.4.4.2 By Application
10.4.4.4.3 By Component
10.5 The Middle East
10.5.1 By Protocol
10.5.2 By Application
10.5.3 By Component
10.5.4 By Country
10.5.4.1 Saudi Arabia
10.5.4.1.1 By Protocol
10.5.4.1.2 By Application
10.5.4.1.3 By Component
10.5.4.2 U.A.E.
10.5.4.2.1 By Protocol
10.5.4.2.2 By Application
10.5.4.2.3 By Component
10.6 Rest of the World (RoW)
10.6.1 By Protocol
10.6.2 By Application
10.6.3 By Component
10.6.4 By Country
10.6.4.1 Brazil
10.6.4.1.1 By Protocol
10.6.4.1.2 By Application
10.6.4.1.3 By Component
10.6.4.2 South Africa
10.6.4.2.1 By Protocol
10.6.4.2.2 By Application
10.6.4.2.3 By Component
11 Competitive Landscape (Page No. - 131)
11.1 Overview
11.2 Market Share Analysis, By Company
11.3 Regional Market Share Analysis
11.4 Competitive Situation & Trends
11.4.1 New Product Launches & Developments
11.4.2 Agreements
11.4.3 Acquisitions
11.4.4 Contracts
11.4.5 Partnerships
11.4.6 Other Developments
12 Company Profiles (Page No. - 143)
12.1 Introduction
12.2 Financial Highlights of Key Players
(Business Overview, Products & Services, Key Insights, Recent Developments, SWOT Analysis, Ratio Analysis, MnM View)*
12.3 TE Connectivity Ltd.
12.4 Amphenol Corporation
12.5 Fujikura Ltd.
12.6 Esterline Technologies Corporation
12.7 Corning Inc.
12.8 Rockwell Collins
12.9 Nexans SA
12.10 Astronics Corporation
12.11 Data Device Corporation
12.12 Optical Cable Corporation
12.13 Huber+Suhner AG
*Details on Business Overview, Products & Services, Key Insights, Recent Developments, SWOT Analysis, MnM View Might Not Be Captured in Case of Unlisted Companies.
13 Appendix (Page No. - 176)
13.1 Discussion Guide
13.2 Knowledge Store: Marketsandmarkets’ Subscription Portal
13.3 Introducing RT: Real Time Market Intelligence
13.4 Available Customizations
13.5 Related Reports
List of Tables (95 Tables)
Table 1 Key Growth Factors of Data Bus Market
Table 2 Long Product Life Cycle: A Key Restraint for Growth of the Market
Table 3 Obtaining Mandatory Data Bus Certifications: A Challenge
Table 4 Automotive Industry Paving Favorable Avenues in the Market
Table 5 Emerging Trends in Market
Table 6 Global Data Bus Market Size, By Component, 2014-2021 (USD Million)
Table 7 Micro Couplers: Market Size, By Region, 2014-2021 (USD Million)
Table 8 Cables: Data Bus Market Size, By Region, 2014-2021 (USD Million)
Table 9 Connectors: Market Size, By Region, 2014-2021 (USD Million)
Table 10 Accessories: Data Bus Market Size, By Region, 2014-2021 (USD Million)
Table 11 Data Bus Market Size, By Application, 2014-2021 (USD Million)
Table 12 Market Size, By Protocol, 2014-2021 (USD Million)
Table 13 Market Size, By Region, 2014-2021 (USD Million)
Table 14 North America: Data Bus Market Size, By Protocol, 2014-2021 (USD Million)
Table 15 North America: Market Size, By Application, 2014-2021 (USD Million)
Table 16 North America: Market Size, By Component, 2014-2021 (USD Million)
Table 17 North America: Market Size, By Country, 2014-2021 (USD Million)
Table 18 U.S.: Market Landscape (2015)
Table 19 U.S.: Data Bus Market Size, By Protocol, 2014-2021 (USD Million)
Table 20 U.S.: Market Size, By Application, 2014-2021 (USD Million)
Table 21 U.S.: Market Size, By Component, 2014-2021 (USD Million)
Table 22 Canada: Market Landscape (2015)
Table 23 Canada: Data Bus Market Size, By Protocol, 2014-2021 (USD Million)
Table 24 Canada: Market Size, By Application, 2014-2021 (USD Million)
Table 25 Canada: Market Size, By Component, 2014-2021 (USD Million)
Table 26 Europe: Data Bus Market Size, By Protocol, 2014-2021 (USD Million)
Table 27 Europe: Market Size, By Application, 2014-2021 (USD Million)
Table 28 Europe: Market Size, By Component, 2014-2021 (USD Million)
Table 29 Europe: Market Size, By Country, 2014-2021 (USD Million)
Table 30 U.K.: Market Landscape (2015)
Table 31 U.K.: Data Bus Market Size, By Protocol, 2014-2021 (USD Million)
Table 32 U.K.: Market Size, By Application, 2014-2021 (USD Million)
Table 33 U.K.: Market Size, By Component, 2014-2021 (USD Million)
Table 34 Russia: Market Landscape (2015)
Table 35 Russia: Data Bus Market Size, By Protocol, 2014-2021 (USD Million)
Table 36 Russia: Market Size, By Application, 2014-2021 (USD Million)
Table 37 Russia: Market Size, By Component, 2014-2021 (USD Million)
Table 38 France: Market Landscape (2015)
Table 39 France: Data Bus Market Size, By Protocol, 2014-2021 (USD Million)
Table 40 France: Market Size, By Application, 2014-2021 (USD Million)
Table 41 France: Market Size, By Component, 2014-2021 (USD Million)
Table 42 Germany: Market Landscape (2015)
Table 43 Germany: Data Bus Market Size, By Protocol, 2014-2021 (USD Million)
Table 44 Germany: Market Size, By Application, 2014-2021 (USD Million)
Table 45 Germany: Market Size, By Component, 2014-2021 (USD Million)
Table 46 Asia-Pacific: Data Bus Market Size, By Protocol, 2014-2021 (USD Million)
Table 47 Asia-Pacific: Market Size, By Application, 2014-2021 (USD Million)
Table 48 Asia-Pacific: Market Size, By Component, 2014-2021 (USD Million)
Table 49 Asia-Pacific: Market Size, By Country, 2014-2021 (USD Million)
Table 50 China: Market Landscape (2015)
Table 51 China: Data Bus Market Size, By Protocol, 2014-2021 (USD Million)
Table 52 China: Market Size, By Application, 2014-2021 (USD Million)
Table 53 China: Market Size, By Component, 2014-2021 (USD Million)
Table 54 India: Market Landscape (2015)
Table 55 India: Data Bus Market Size, By Protocol, 2014-2021 (USD Million)
Table 56 India: Market Size, By Application, 2014-2021 (USD Million)
Table 57 India: Market Size, By Component, 2014-2021 (USD Million)
Table 58 South Korea: Market Landscape (2015)
Table 59 South Korea: Data Bus Market Size, By Protocol, 2014-2021 (USD Million)
Table 60 South Korea: Market Size, By Application, 2014-2021 (USD Million)
Table 61 South Korea: Market Size, By Component, 2014-2021 (USD Million)
Table 62 Japan: Market Landscape (2015)
Table 63 Japan: Data Bus Market Size, By Protocol, 2014-2021 (USD Million)
Table 64 Japan: Market Size, By Application, 2014-2021 (USD Million)
Table 65 Japan: Market Size, By Component, 2014-2021 (USD Million)
Table 66 Middle East: Data Bus Market Size, By Protocol, 2014-2021 (USD Million)
Table 67 Middle-East: Market Size, By Application, 2014-2021 (USD Million)
Table 68 Middle East: Market Size, By Component, 2014-2021 (USD Million)
Table 69 Middle East: Market Size, By Country, 2014-2021 (USD Million)
Table 70 Saudi Arabia: Market Landscape (2015)
Table 71 Saudi Arabia: Data Bus Market Size, By Protocol, 2014-2021 (USD Million)
Table 72 Saudi Arabia: Market Size, By Application,2014-2021 (USD Million)
Table 73 Saudi Arabia: Market Size, By Component, 2014-2021 (USD Million)
Table 74 U.A.E.: Market Landscape (2015)
Table 75 U.A.E.: Data Bus Market Size, By Protocol, 2014-2021 (USD Million)
Table 76 U.A.E.: Market Size, By Application, 2014-2021 (USD Million)
Table 77 U.A.E.: Market Size, By Component, 2014-2021 (USD Million)
Table 78 Rest of the World: Data Bus Market Size, By Protocol, 2014-2021 (USD Million)
Table 79 Rest of the World: Market Size, By Application, 2014-2021 (USD Million)
Table 80 Rest of the World: Market Size, By Component, 2014-2021 (USD Million)
Table 81 Rest of the World: Market Size, By Country, 2014-2021 (USD Million)
Table 82 Brazil: Market Landscape (2015)
Table 83 Brazil: Data Bus Market Size, By Protocol, 2014-2021 (USD Million)
Table 84 Brazil: Market Size, By Application, 2014-2021 (USD Million)
Table 85 Brazil: Market Size, By Component, 2014-2021 (USD Million)
Table 86 South Africa: Market Landscape (2015)
Table 87 South Africa: Data Bus Market Size, By Protocol, 2014-2021 (USD Million)
Table 88 South Africa: Market Size, By Application, 2014-2021 (USD Million)
Table 89 South Africa: Market Size, By Component, 2014-2021 (USD Million)
Table 90 New Product Launches & Developments, 2013-2016
Table 91 Agreements, 2013-2016
Table 92 Acquisitions, 2011-2016
Table 93 Contracts, 2011-2016
Table 94 Partnerships, 2013-2016
Table 95 Other Developments, 2010-2015
List of Figures (77 Figures)
Figure 1 Research Design
Figure 2 Military Spending Matrix, By Country, 2013
Figure 3 Annual Spending of U.S. Department of Defense to Decline By 2020
Figure 4 South Asia Accounts for the Highest Annual GDP Growth Rate in 2015
Figure 5 New Opportunities in Commercial Aviation By 2035
Figure 6 Global Premium Car Sales: China to Lead the Premium Car Market By 2020 (In Thousands Units)
Figure 7 Global Passenger Vehicle Sales 2010–2015
Figure 8 Global Automotive Sales, 2014-2015
Figure 9 Global It Spending, 2014–2016 (USD Billion)
Figure 10 Aircraft Deliveries, By Region, 2016-2035
Figure 11 Market Size Estimation Methodology: Bottom-Up Approach
Figure 12 Market Size Estimation Methodology: Top-Down Approach
Figure 13 Data Triangulation Methodology
Figure 14 Assumptions of the Research Study
Figure 15 Evolution of MIL-STD 1553 Data Bus
Figure 16 North America to Lead Data Bus Market, 2016 & 2021 (USD Billion)
Figure 17 Can Protocol to Lead Data Bus Market, 2016 & 2021(USD Billion)
Figure 18 Asia Pacific to Grow at the Highest CAGR During the Forecast Period
Figure 19 Asia Pacific to Emerge as A Lucrative Market for Data Bus
Figure 20 Data Bus Revenue Pockets
Figure 21 Acquisitions & New Product Launches Were the Key Growth Strategies Adopted By Top Players
Figure 22 Attractive Market Opportunities in the Market
Figure 23 Growth Opportunities for Can Protocol
Figure 24 Growth Opportunities for Market in Marine Application
Figure 25 Micro Couplers Segment to Witness High Growth Between 2016 and 2021
Figure 26 Untapped Data Bus Market in Asia-Pacific Region
Figure 27 Asia-Pacific Estimated to Witness Increased Growth By 2021
Figure 28 Data Bus Market, By Protocol
Figure 29 Market, By Application
Figure 30 Market, By Component
Figure 31 Data Bus Market, By Region
Figure 32 Evolution - 1970
Figure 33 Need to Reduce Swap Specifications Fueling the Growth of the Market
Figure 34 Data Bus Market: Supply Chain Analysis
Figure 35 Supply Chain of Hardware Components
Figure 36 Data Bus Market: Value Chain Analysis
Figure 37 Technological Integration & Product Enhancement
Figure 38 Russia, India, and China: Attractive Markets for Data Bus Components
Figure 39 The Micro Couplers Segment in Asia-Pacific is Projected to Grow at the Highest CAGR During the Forecast Period
Figure 40 Data Bus Cables Market, By Region (%)
Figure 41 Connectors Segment in North America to Lead the Market
Figure 42 Data Bus Accessories Market, By Region, 2016-2021 (USD Million)
Figure 43 Ship Deliveries, 2014-2021
Figure 44 Commercial Aircraft Deliveries, 2014-2021 (Units)
Figure 45 Data Bus Market for Fixed-Wing Aircraft to Hold Largest Share Between 2014 to 2021
Figure 46 Global Defense Spending, By Country, 2015
Figure 47 Average Age of Fixed-Wing Fleet for Southeast Asian Countries
Figure 48 Airborne and Land-Based Platforms to Occupy More Than Two-Thirds of the Market in the Military Aviation Sector By 2021
Figure 49 Global Automotive Industry Overview
Figure 50 Data Bus Market: Geographic Snapshot (2016-2021)
Figure 51 Russia, India, and China: Lucrative Markets for Data Bus
Figure 52 North America Data Bus Market Snapshot: the U.S. is Estimated to Account for the Largest Market Share in 2016
Figure 53 Europe Data Bus Market Snapshot: Russia Estimated to Account for the Largest Market Share in 2016
Figure 54 Asia-Pacific Data Bus Market Snapshot: China to Account for the Largest Market Share in 2016
Figure 55 Middle East Data Bus Market Snapshot: Saudi Arabia to Account for the Largest Market Share in 2016
Figure 56 Rest of the World Data Bus Market Snapshot: Brazil to Account for the Largest Market Share in 2016
Figure 57 Organic and Inorganic Growth Strategies Followed By Key Players in the Data Bus Market, 2011-2016
Figure 58 Market Share Analysis, 2015
Figure 59 Data Bus Market, By Region 2015
Figure 60 Strategic Acquisitions & New Product Developments are the Key Growth Strategies
Figure 61 Regional Revenue Mix of Top Players
Figure 62 Financial Highlights
Figure 63 TE Connectivity Ltd.: Company Snapshot
Figure 64 TE Connectivity Ltd.: SWOT Analysis
Figure 65 Amphenol Corporation: Company Snapshot
Figure 66 Amphenol Corporation: SWOT Analysis:
Figure 67 Fujikura Ltd.: Company Snapshot
Figure 68 Fujikura Ltd.: SWOT Analysis
Figure 69 Esterline Technologies Corporation: Company Snapshot
Figure 70 Esterline Technologies Corporation: SWOT Analysis
Figure 71 Corning Inc.: Company Snapshot
Figure 72 Corning Inc.: SWOT Analysis
Figure 73 Rockwell Collins: Company Snapshot
Figure 74 Nexans SA: Company Snapshot
Figure 75 Astronics Corporation: Company Snapshot
Figure 76 Optical Cable Corporation: Company Snapshot
Figure 77 Huber+Suhner AG: Company Snapshot
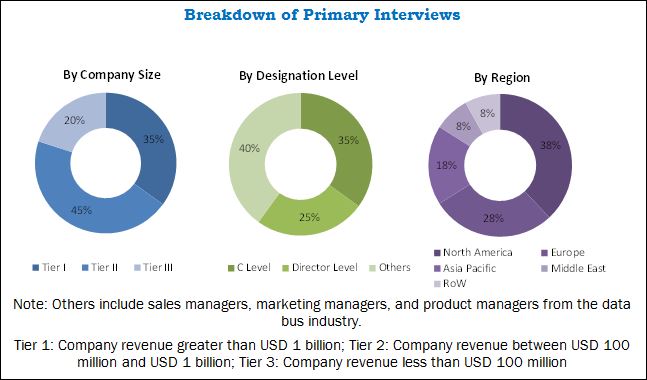
The research methodology used to estimate and forecast the data bus market included study of data and revenues of key players in the market through secondary resources, such as annual reports, Yahoo Finance, Federal Aviation Admiration (FAA), International Air transport Association (IATA), and Stockholm International Peace Research Institute (SIPRI). The bottom-up procedure was employed to arrive at the overall data bus market size from the revenue of key players in the market. After arriving at the overall market size, the market was split into several segments and subsegments, which were then verified through primary research by conducting extensive interviews with key industry experts, such as CEOs, VPs, directors, executives, and engineers. These data triangulation and market breakdown procedures was employed to complete the overall market engineering process and arrive at the exact statistics for all segments and subsegments. Breakdown of profiles of primaries is depicted in the figure given below:
To know about the assumptions considered for the study, download the pdf brochure
Market Ecosystem
The ecosystem of the data bus market comprises protocol, application, and component industries. The data bus value chain includes raw material manufactures, such as Optical Cable Corporation (U.S.), Sterlite Tech (India), among others. Key players operating in the market include TE connectivity (Switzerland), Amphenol Corporations (U.S.), Fujikura Ltd. (Japan), and Corning Inc. (U.S.). Acquisition and new product launches are the major strategies adopted by key players operational in the data bus market. Furthermore, products manufactured by these companies are used by firms, , such as Airbus (France), Boeing (U.S.), Volvo (Sweden), Boeing (U.S.), Newport News Shipbuilding (U.S.), Pipavav (India), and Volkswagen (Germany). This report will help data bus manufacturers, suppliers, distributers, and sub-component manufacturers to identify hot revenue pockets in this market.
Target Audience for this Report
- Data Bus Manufacturers
- Original Equipment Manufacturers (OEMs)
- Sub-component Manufacturers
- Technology Support Providers
- Government and Certification Bodies
- Aircraft manufacturer Associations
- Ships, Automotive manufacturers
“This study answers several questions for stakeholders, primarily, which market segments to focus on during the next two to five years for prioritizing their efforts and investments.”
Scope of the Report:
Data Bus Market, By Component
- Micro Couplers
- Cables
- Connectors
- Accessories
Data Bus Market, By Application
- Marine
- Commercial Aviation
- Military Aviation
- Automotive
Data Bus Market, By Protocol
- ARINC 429/629
- CAN
- TTP
- AFDC/ARINC 664
- MIL-STD-1553
Data Bus Market, By Region
- North America
- Europe
- Asia-Pacific
- Middle East
- Rest of the World
Available Customizations
Along with market data, MarketsandMarkets offers customizations as per specific needs of a company. The following customization options are available for this report:
-
Geographic Analysis
- Further breakdown of the Rest of the World market
-
Company Information
- Detailed analysis and profiling of additional market players (up to five)
- Additional Level Segmentation












Growth opportunities and latent adjacency in Data Bus Market
Hello, We need the bus and coach market data of the past years, by region and country. We sell our products to 66 countries. For new market research and benchmarks, we need sale amounts, applications, seats, specifications of buses and coaches sold in that country. Do you have data or a report for these information? Waiting for your response impatiently.