Aviation Analytics Market by Component (Services, Solutions), Deployment (On-premises, Cloud), Application, End-User (MROs, Airlines, Airports, OEMs), Business Function, Region (North America, Europe, APAC, RoW) - Global Forecast to 2027
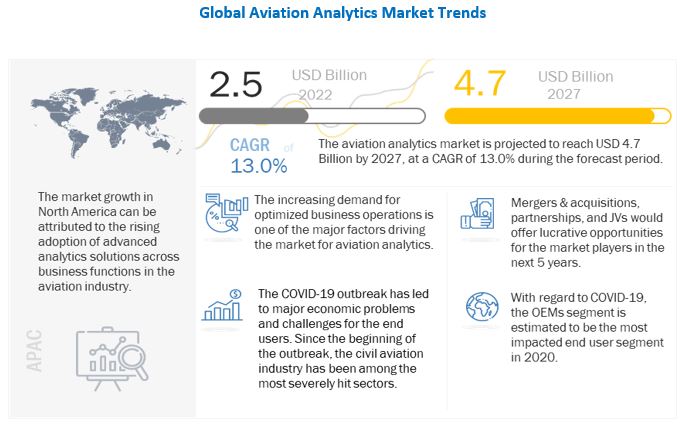
The Aviation Analytics Market is projected to grow from USD 2.5 billion in 2022 to USD 4.7 billion by 2027, at a CAGR of 13.0% from 2022 to 2027.
The increasing requirement to procure advanced analytical software by the aviation industry has led software developers to enhance the capabilities of their predictive, prescriptive, and descriptive analytics solutions for several business functions. Listed below are some of the new technologies observed in the Aviation Analytics Industry.
To know about the assumptions considered for the study, Request for Free Sample Report
COVID-19 Impact on Aviation Analytics Market
The COVID-19 pandemic has negatively impacted the airport segment of the aviation analytics market.
As several major airports halted their operations completely for a minimum of one business quarter, the lack of business activities has severely impacted revenue generations at airports. Several flights got canceled and delayed for an unforeseen period as governments imposed lockdowns and restricted people movements. International air traffic is negatively affected due to closed international borders. According to IATA, the aviation industry is expected to witness a loss of USD 63 billion from 2020-21.
Aviation Analytics Market Ecosystem
Aviation Analytics Market Segment Overview
Based on component, the solutions segment is projected to lead the market during the forecast period.
Based on component, the aviation analytics market is segmented into solutions and services.
The solutions segment is expected to lead the market during the forecast period due to increased demand for customized aviation analytics solutions that can tackle uncertainties in the aviation business. The services segment offers on-demand functionalities of aviation analytics, such as weather reporting and navigation, to focus on specific targeted areas. The aviation analytics services segment is anticipated to grow at a CAGR of 12.6% during the forecast period.
Based on application, the mobility & functionality segment is projected to grow at the highest CAGR during forecast period.
Based on application, the aviation analytics market is segmented into flight risk management, fuel management, route management, fleet management, inventory management, wealth management, inspection, performance monitoring, predictive analysis, part replacement, supply chain planning, energy management, emergency management, mobility & functionality, and others.
Aviation analytics majorly deals with collecting and analyzing historical data and trends to forecast various stages of a certain business function. The advent of modern analytics tools that are coupled with big data and artificial intelligence provides accurate solutions to analyze critical business functions. This has led to the growing demand for aviation analytics solutions from various OEMs and aircraft maintenance providers to gauge consumer trends and offer their services accordingly. Operational cost savings, improved efficiency, and better customer reach are some of the key benefits of implementing aviation analytics.
Based on end user, the airlines segment is projected to grow at the highest CAGR during forecast period.
Based on end user, the aviation analytics market is segmented into airlines, airports, MROs, and OEMs. The airports segment is expected to lead the market during the forecast period, owing to the increased number of airports in various regions to cater to the rising demand for air travel.
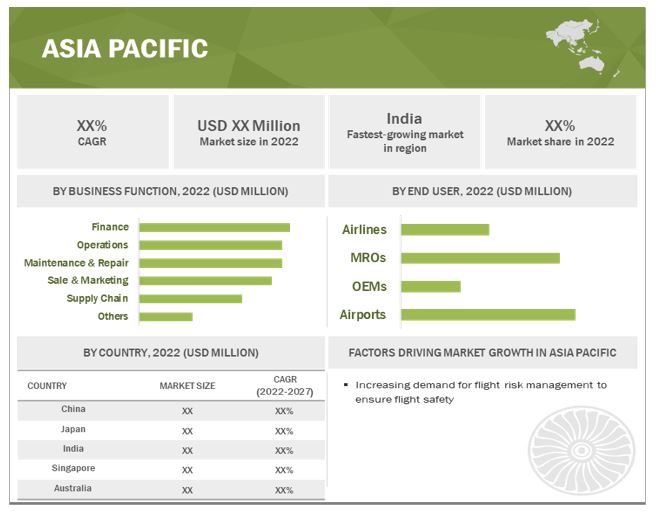
The aviation analytics market in Asia Pacific is projected to grow at the highest CAGR from 2022 to 2027.
The availability of technical expertise and workforce in countries such as China, Japan, and India is one of the major factors driving the aviation analytics market in the Asia Pacific region.
The growing demand for improved functional efficiency and an effective supply chain has positively impacted the aviation analytics market. The presence of startups providing analytics solutions, such as IBS Software Services, is one of the key reasons that aircraft OEMs and MRO solution providers are attracted to the Asia Pacific region where they can procure specifically devised solutions. Aircraft OEMs, such as Boeing and Airbus, are offering contracts to aviation analytics solution providers in China and India. The region is anticipated to showcase a positive growth rate post-COVID-19 scenario.
To know about the assumptions considered for the study, download the pdf brochure
Top 5 Key Market Players in Aviation Analytics Industry
The global Aviation Analytics Companies are dominated by a few globally established players such as
- Oracle Corporation (US),
- General Electric (US),
- Lufthansa Technik (Germany),
- SAP (Germany), and
- IBM Corporation (US).
Aviation Analytics Market Scope
Report Metric |
Details |
Market size available for years |
2018–2027 |
Base year considered |
2021 |
Forecast period |
2022-2027 |
Forecast units |
Value (USD Million/Billion) |
Segments covered |
By Component, By Deployment, By Business Function, By Application, By End User |
Geographies covered |
North America, Europe, Asia Pacific, Middle East and Rest of the World |
Companies covered |
IBM Corporation (US), IFS (Sweden), Ramco Systems (India), Rusada (Switzerland). SAP (Germany), Swiss AviationSoftware (Switzerland), Lufthansa Technik (Germany), General Electric (US), and Honeywell International (US). and others. Total 25 Market Players |
Aviation Analytics Market Dynamics
Driver: Growing emphasis on identifying new market opportunities by analyzing customer behavior and preferences
Aviation analytics helps companies in identifying consumer shifts in preferences so that they can design and offer the best-suited solutions to consumers.
The awareness regarding consumer demands helps airlines to improve their offerings. Large enterprises and SMEs have made significant investments in the field of analytics to ensure customer comfort. Enterprises emphasize smart data and big data analytics to enhance customer experience, resulting in customer loyalty and increased revenues.
In 2019, SAP partnered with an automotive and industry supplier Schaeffler to identify intersecting technology road maps and further drive Schaeffler’s digital transformation by using data analytics. This partnership is focused on improving the customer experience.
Restraint: Lack of appropriate analytical skills
The integration between conventional and modern aviation devices is difficult, which requires huge amount of investments and expertise.
In some cases, new devices have different protocols that make these difficult to adopt. Integration of legacy data systems with new technologies is time and effort-consuming and may distract an organization from its core business activities owing to lack of proper analytical skills .
Opportunity: Use of AI-based analytics solutions for critical functions in aviation industry
The use of aviation analytics in aviation business models requires skilled professionals and can be time-consuming.
Artificial intelligence (AI) is a collection of technologies that excel at extracting insights and patterns from large sets of data, which are then employed to make predictions based on that information. Thus, AI is being used to automate the analytics process to make it more efficient and accessible, owing to the improved user interface through natural language processing.
Companies such as SAP SE and Oracle Corporation offer several aviation analytics solutions that are based upon the use of AI platforms. For example, Oracle Analytics and Oracle cloud ERP are based on AI. Automation platforms, content management systems, and CRMs are some of the available AI-based analytics solutions in the market. Thus, the incorporation of AI into data analytics can act as an opportunity for the aviation analytics market to grow.
Challenge: Economic challenges faced by the aviation industry due to COVID-19
The COVID-19 outbreak has led to major economic problems and challenges for the aviation industry.
Since the beginning of the outbreak, the civil aviation industry has been among the most severely hit sectors globally. The International Civil Aviation Organization (ICAO) and International Air Transport Association (IATA) actively monitor the economic impact on the aviation industry and regularly publishes reports and forecasts.
Aviation Analytics Market Categorization
The study categorizes the aviation analytics market based on Component, Deployment, Application, End User and region.
By Component
- Services
- Solutions
By Deployment
- On-premise
- Cloud
By Business Function
- Finance
- Operations
- Maintenance & Repair
- Sales & Marketing
- Supply Chain
- Others
By Application
- Flight Risk Management
- Fuel Management
- Rout Management
- Fleet Management
- Inventory Management
- Wealth Management
- Inspection
- Performance Monitoring
- Predictive Analysis
- Part Replacement
- Supply Chain Planning
- Energy Management
- Emergency Management
- Mobility & Functionality
- Others
By End User
-
OEMs
- Aircraft OEMs
- Engine OEMs
-
Airlines
- Small Airlines
- Medium Airlines
- Large Airlines
-
Airports
- Small Airports
- Medium Airports
- Large Airports
-
MROs
- Small MROs
- Medium MROs
- Large MROs
By Region
- North America
- Europe
- Asia Pacific
- Middle East
- Rest of the World
Recent Developments in Aviation Analytics Industry
- In July 2022, General Electric signed an MoU with Microsoft and Teradata to work on a solution to lower carbon emissions. The three businesses plan to start collaborating to create a product that will give airplane operators the tools they need to monitor, report, and reduce emissions right away. To tackle the problem of cutting aircraft emissions, the collaboration combines the software solutions of three top companies.
- In July 2022, Askdata, a start-up with a focus on search-driven analytics, was acquired by SAP SE to improve its capacity to support businesses in making more informed decisions. Users can search, engage with, and work together on real-time data to maximize business insights. Askdata's customized experience, which is available in many different languages, connects live to source apps without moving data and keeps the entire business context to deliver insightful responses and proactive insights.
- In July 2022, IFS AB finalized a deal to acquire Ultimo Software Solutions, a Dutch company that offers cloud Enterprise Asset Management (EAM) software. Ultimo Software Solutions has established a solid reputation for the comprehensiveness, adaptability, and customizability of its SaaS EAM solutions. As the only vendor now able to provide Cloud native EAM solutions that cater to every firm with either sophisticated end-to-end business demands or as a standalone point solution, IFS AB stands out from competitors thanks to its partnership with Ultimo Software Solutions.
- In July 2022, Malaysia Airlines extended its relationship with SITA to complete a significant upgrade that will provide quick, secure, and dependable network connectivity between its hub in Kuala Lumpur and its international operations. Malaysia Airlines will use SITA Connect, which was created especially for the aviation sector, to satisfy its demands within and outside of airports. SITA's global presence at over 650 airports in 220 countries and territories will provide easy access to new features and apps, cut connectivity costs, improve service quality as well as simplify the check-in process for passengers.
- In May 2022, Oracle Corporation signed a contract to buy Adi Insights, a leading supplier of workforce management systems. The acquisition will enable SuitePeople, NetSuite's human resource management platform, to manage overtime, capture time, estimate demand, and schedule shifts.
Frequently Asked Questions (FAQs):
What are your views on the growth prospect of the aviation analytics market?
Response: The aviation analytics market is expected to grow substantially owing to the growing trend of digitization and expected increasing demand for aircraft fleet, globally.
What are the key sustainability strategies adopted by leading players operating in the aviation analytics market?
Response: Key players have adopted various organic and inorganic strategies to strengthen their position in the aircraft actuators market. The major players include IBM Corporation (US), SAP (Germany), Lufthansa Technik (Germany), General Electric (US), and Oracle Corporation (US). and others, these players have adopted various strategies, such as acquisitions, contracts, expansions, new product launches, and partnerships & agreements, to expand their presence in the market.
What are the new emerging technologies and use cases disrupting the aviation analytics market?
Response: Some of the major emerging technologies and use cases disrupting the market include demand for Software as a Service (SaaS), predictive analytics, and integration of big data technology in aviation analytics applications.
Who are the key players and innovators in the ecosystem of the aviation analytics market?
Response: The key players in the aviation analytics market include IBM Corporation (US), IFS (Sweden), Ramco Systems (India), SAP (Germany), Swiss AviationSoftware (Switzerland), Lufthansa Technik (Germany), General Electric (US), and Honeywell International (US) and others.
Which region is expected to hold the highest market share in the aviation analytics market?
Response: Aviation analytics market in North America is projected to hold the highest market share during the forecast period due to the presence of several aviation analytics service providers in the region.
Which application, such as inspection, performance monitoring, predictive analysis, part replacement and mobility & functionality, is expected to drive the growth of the market in the coming years?
Response: For the aviation analytics market, mobility & functionality is projected to grow at the highest CAGR during the forecast period from 2022 to 2027.
To speak to our analyst for a discussion on the above findings, click Speak to Analyst
TABLE OF CONTENTS
1 INTRODUCTION (Page No. - 27)
1.1 STUDY OBJECTIVES
1.2 MARKET DEFINITION
1.3 MARKET SCOPE
FIGURE 1 MARKET SEGMENTATION
1.3.1 REGIONAL SCOPE
1.3.2 YEARS CONSIDERED
1.4 CURRENCY CONSIDERED
TABLE 1 USD EXCHANGE RATES
1.5 LIMITATION
1.6 INCLUSIONS & EXCLUSIONS
TABLE 2 AVIATION ANALYTICS MARKET, BY BUSINESS FUNCTION: INCLUSIONS & EXCLUSIONS
1.7 MARKET STAKEHOLDERS
1.8 SUMMARY OF CHANGES
2 RESEARCH METHODOLOGY (Page No. - 32)
2.1 RESEARCH DATA
FIGURE 2 RESEARCH PROCESS FLOW
FIGURE 3 RESEARCH DESIGN
2.1.1 SECONDARY DATA
2.1.1.1 Key data from secondary sources
2.1.2 PRIMARY DATA
2.1.2.1 Key data from primary sources
2.1.2.2 Breakdown of primaries
2.1.2.3 Key industry insights
2.2 MARKET DEFINITION & SCOPE
2.2.1 EXCLUSIONS
2.3 RESEARCH METHODOLOGY
2.3.1 BOTTOM-UP APPROACH
FIGURE 4 MARKET SIZE ESTIMATION METHODOLOGY: BOTTOM-UP APPROACH
2.3.2 TOP-DOWN APPROACH
FIGURE 5 MARKET SIZE ESTIMATION METHODOLOGY: TOP-DOWN APPROACH
2.4 DATA TRIANGULATION
FIGURE 6 DATA TRIANGULATION
2.5 RESEARCH ASSUMPTIONS
2.6 RISK ANALYSIS
3 EXECUTIVE SUMMARY (Page No. - 41)
FIGURE 7 BY END USER, AIRPORTS SEGMENT PROJECTED TO LEAD MARKET FROM 2022 TO 2027
FIGURE 8 BY BUSINESS FUNCTION, FINANCE SEGMENT PROJECTED TO LEAD MARKET DURING FORECAST PERIOD
FIGURE 9 AVIATION ANALYTICS MARKET IN ASIA PACIFIC PROJECTED TO REGISTER HIGHEST CAGR FROM 2022 TO 2027
4 PREMIUM INSIGHTS (Page No. - 44)
4.1 ATTRACTIVE OPPORTUNITIES FOR PLAYERS IN AVIATION ANALYTICS MARKET
FIGURE 10 DEMAND FOR OPTIMIZED BUSINESS OPERATIONS DRIVES MARKET
4.2 AVIATION ANALYTICS MARKET, BY APPLICATION
FIGURE 11 WEALTH MANAGEMENT SEGMENT EXPECTED TO LEAD MARKET DURING FORECAST PERIOD
4.3 AVIATION ANALYTICS MARKET, BY DEPLOYMENT
FIGURE 12 CLOUD SEGMENT PROJECTED TO REGISTER HIGHER CAGR THAN ON-PREMISES SEGMENT DURING FORECAST PERIOD
4.4 AVIATION ANALYTICS MARKET, BY MAJOR COUNTRIES
FIGURE 13 AVIATION ANALYTICS MARKET IN INDIA PROJECTED TO REGISTER HIGHEST CAGR DURING FORECAST PERIOD
5 MARKET OVERVIEW (Page No. - 47)
5.1 MARKET INTRODUCTION
5.2 MARKET DYNAMICS
FIGURE 14 AVIATION ANALYTICS MARKET: DRIVERS, RESTRAINTS, OPPORTUNITIES & CHALLENGES
5.2.1 DRIVERS
5.2.1.1 Advancement in cloud-based IT solutions for data collection
5.2.1.2 Demand for optimized business operations through application of structured analytical solutions
5.2.1.3 Growing emphasis on identifying new market opportunities by analyzing customer behavior and preferences
5.2.1.4 Reduced maintenance costs and downtime by employing predictive analytics
5.2.2 RESTRAINTS
5.2.2.1 Lack of appropriate analytical skills
5.2.3 OPPORTUNITIES
5.2.3.1 Cloud-based real-time data collection and analytics
5.2.3.2 Incorporation of AI-based analytics solutions for critical functions in aviation industry
5.2.4 CHALLENGES
5.2.4.1 Requirement for diverse data models
5.3 TRENDS/DISRUPTIONS IMPACTING CUSTOMERS’ BUSINESSES
5.3.1 REVENUE SHIFT AND NEW REVENUE POCKETS FOR AVIATION ANALYTICS MARKET
FIGURE 15 REVENUE SHIFT IN AVIATION ANALYTICS MARKET
5.4 MARKET ECOSYSTEM
5.4.1 PROMINENT COMPANIES
5.4.2 PRIVATE AND SMALL ENTERPRISES
5.4.3 END USERS
FIGURE 16 AVIATION ANALYTICS ECOSYSTEM
TABLE 3 AVIATION ANALYTICS MARKET ECOSYSTEM
5.5 AVIATION ANALYTICS SOLUTIONS, BY CATEGORY
TABLE 4 AVIATION ANALYTICS SOLUTIONS, BY CATEGORY
5.6 AVERAGE SELLING PRICE OF ANALYTICS SOLUTIONS
FIGURE 17 AVERAGE SELLING PRICE TREND OF ANALYTICS SOLUTIONS (2019–2022)
5.7 VALUE CHAIN ANALYSIS
FIGURE 18 VALUE CHAIN ANALYSIS: AVIATION ANALYTICS MARKET
5.8 USE CASE ANALYSIS
5.8.1 USE CASE: HOW TO UTILIZE CARGO CAPACITY AS EFFICIENTLY AS POSSIBLE BY ANTICIPATING UNUSED SPACE
TABLE 5 UTILIZING CARGO CAPACITY
5.8.2 USE CASE: INCREASING FUEL EFFICIENCY OF AIRCRAFT
TABLE 6 INCREASE IN FUEL EFFICIENCY OF AIRCRAFT
5.8.3 USE CASE: REDUCED COST THROUGH PREDICTIVE MAINTENANCE FOR AIRLINES
TABLE 7 PREDICTIVE MAINTENANCE
5.9 PORTER’S FIVE FORCES ANALYSIS
TABLE 8 AVIATION ANALYTICS MARKET: PORTER'S FIVE FORCES ANALYSIS
FIGURE 19 PORTER’S FIVE FORCES ANALYSIS: INTENSITY OF COMPETITIVE RIVALRY IS HIGH IN AVIATION ANALYTICS MARKET
5.9.1 THREAT OF NEW ENTRANTS
5.9.2 THREAT OF SUBSTITUTES
5.9.3 BARGAINING POWER OF SUPPLIERS
5.9.4 BARGAINING POWER OF BUYERS
5.9.5 INTENSITY OF COMPETITIVE RIVALRY
5.10 TECHNOLOGY ANALYSIS
5.10.1 SENSORS
5.10.2 CLOUD COMPUTING
5.10.3 ARTIFICIAL INTELLIGENCE AND DATA ANALYTICS
5.10.4 BLOCKCHAIN TECHNOLOGY
5.11 TRADE ANALYSIS
5.12 TRADE DATA ANALYSIS
TABLE 9 COUNTRY-WISE IMPORT, 2019–2021 (USD THOUSAND)
TABLE 10 COUNTRY-WISE EXPORT, 2019-2021 (USD THOUSAND)
5.13 KEY STAKEHOLDERS AND BUYING CRITERIA
5.13.1 KEY STAKEHOLDERS IN BUYING PROCESS
FIGURE 20 INFLUENCE OF STAKEHOLDERS IN BUYING PROCESS OF TOP THREE APPLICATIONS
TABLE 11 INFLUENCE OF STAKEHOLDERS IN BUYING PROCESS OF TOP THREE APPLICATIONS (%)
5.13.2 BUYING CRITERIA
FIGURE 21 KEY BUYING CRITERIA FOR TOP THREE APPLICATIONS
TABLE 12 KEY BUYING CRITERIA FOR TOP THREE APPLICATIONS
5.14 TARIFF AND REGULATORY LANDSCAPE
5.14.1 REGULATORY BODIES, GOVERNMENT AGENCIES, AND OTHER ORGANIZATIONS
TABLE 13 NORTH AMERICA: REGULATORY BODIES, GOVERNMENT AGENCIES, AND OTHER ORGANIZATIONS
TABLE 14 EUROPE: REGULATORY BODIES, GOVERNMENT AGENCIES, AND OTHER ORGANIZATIONS
TABLE 15 ASIA PACIFIC: REGULATORY BODIES, GOVERNMENT AGENCIES, AND OTHER ORGANIZATIONS
TABLE 16 MIDDLE EAST & AFRICA: REGULATORY BODIES, GOVERNMENT AGENCIES, AND OTHER ORGANIZATIONS
TABLE 17 LATIN AMERICA: REGULATORY BODIES, GOVERNMENT AGENCIES, AND OTHER ORGANIZATIONS
5.15 KEY CONFERENCES AND EVENTS IN 2022–2023
TABLE 18 AVIATION ANALYTICS MARKET: CONFERENCES AND EVENTS
6 INDUSTRY TRENDS (Page No. - 67)
6.1 INTRODUCTION
6.2 TECHNOLOGICAL ADVANCEMENTS IN AVIATION INDUSTRY
6.2.1 INTERNET OF THINGS (IOT)
6.2.2 BLOCKCHAIN APPLICATION IN ANALYTICS
6.2.3 OPTIMIZATION OF OPERATIONS
6.2.4 DIGITAL TWIN
6.3 EMERGING TRENDS
6.3.1 SMART WEARABLE GADGETS
6.3.2 BIG DATA
6.3.3 BIOMETRIC TECHNOLOGY
6.3.4 CYBERSECURITY AND CLOUD
6.4 AVIATION ANALYTICS MARKET: NEW TECHNOLOGIES AND THEIR APPLICATIONS
6.4.1 INTRODUCTION
6.4.2 AVIATION CLOUD TECHNOLOGY
6.4.3 ADVANCED ANALYTICS AND DIGITAL TRANSFORMATION
6.4.4 DATA ROUTING
6.4.5 ARTIFICIAL INTELLIGENCE
6.4.6 INTERNET OF THINGS
6.5 TARIFF REGULATORY LANDSCAPE ANALYTICS SOLUTIONS
6.5.1 NORTH AMERICA
6.5.2 EUROPE
6.6 IMPACT OF MEGATRENDS: AVIATION CLOUD
6.6.1 DIGITALIZATION
6.6.2 SUSTAINABILITY – NET ZERO CARBON EMISSION
6.6.3 IOT-BASED EQUIPMENT TRACKS PERFORMANCE AND MAINTENANCE NEEDS
6.7 AVIATION ANALYTICS MARKET: PATENT ANALYSIS
TABLE 19 INNOVATIONS & PATENT REGISTRATIONS, 2019–2022
7 AVIATION ANALYTICS MARKET, BY COMPONENT (Page No. - 74)
7.1 INTRODUCTION
FIGURE 22 BY COMPONENT, SOLUTIONS SEGMENT ESTIMATED TO DOMINATE MARKET DURING FORECAST PERIOD
TABLE 20 AVIATION ANALYTICS MARKET, BY COMPONENT, 2018–2021 (USD MILLION)
TABLE 21 AVIATION ANALYTICS MARKET, BY COMPONENT, 2022–2027 (USD MILLION)
7.2 SOLUTIONS
7.2.1 GROWING ADOPTION OF ANALYTICAL SOLUTIONS FOR DIFFERENT BUSINESS FUNCTIONS TO STIMULATE MARKET GROWTH
7.3 SERVICES
7.3.1 PROFESSIONAL SERVICES
7.3.1.1 Demand for third-party support and maintenance services
7.3.2 MANAGED SERVICES
7.3.2.1 Facilitate enterprises in managing IT system requirements
7.3.3 SAAS
7.3.3.1 Demand for minimizing task of software maintenance
8 AVIATION ANALYTICS MARKET, BY DEPLOYMENT (Page No. - 77)
8.1 INTRODUCTION
FIGURE 23 BY DEPLOYMENT, ON-PREMISES SEGMENT PROJECTED TO LEAD MARKET DURING FORECAST PERIOD
TABLE 22 AVIATION ANALYTICS MARKET, BY DEPLOYMENT, 2018–2021 (USD MILLION)
TABLE 23 AVIATION ANALYTICS MARKET, BY DEPLOYMENT, 2022–2027 (USD MILLION)
8.2 ON-PREMISES
8.2.1 ENHANCING IN-HOUSE SOFTWARE INFRASTRUCTURE TO DRIVE SEGMENT
8.3 CLOUD
8.3.1 ENHANCED DATA SECURITY OFFERED BY SOLUTION PROVIDERS TO STIMULATE DEMAND FOR CLOUD DEPLOYMENT
9 AVIATION ANALYTICS MARKET, BY BUSINESS FUNCTION (Page No. - 80)
9.1 INTRODUCTION
FIGURE 24 BY BUSINESS FUNCTION, FINANCE SEGMENT PROJECTED TO LEAD MARKET DURING FORECAST PERIOD
TABLE 24 AVIATION ANALYTICS MARKET, BY BUSINESS FUNCTION, 2018–2021 (USD MILLION)
TABLE 25 AVIATION ANALYTICS MARKET, BY BUSINESS FUNCTION, 2022–2027 (USD MILLION)
9.2 FINANCE
9.2.1 AVIATION ANALYTICS HELPS ORGANIZATIONS MANAGE FINANCE-RELATED FUNCTIONS EFFECTIVELY
9.3 OPERATIONS
9.3.1 AVIATION ANALYTICS ENABLES MANAGING OPERATIONAL ACTIVITIES MORE EFFICIENTLY
9.4 MAINTENANCE & REPAIR
9.4.1 PREDICTIVE ANALYTICS HELPS ORGANIZATIONS REDUCE DOWNTIME AND REPAIR COSTS
9.5 SALES & MARKETING
9.5.1 AVIATION ANALYTICS HELPS AIRLINES DEVISE STRATEGIES FOR MARKETING CAMPAIGNS
9.6 SUPPLY CHAIN
9.6.1 AVIATION ANALYTICS HELPS FORECAST AND REPORT REQUIREMENTS OF RAW MATERIALS
9.7 OTHERS
10 AVIATION ANALYTICS MARKET, BY APPLICATION (Page No. - 84)
10.1 INTRODUCTION
FIGURE 25 BY APPLICATION, WEALTH MANAGEMENT SEGMENT PROJECTED TO DOMINATE MARKET DURING FORECAST PERIOD
TABLE 26 AVIATION ANALYTICS MARKET, BY APPLICATION, 2018–2021 (USD MILLION)
TABLE 27 AVIATION ANALYTICS MARKET, BY APPLICATION, 2022–2027 (USD MILLION)
10.2 FLIGHT RISK MANAGEMENT
10.2.1 DEMAND FOR IMPROVED IN-FLIGHT SAFETY TO AVOID ACCIDENTS DRIVES SEGMENT
10.3 FUEL MANAGEMENT
10.3.1 FUEL MANAGEMENT PROVIDES IN-FLIGHT FUEL CONSUMPTION DATA TO BETTER PLAN ROUTE
10.4 ROUTE MANAGEMENT
10.4.1 AVIATION ANALYTICS IN ROUTE MANAGEMENT ANALYZES REAL-TIME WEATHER-RELATED INFORMATION AND ENABLES SAFE TRAVEL
10.5 FLEET MANAGEMENT
10.5.1 AVIATION ANALYTICS EFFECTIVELY MANAGES AIRLINE FLEET TO MEET PASSENGER DEMANDS DURING PEAK TRAVEL PERIODS
10.6 INVENTORY MANAGEMENT
10.6.1 AVIATION ANALYTICS HELPS SYSTEMATICALLY SOURCE AND STORE RAW MATERIALS AND FINISHED GOODS DURING VARIOUS OPERATIONS
10.7 WEALTH MANAGEMENT
10.7.1 WEALTH MANAGEMENT INVOLVES REPORTING FINANCIAL DETAILS AND PLANNING FOR PORTFOLIO AND ACCOUNTING
10.8 INSPECTION
10.8.1 AVIATION ANALYTICS HELPS DETECT EARLY SIGNS OF COMPONENT FAILURE AND ENSURES SAFETY
10.9 PERFORMANCE MONITORING
10.9.1 PERFORMANCE MONITORING ENABLES USE OF EFFECTIVE SET OF PARAMETERS TO IMPROVE OPERATIONAL EFFICIENCY AND PROFITABILITY
10.10 PREDICTIVE ANALYTICS
10.10.1 PREDICTIVE ANALYTICS ANALYZES CURRENT DATA AND OFFERS INTELLIGENT PREDICTIONS FOR CERTAIN PERIODS IN FUTURE
10.11 PART REPLACEMENT
10.11.1 AVIATION ANALYTICS PROVIDES INSIGHTS INTO PARTS REPLACEMENT DURING AIRCRAFT MAINTENANCE AND OVERHAUL
10.12 SUPPLY CHAIN PLANNING & PROCUREMENT
10.12.1 INCREASING ADOPTION OF AVIATION ANALYTICS FOR COST-EFFICIENT SUPPLY CHAIN OPERATIONS DRIVES SEGMENT
10.13 ENERGY MANAGEMENT
10.13.1 ENERGY MANAGEMENT PROVIDES DATA RELATED TO AIRSPEED AND THRUST, AMONG OTHER CRUCIAL PARAMETERS FOR IN-FLIGHT SAFETY
10.14 EMERGENCY MANAGEMENT
10.14.1 AIRPORTS AND AIRCRAFT EMPLOY EMERGENCY MANAGEMENT SOLUTIONS TO ENSURE EFFECTIVE RESPONSE PLANS DURING STATE OF EMERGENCY
10.15 MOBILITY & FUNCTIONALITY
10.15.1 MOBILITY & FUNCTIONALITY INTEGRATION INTO AVIATION BUSINESS FUNCTIONS IMPROVES CUSTOMER EXPERIENCE
11 AVIATION ANALYTICS MARKET, BY END USER (Page No. - 90)
11.1 INTRODUCTION
FIGURE 26 BY END USER, AIRPORTS SEGMENT PROJECTED TO LEAD MARKET FROM 2022 TO 2027
TABLE 28 AVIATION ANALYTICS MARKET, BY END USER, 2018–2021 (USD MILLION)
TABLE 29 AVIATION ANALYTICS MARKET, BY END USER, 2022–2027 (USD MILLION)
11.2 AIRLINES
TABLE 30 AVIATION ANALYTICS MARKET FOR AIRLINES, BY TYPE, 2018–2021 (USD MILLION)
TABLE 31 AVIATION ANALYTICS MARKET FOR AIRLINES, BY TYPE, 2022–2027 (USD MILLION)
11.2.1 SMALL AIRLINES
11.2.1.1 Small airlines outsource aviation analytics solutions to save costs on capital investment and human resources
11.2.2 MEDIUM AIRLINES
11.2.2.1 Medium airlines use advanced software to undertake core operations
11.2.3 LARGE AIRLINES
11.2.3.1 Most large airlines completely digitalize business operations by sharing real-time data with OEMs and third-party MROs
11.3 MROS
TABLE 32 AVIATION ANALYTICS MARKET FOR MROS, BY TYPE, 2018–2021 (USD MILLION)
TABLE 33 AVIATION ANALYTICS MARKET FOR MROS, BY TYPE, 2022–2027 (USD MILLION)
11.3.1 SMALL MROS
11.3.1.1 Limited budgets and expertise restrain adoption of aviation analytics by small MRO service providers
11.3.2 MEDIUM MROS
11.3.2.1 Most medium MRO service providers focus on digitization of crucial functionalities
11.3.3 LARGE MROS
11.3.3.1 Large MRO service providers concentrate on developing specialized aviation software
11.4 OEMS
TABLE 34 AVIATION ANALYTICS MARKET FOR OEMS, BY TYPE, 2018–2021 (USD MILLION)
TABLE 35 AVIATION ANALYTICS MARKET FOR OEMS, BY TYPE, 2022–2027 (USD MILLION)
11.4.1 AIRCRAFT OEMS
11.4.1.1 Aircraft manufacturers deploy aviation analytics solutions to gain real-time data related to several business functions
11.4.2 ENGINE OEMS
11.4.2.1 Engine manufacturers employ sophisticated network of sensor systems to gather data and improve operational efficiency
11.5 AIRPORTS
TABLE 36 AVIATION ANALYTICS MARKET FOR AIRPORTS, BY TYPE, 2018–2021 (USD MILLION)
TABLE 37 AVIATION ANALYTICS MARKET FOR AIRPORTS, BY TYPE, 2022–2027 (USD MILLION)
11.5.1 SMALL AIRPORTS
11.5.1.1 Limited passenger boarding and short budgets restrict small airports from deploying aviation analytics at full scale
11.5.2 MEDIUM AIRPORTS
11.5.2.1 Medium airports use sophisticated software to undertake core operations
11.5.3 LARGE AIRPORTS
11.5.3.1 Large airports emphasize on offering improved customer experience and managing various business functions efficiently
12 REGIONAL ANALYSIS (Page No. - 97)
12.1 INTRODUCTION
FIGURE 27 MARKET: REGIONAL SNAPSHOT
TABLE 38 AVIATION ANALYTICS MARKET SIZE, BY APPLICATION, 2018–2021 (USD MILLION)
TABLE 39 AVIATION ANALYTICS MARKET SIZE, BY APPLICATION, 2022–2027 (USD MILLION)
TABLE 40 AVIATION ANALYTICS MARKET SIZE, BY COMPONENT, 2018–2021 (USD MILLION)
TABLE 41 AVIATION ANALYTICS MARKET SIZE, BY COMPONENT, 2022–2027 (USD MILLION)
TABLE 42 AVIATION ANALYTICS MARKET SIZE, BY DEPLOYMENT, 2018–2021 (USD MILLION)
TABLE 43 AVIATION ANALYTICS MARKET SIZE, BY DEPLOYMENT, 2022–2027 (USD MILLION)
TABLE 44 AVIATION ANALYTICS MARKET SIZE, BY BUSINESS FUNCTION, 2018–2021 (USD MILLION)
TABLE 45 AVIATION ANALYTICS MARKET SIZE, BY BUSINESS FUNCTION, 2022–2027 (USD MILLION)
TABLE 46 AVIATION ANALYTICS MARKET SIZE, BY END USER, 2018–2021 (USD MILLION)
TABLE 47 MARKET SIZE, BY END USER, 2022–2027 (USD MILLION)
TABLE 48 MARKET SIZE, BY REGION, 2018–2021 (USD MILLION)
TABLE 49 MARKET SIZE, BY REGION, 2022–2027 (USD MILLION)
12.2 NORTH AMERICA
12.2.1 PESTLE ANALYSIS: NORTH AMERICA
FIGURE 28 NORTH AMERICA MARKET SNAPSHOT
TABLE 50 NORTH AMERICA: MARKET SIZE, BY BUSINESS FUNCTION, 2018–2021 (USD MILLION)
TABLE 51 NORTH AMERICA: MARKET SIZE, BY BUSINESS FUNCTION, 2022–2027 (USD MILLION)
TABLE 52 NORTH AMERICA: MARKET SIZE, BY COMPONENT, 2018–2021 (USD MILLION)
TABLE 53 NORTH AMERICA: MARKET SIZE, BY COMPONENT, 2022–2027 (USD MILLION)
TABLE 54 NORTH AMERICA: MARKET SIZE, BY END USER, 2018–2021 (USD MILLION)
TABLE 55 NORTH AMERICA: MARKET SIZE, BY APPLICATION, 2022–2027 (USD MILLION)
TABLE 56 NORTH AMERICA: MARKET SIZE, BY COUNTRY, 2018–2021 (USD MILLION)
TABLE 57 NORTH AMERICA: MARKET SIZE, BY COUNTRY, 2022–2027 (USD MILLION)
12.2.2 US
12.2.2.1 Emphasis on enhancing passenger comfort to drive demand for aviation analytics
TABLE 58 US: MARKET SIZE, BY BUSINESS FUNCTION, 2018–2021 (USD MILLION)
TABLE 59 US: MARKET SIZE, BY BUSINESS FUNCTION, 2022–2027 (USD MILLION)
TABLE 60 US: MARKET SIZE, BY COMPONENT, 2018–2021 (USD MILLION)
TABLE 61 US: MARKET SIZE, BY COMPONENT, 2022–2027 (USD MILLION)
TABLE 62 US: MARKET SIZE, BY END USER, 2018–2021 (USD MILLION)
TABLE 63 US: MARKET SIZE, BY END USER, 2022–2027 (USD MILLION)
12.2.3 CANADA
12.2.3.1 Procurement of new generation commercial aircraft to drive demand for aviation analytics
TABLE 64 CANADA: MARKET SIZE, BY BUSINESS FUNCTION, 2018–2021 (USD MILLION)
TABLE 65 CANADA: MARKET SIZE, BY BUSINESS FUNCTION, 2022–2027 (USD MILLION)
TABLE 66 CANADA: MARKET SIZE, BY COMPONENT, 2018–2021 (USD MILLION)
TABLE 67 CANADA: MARKET SIZE, BY COMPONENT, 2022–2027 (USD MILLION)
12.3 EUROPE
12.3.1 PESTLE ANALYSIS: EUROPE
FIGURE 29 EUROPE MARKET SNAPSHOT
TABLE 68 EUROPE: MARKET SIZE, BY BUSINESS FUNCTION, 2018–2021 (USD MILLION)
TABLE 69 EUROPE: MARKET SIZE, BY BUSINESS FUNCTION, 2022–2027 (USD MILLION)
TABLE 70 EUROPE: MARKET SIZE, BY COMPONENT, 2018–2021 (USD MILLION)
TABLE 71 EUROPE: MARKET SIZE, BY COMPONENT, 2022–2027 (USD MILLION)
TABLE 72 EUROPE: MARKET SIZE, BY END USER, 2018–2021 (USD MILLION)
TABLE 73 EUROPE: MARKET SIZE, BY END USER, 2022–2027 (USD MILLION)
TABLE 74 EUROPE: MARKET SIZE, BY COUNTRY, 2018–2021 (USD MILLION)
TABLE 75 EUROPE: MARKET SIZE, BY COUNTRY, 2022–2027 (USD MILLION)
12.3.2 GERMANY
12.3.2.1 Presence of solution providers drives market
TABLE 76 GERMANY: MARKET SIZE, BY BUSINESS FUNCTION, 2018–2021 (USD MILLION)
TABLE 77 GERMANY: MARKET SIZE, BY BUSINESS FUNCTION, 2022–2027 (USD MILLION)
TABLE 78 GERMANY: MARKET SIZE, BY COMPONENT, 2018–2021 (USD MILLION)
TABLE 79 GERMANY: MARKET SIZE, BY COMPONENT, 2022–2027 (USD MILLION)
TABLE 80 GERMANY: MARKET SIZE, BY END USER, 2018–2021 (USD MILLION)
TABLE 81 GERMANY: MARKET SIZE, BY END USER, 2022–2027 (USD MILLION)
12.3.3 UK
12.3.3.1 Growing aviation network led to increased passenger footfall at UK airports
TABLE 82 UK: MARKET SIZE, BY BUSINESS FUNCTION, 2018–2021 (USD MILLION)
TABLE 83 UK: MARKET SIZE, BY BUSINESS FUNCTION, 2022–2027 (USD MILLION)
TABLE 84 UK: MARKET SIZE, BY COMPONENT, 2018–2021 (USD MILLION)
TABLE 85 UK: MARKET SIZE, BY COMPONENT, 2022–2027 (USD MILLION)
TABLE 86 UK: MARKET SIZE, BY END USER, 2018–2021 (USD MILLION)
TABLE 87 UK: MARKET SIZE, BY END USER, 2022–2027 (USD MILLION)
12.3.4 FRANCE
12.3.4.1 Growing adoption of technologically advanced analytics solutions in commercial aviation to drive market
TABLE 88 FRANCE: MARKET SIZE, BY BUSINESS FUNCTION, 2018–2021 (USD MILLION)
TABLE 89 FRANCE: MARKET SIZE, BY BUSINESS FUNCTION, 2022–2027 (USD MILLION)
TABLE 90 FRANCE: MARKET SIZE, BY COMPONENT, 2018–2021 (USD MILLION)
TABLE 91 FRANCE: MARKET SIZE, BY COMPONENT, 2022–2027 (USD MILLION)
TABLE 92 FRANCE: MARKET SIZE, BY END USER, 2018–2021 (USD MILLION)
TABLE 93 FRANCE: MARKET SIZE, BY END USER, 2022–2027 (USD MILLION)
12.3.5 SPAIN
12.3.5.1 Highly competitive aviation industry in Spain expected to impact market positively
TABLE 94 SPAIN: MARKET SIZE, BY BUSINESS FUNCTION, 2018–2021 (USD MILLION)
TABLE 95 SPAIN: MARKET SIZE, BY BUSINESS FUNCTION, 2022–2027 (USD MILLION)
TABLE 96 SPAIN: MARKET SIZE, BY COMPONENT, 2018–2021 (USD MILLION)
TABLE 97 SPAIN: MARKET SIZE, BY COMPONENT, 2022–2027 (USD MILLION)
TABLE 98 SPAIN: MARKET SIZE, BY END USER, 2018–2021 (USD MILLION)
TABLE 99 SPAIN: MARKET SIZE, BY END USER, 2022–2027 (USD MILLION)
12.3.6 SWEDEN
12.3.6.1 Emphasis on increasing fleet size expected to drive market
TABLE 100 SWEDEN: MARKET SIZE, BY BUSINESS FUNCTION, 2018–2021 (USD MILLION)
TABLE 101 SWEDEN: MARKET SIZE, BY BUSINESS FUNCTION, 2022–2027 (USD MILLION)
TABLE 102 SWEDEN: MARKET SIZE, BY COMPONENT, 2018–2021 (USD MILLION)
TABLE 103 SWEDEN: MARKET SIZE, BY COMPONENT, 2022–2027 (USD MILLION)
TABLE 104 SWEDEN: MARKET SIZE, BY END USER, 2018–2021 (USD MILLION)
TABLE 105 SWEDEN: MARKET SIZE, BY END USER, 2022–2027 (USD MILLION)
12.3.7 RUSSIA
12.3.7.1 Growing investments toward digitizing commercial aviation business to drive demand for aviation analytics
TABLE 106 RUSSIA: MARKET SIZE, BY BUSINESS FUNCTION, 2018–2021 (USD MILLION)
TABLE 107 RUSSIA: MARKET SIZE, BY BUSINESS FUNCTION, 2022–2027 (USD MILLION)
TABLE 108 RUSSIA: MARKET SIZE, BY COMPONENT, 2018–2021 (USD MILLION)
TABLE 109 RUSSIA: MARKET SIZE, BY COMPONENT, 2022–2027 (USD MILLION)
TABLE 110 RUSSIA: MARKET SIZE, BY END USER, 2018–2021 (USD MILLION)
TABLE 111 RUSSIA: MARKET SIZE, BY END USER, 2022–2027 (USD MILLION)
12.3.8 NETHERLANDS
12.3.8.1 Need for business analytics, corporate performance management, and advanced business architectures practices drives market
TABLE 112 NETHERLANDS: MARKET SIZE, BY BUSINESS FUNCTION, 2018–2021 (USD MILLION)
TABLE 113 NETHERLANDS: MARKET SIZE, BY BUSINESS FUNCTION, 2022–2027 (USD MILLION)
TABLE 114 NETHERLANDS: MARKET SIZE, BY COMPONENT, 2018–2021 (USD MILLION)
TABLE 115 NETHERLANDS: MARKET SIZE, BY COMPONENT, 2022–2027 (USD MILLION)
TABLE 116 NETHERLANDS: MARKET SIZE, BY END USER, 2018–2021 (USD MILLION)
TABLE 117 NETHERLANDS: MARKET SIZE, BY END USER, 2022–2027 (USD MILLION)
12.3.9 REST OF EUROPE
TABLE 118 REST OF EUROPE: MARKET SIZE, BY BUSINESS FUNCTION, 2018–2021 (USD MILLION)
TABLE 119 REST OF EUROPE: MARKET SIZE, BY BUSINESS FUNCTION, 2022–2027 (USD MILLION)
TABLE 120 REST OF EUROPE: MARKET SIZE, BY COMPONENT, 2018–2021 (USD MILLION)
TABLE 121 REST OF EUROPE: MARKET SIZE, BY COMPONENT, 2022–2027 (USD MILLION)
TABLE 122 REST OF EUROPE: MARKET SIZE, BY END USER, 2018–2021 (USD MILLION)
TABLE 123 REST OF EUROPE: MARKET SIZE, BY END USER, 2022–2027 (USD MILLION)
12.4 ASIA PACIFIC
12.4.1 PESTLE ANALYSIS: ASIA PACIFIC
FIGURE 30 ASIA PACIFIC MARKET SNAPSHOT
TABLE 124 ASIA PACIFIC: MARKET, BY BUSINESS FUNCTION, 2018–2021 (USD MILLION)
TABLE 125 ASIA PACIFIC: MARKET, BY BUSINESS FUNCTION, 2022–2027 (USD MILLION)
TABLE 126 ASIA PACIFIC: MARKET, BY COMPONENT, 2018–2021 (USD MILLION)
TABLE 127 ASIA PACIFIC: MARKET, BY COMPONENT, 2022–2027 (USD MILLION)
TABLE 128 ASIA PACIFIC: MARKET, BY END USER, 2018–2021 (USD MILLION)
TABLE 129 ASIA PACIFIC: MARKET, BY END USER, 2022–2027 (USD MILLION)
TABLE 130 ASIA PACIFIC: MARKET, BY COUNTRY, 2018–2021 (USD MILLION)
TABLE 131 ASIA PACIFIC: MARKET, BY COUNTRY, 2022–2027 (USD MILLION)
12.4.2 CHINA
12.4.2.1 Increased demand for air travel to contribute to market growth
TABLE 132 CHINA: MARKET, BY BUSINESS FUNCTION, 2018–2021 (USD MILLION)
TABLE 133 CHINA: MARKET, BY BUSINESS FUNCTION, 2022–2027 (USD MILLION)
TABLE 134 CHINA: MARKET, BY COMPONENT, 2018–2021 (USD MILLION)
TABLE 135 CHINA: MARKET, BY COMPONENT, 2022–2027 (USD MILLION)
TABLE 136 CHINA: MARKET, BY END USER, 2018–2021 (USD MILLION)
TABLE 137 CHINA: MARKET, BY END USER, 2022–2027 (USD MILLION)
12.4.3 JAPAN
12.4.3.1 Increasing demand for risk management and navigation solutions drives market
TABLE 138 JAPAN: MARKET, BY BUSINESS FUNCTION, 2018–2021 (USD MILLION)
TABLE 139 JAPAN: MARKET, BY BUSINESS FUNCTION, 2022–2027 (USD MILLION)
TABLE 140 JAPAN: MARKET, BY COMPONENT, 2018–2021 (USD MILLION)
TABLE 141 JAPAN: MARKET, BY COMPONENT, 2022–2027 (USD MILLION)
TABLE 142 JAPAN: MARKET, BY END USER, 2018–2021 (USD MILLION)
TABLE 143 JAPAN: MARKET, BY END USER, 2022–2027 (USD MILLION)
12.4.4 INDIA
12.4.4.1 High demand for automated enterprise resource planning (ERP) solutions by airports and airlines to drive market
TABLE 144 INDIA: MARKET, BY BUSINESS FUNCTION, 2018–2021 (USD MILLION)
TABLE 145 INDIA: MARKET, BY BUSINESS FUNCTION, 2022–2027 (USD MILLION)
TABLE 146 INDIA: MARKET, BY COMPONENT, 2018–2021 (USD MILLION)
TABLE 147 INDIA: MARKET, BY COMPONENT, 2022–2027 (USD MILLION)
TABLE 148 INDIA: MARKET, BY END USER, 2018–2021 (USD MILLION)
TABLE 149 INDIA: MARKET, BY END USER, 2022–2027 (USD MILLION)
12.4.5 SINGAPORE
12.4.5.1 Growing demand for data analytics tools to improve profitability
TABLE 150 SINGAPORE: MARKET, BY BUSINESS FUNCTION, 2018–2021 (USD MILLION)
TABLE 151 SINGAPORE: MARKET, BY BUSINESS FUNCTION, 2022–2027 (USD MILLION)
TABLE 152 SINGAPORE: MARKET, BY COMPONENT, 2018–2021 (USD MILLION)
TABLE 153 SINGAPORE: MARKET, BY COMPONENT, 2022–2027 (USD MILLION)
TABLE 154 SINGAPORE: MARKET, BY END USER, 2018–2021 (USD MILLION)
TABLE 155 SINGAPORE: MARKET, BY END USER, 2022–2027 (USD MILLION)
12.4.6 AUSTRALIA
12.4.6.1 Growing number of aircraft deliveries to drive market
TABLE 156 AUSTRALIA: MARKET, BY BUSINESS FUNCTION, 2018–2021 (USD MILLION)
TABLE 157 AUSTRALIA: MARKET, BY BUSINESS FUNCTION, 2022–2027 (USD MILLION)
TABLE 158 AUSTRALIA: MARKET, BY COMPONENT, 2018–2021 (USD MILLION)
TABLE 159 AUSTRALIA: MARKET, BY COMPONENT, 2022–2027 (USD MILLION)
TABLE 160 AUSTRALIA: MARKET, BY END USER, 2018–2021 (USD MILLION)
TABLE 161 AUSTRALIA: MARKET, BY END USER, 2022–2027 (USD MILLION)
12.4.7 REST OF ASIA PACIFIC
TABLE 162 REST OF ASIA PACIFIC: MARKET, BY BUSINESS FUNCTION, 2018–2021 (USD MILLION)
TABLE 163 REST OF ASIA PACIFIC: MARKET, BY BUSINESS FUNCTION, 2022–2027 (USD MILLION)
TABLE 164 REST OF ASIA PACIFIC: MARKET, BY COMPONENT, 2018–2021 (USD MILLION)
TABLE 165 REST OF ASIA PACIFIC: MARKET, BY COMPONENT, 2022–2027 (USD MILLION)
TABLE 166 REST OF ASIA PACIFIC: MARKET, BY END USER, 2018–2021 (USD MILLION)
TABLE 167 REST OF ASIA PACIFIC: MARKET, BY END USER, 2022–2027 (USD MILLION)
12.5 MIDDLE EAST
12.5.1 PESTLE ANALYSIS: MIDDLE EAST
FIGURE 31 MIDDLE EAST MARKET SNAPSHOT
TABLE 168 MIDDLE EAST: MARKET, BY BUSINESS FUNCTION, 2018–2021 (USD MILLION)
TABLE 169 MIDDLE EAST: MARKET, BY BUSINESS FUNCTION, 2022–2027 (USD MILLION)
TABLE 170 MIDDLE EAST: MARKET, BY COMPONENT, 2018–2021 (USD MILLION)
TABLE 171 MIDDLE EAST: MARKET, BY COMPONENT, 2022–2027 (USD MILLION)
TABLE 172 MIDDLE EAST: MARKET, BY END USER, 2018–2021 (USD MILLION)
TABLE 173 MIDDLE EAST: MARKET, BY END USER, 2022–2027 (USD MILLION)
TABLE 174 MIDDLE EAST: MARKET, BY COUNTRY, 2018–2021 (USD MILLION)
TABLE 175 MIDDLE EAST: MARKET, BY COUNTRY, 2022–2027 (USD MILLION)
12.5.2 SAUDI ARABIA
12.5.2.1 Increased air travel projected to contribute to market growth
TABLE 176 SAUDI ARABIA: MARKET, BY BUSINESS FUNCTION, 2018–2021 (USD MILLION)
TABLE 177 SAUDI ARABIA: MARKET, BY BUSINESS FUNCTION, 2022–2027 (USD MILLION)
TABLE 178 SAUDI ARABIA: MARKET, BY COMPONENT, 2018–2021 (USD MILLION)
TABLE 179 SAUDI ARABIA: MARKET, BY COMPONENT, 2022–2027 (USD MILLION)
TABLE 180 SAUDI ARABIA: MARKET, BY END USER, 2018–2021 (USD MILLION)
TABLE 181 SAUDI ARABIA: MARKET, BY END USER, 2022–2027 (USD MILLION)
12.5.3 UAE
12.5.3.1 Increasing demand for business analytics functions for aviation industry
TABLE 182 UAE: MARKET, BY BUSINESS FUNCTION, 2018–2021 (USD MILLION)
TABLE 183 UAE: MARKET, BY BUSINESS FUNCTION, 2022–2027 (USD MILLION)
TABLE 184 UAE: MARKET, BY COMPONENT, 2018–2021 (USD MILLION)
TABLE 185 UAE: MARKET, BY COMPONENT, 2022–2027 (USD MILLION)
TABLE 186 UAE: MARKET, BY END USER, 2018–2021 (USD MILLION)
TABLE 187 UAE: MARKET, BY END USER, 2022–2027 (USD MILLION)
12.5.4 ISRAEL
12.5.4.1 Growing deliveries of passenger aircraft drive demand for aviation analytics
TABLE 188 ISRAEL: MARKET, BY BUSINESS FUNCTION, 2018–2021 (USD MILLION)
TABLE 189 ISRAEL: MARKET, BY BUSINESS FUNCTION, 2022–2027 (USD MILLION)
TABLE 190 ISRAEL: MARKET, BY COMPONENT, 2018–2021 (USD MILLION)
TABLE 191 ISRAEL: MARKET, BY COMPONENT, 2022–2027 (USD MILLION)
TABLE 192 ISRAEL: MARKET, BY END USER, 2018–2021 (USD MILLION)
TABLE 193 ISRAEL: MARKET, BY END USER, 2022–2027 (USD MILLION)
12.5.5 QATAR
12.5.5.1 Emphasis on flight security using data analytics expected to drive market
TABLE 194 QATAR: MARKET, BY BUSINESS FUNCTION, 2018–2021 (USD MILLION)
TABLE 195 QATAR: MARKET, BY BUSINESS FUNCTION, 2022–2027 (USD MILLION)
TABLE 196 QATAR: MARKET, BY COMPONENT, 2018–2021 (USD MILLION)
TABLE 197 QATAR: MARKET, BY COMPONENT, 2022–2027 (USD MILLION)
TABLE 198 QATAR: MARKET, BY END USER, 2018–2021 (USD MILLION)
TABLE 199 QATAR: MARKET, BY END USER, 2022–2027 (USD MILLION)
12.5.6 REST OF MIDDLE EAST
TABLE 200 REST OF MIDDLE EAST: MARKET, BY BUSINESS FUNCTION, 2018–2021 (USD MILLION)
TABLE 201 REST OF MIDDLE EAST: MARKET, BY BUSINESS FUNCTION, 2022–2027 (USD MILLION)
TABLE 202 REST OF MIDDLE EAST: MARKET, BY COMPONENT, 2018–2021 (USD MILLION)
TABLE 203 REST OF MIDDLE EAST: MARKET, BY COMPONENT, 2022–2027 (USD MILLION)
TABLE 204 REST OF MIDDLE EAST: MARKET, BY END USER, 2018–2021 (USD MILLION)
TABLE 205 REST OF MIDDLE EAST: MARKET, BY END USER, 2022–2027 (USD MILLION)
12.6 REST OF THE WORLD (ROW)
12.6.1 PESTLE ANALYSIS: REST OF THE WORLD
TABLE 206 ROW: MARKET, BY BUSINESS FUNCTION, 2018–2021 (USD MILLION)
TABLE 207 ROW: MARKET, BY BUSINESS FUNCTION, 2022–2027 (USD MILLION)
TABLE 208 ROW: MARKET SIZE, BY COMPONENT, 2018–2021 (USD MILLION)
TABLE 209 ROW: MARKET SIZE, BY COMPONENT, 2022–2027 (USD MILLION)
TABLE 210 ROW: MARKET, BY END USER, 2018–2021 (USD MILLION)
TABLE 211 ROW: MARKET, BY END USER, 2022–2027 (USD MILLION)
TABLE 212 ROW: MARKET, BY REGION, 2018–2021 (USD MILLION)
TABLE 213 ROW: MARKET, BY REGION, 2022–2027 (USD MILLION)
12.6.2 LATIN AMERICA
12.6.2.1 Growth of low-cost carriers and emphasis on profitability of aviation operations to drive demand for aviation analytics
TABLE 214 LATIN AMERICA: MARKET, BY BUSINESS FUNCTION, 2018–2021 (USD MILLION)
TABLE 215 LATIN AMERICA: MARKET, BY BUSINESS FUNCTION, 2022–2027 (USD MILLION)
TABLE 216 LATIN AMERICA: MARKET SIZE, BY COMPONENT, 2018–2021 (USD MILLION)
TABLE 217 LATIN AMERICA: MARKET SIZE, BY COMPONENT, 2022–2027 (USD MILLION)
TABLE 218 LATIN AMERICA: MARKET, BY END USER, 2018–2021 (USD MILLION)
TABLE 219 LATIN AMERICA: MARKET, BY END USER, 2022–2027 (USD MILLION)
12.6.3 AFRICA
12.6.3.1 Growth in tourism activities and airline capacities to drive market
TABLE 220 AFRICA: MARKET, BY BUSINESS FUNCTION, 2018–2021 (USD MILLION)
TABLE 221 AFRICA: MARKET, BY BUSINESS FUNCTION, 2022–2027 (USD MILLION)
TABLE 222 AFRICA: MARKET, BY COMPONENT, 2018–2021 (USD MILLION)
TABLE 223 AFRICA: MARKET, BY COMPONENT, 2022–2027 (USD MILLION)
TABLE 224 AFRICA: MARKET, BY END USER, 2018–2021 (USD MILLION)
TABLE 225 AFRICA: MARKET, BY END USER, 2022–2027 (USD MILLION)
13 COMPETITIVE LANDSCAPE (Page No. - 169)
13.1 INTRODUCTION
TABLE 226 KEY DEVELOPMENTS BY LEADING PLAYERS IN MARKET BETWEEN 2019 AND 2022
13.2 MARKET RANKING ANALYSIS OF KEY PLAYERS, 2021
FIGURE 32 RANKING ANALYSIS OF TOP 5 PLAYERS: MARKET, 2021
13.3 REVENUE ANALYSIS OF KEY PLAYERS, 2021
FIGURE 33 REVENUE ANALYSIS OF KEY COMPANIES (2019–2021)
13.4 MARKET SHARE ANALYSIS, 2021
FIGURE 34 MARKET SHARE ANALYSIS OF TOP PLAYERS IN MARKET, 2021
TABLE 227 MARKET: DEGREE OF COMPETITION
13.5 COMPANY EVALUATION QUADRANT
13.5.1 MARKET: COMPETITIVE LEADERSHIP MAPPING
13.5.1.1 Stars
13.5.1.2 Pervasive players
13.5.1.3 Emerging leaders
13.5.1.4 Participants
FIGURE 35 MARKET (GLOBAL) COMPANY EVALUATION MATRIX, 2021
13.5.2 AVIATION ANALYTICS: COMPETITIVE LEADERSHIP MAPPING (SME)
13.5.2.1 Progressive companies
13.5.2.2 Responsive companies
13.5.2.3 Starting blocks
13.5.2.4 Dynamic companies
FIGURE 36 MARKET (SME) COMPANY LEADERSHIP MAPPING, 2021
TABLE 228 MARKET: KEY START-UPS/SMES
13.6 COMPETITIVE BENCHMARKING
TABLE 229 MARKET: COMPANY FOOTPRINT
TABLE 230 COMPANY REGION FOOTPRINT
13.7 COMPETITIVE SCENARIO AND TRENDS
13.7.1 PRODUCT LAUNCHES
TABLE 231 MARKET: PRODUCT LAUNCHES, 2019–2022
13.7.2 DEALS
TABLE 232 MARKET: DEALS, 2019–2022
14 COMPANY PROFILES (Page No. - 193)
14.1 INTRODUCTION
(Business overview, Products/Solutions/Services offered, Recent developments & MnM View)*
14.2 KEY COMPANIES
14.2.1 IBM CORPORATION
TABLE 233 IBM CORPORATION: BUSINESS OVERVIEW
FIGURE 37 IBM CORPORATION: COMPANY SNAPSHOT
TABLE 234 IBM CORPORATION: PRODUCTS/SOLUTIONS/SERVICES OFFERED
TABLE 235 IBM CORPORATION: DEALS
14.2.2 GENERAL ELECTRIC
TABLE 236 GENERAL ELECTRIC: BUSINESS OVERVIEW
FIGURE 38 GENERAL ELECTRIC: COMPANY SNAPSHOT
TABLE 237 GENERAL ELECTRIC: PRODUCTS/SOLUTIONS/SERVICES OFFERED
TABLE 238 GENERAL ELECTRIC: PRODUCT LAUNCHES
TABLE 239 GENERAL ELECTRIC: DEALS
14.2.3 ORACLE CORPORATION
TABLE 240 ORACLE CORPORATION: BUSINESS OVERVIEW
FIGURE 39 ORACLE CORPORATION: COMPANY SNAPSHOT
TABLE 241 ORACLE CORPORATION: PRODUCTS/SOLUTIONS/SERVICES OFFERED
TABLE 242 ORACLE CORPORATION: PRODUCT LAUNCHES
TABLE 243 ORACLE CORPORATION: DEALS
14.2.4 SAP SE
TABLE 244 SAP SE: BUSINESS OVERVIEW
FIGURE 40 SAP SE: COMPANY SNAPSHOT
TABLE 245 SAP SE: PRODUCTS/SOLUTIONS/SERVICES OFFERED
TABLE 246 SAP SE: DEALS
14.2.5 RAMCO SYSTEMS
TABLE 247 RAMCO SYSTEMS: BUSINESS OVERVIEW
FIGURE 41 RAMCO SYSTEMS: COMPANY SNAPSHOT
TABLE 248 RAMCO SYSTEMS: PRODUCTS/SOLUTIONS/SERVICES OFFERED
TABLE 249 RAMCO SYSTEMS: DEALS
14.2.6 CAPGEMINI
TABLE 250 CAPGEMINI: BUSINESS OVERVIEW
FIGURE 42 CAPGEMINI: COMPANY SNAPSHOT
TABLE 251 CAPGEMINI: PRODUCTS/SOLUTIONS/SERVICES OFFERED
TABLE 252 CAPGEMINI: DEALS
14.2.7 HEXAWARE TECHNOLOGIES
TABLE 253 HEXAWARE TECHNOLOGIES: BUSINESS OVERVIEW
FIGURE 43 HEXAWARE TECHNOLOGIES: COMPANY SNAPSHOT
TABLE 254 HEXAWARE TECHNOLOGIES: PRODUCTS/SOLUTIONS/SERVICES OFFERED
TABLE 255 HEXAWARE TECHNOLOGIES: DEALS
14.2.8 HONEYWELL INTERNATIONAL
TABLE 256 HONEYWELL INTERNATIONAL: BUSINESS OVERVIEW
FIGURE 44 HONEYWELL INTERNATIONAL: COMPANY SNAPSHOT
TABLE 257 HONEYWELL INTERNATIONAL: PRODUCTS/SOLUTIONS/SERVICES OFFERED
TABLE 258 HONEYWELL INTERNATIONAL: DEALS
14.2.9 LUFTHANSA TECHNIK
TABLE 259 LUFTHANSA TECHNIK: BUSINESS OVERVIEW
TABLE 260 LUFTHANSA TECHNIK: PRODUCTS/SOLUTIONS/SERVICES OFFERED
TABLE 261 LUFTHANSA TECHNIK: PRODUCT LAUNCHES
TABLE 262 LUFTHANSA TECHNIK: DEALS
14.2.10 IFS AB
TABLE 263 IFS AB: BUSINESS OVERVIEW
TABLE 264 IFS AB: PRODUCTS/SOLUTIONS/SERVICES OFFERED
TABLE 265 IFS AB: DEALS
14.2.11 WINAIR
TABLE 266 WINAIR: BUSINESS OVERVIEW
TABLE 267 WINAIR: PRODUCTS/SOLUTIONS/SERVICES OFFERED
TABLE 268 WINAIR: DEALS
14.2.12 SAS INSTITUTE
TABLE 269 SAS INSTITUTE: BUSINESS OVERVIEW
TABLE 270 SAS INSTITUTE: PRODUCTS/SOLUTIONS/SERVICES OFFERED
TABLE 271 SAS INSTITUTE: DEALS
14.2.13 SITA
TABLE 272 SITA: BUSINESS OVERVIEW
TABLE 273 SITA: PRODUCTS/SOLUTIONS/SERVICES OFFERED
TABLE 274 SITA: DEALS
14.2.14 BOOZ ALLEN HAMILTON
TABLE 275 BOOZ ALLEN HAMILTON: BUSINESS OVERVIEW
TABLE 276 BOOZ ALLEN HAMILTON: PRODUCTS/SOLUTIONS/SERVICES OFFERED
14.2.15 MERCATOR
TABLE 277 MERCATOR: BUSINESS OVERVIEW
TABLE 278 MERCATOR: PRODUCTS/SOLUTIONS/SERVICES OFFERED
*Details on Business overview, Products/Solutions/Services offered, Recent developments & MnM View might not be captured in case of unlisted companies.
14.3 OTHER PLAYERS
14.3.1 ATHEER AIR
TABLE 279 ATHEER AIR: COMPANY OVERVIEW
14.3.2 MU SIGMA
TABLE 280 MU SIGMA: COMPANY OVERVIEW
14.3.3 SWISS AVIATION SOFTWARE
TABLE 281 SWISS AVIATION SOFTWARE: COMPANY OVERVIEW
14.3.4 GRAYMATTER SOFTWARE SERVICES
TABLE 282 GRAYMATTER SOFTWARE SERVICES: COMPANY OVERVIEW
14.3.5 BEEP ANALYTICS
TABLE 283 BEEP ANALYTICS: COMPANY OVERVIEW
14.3.6 ZESTIOT
TABLE 284 ZESTIOT: COMPANY OVERVIEW
14.3.7 IBS SOFTWARE SERVICES
TABLE 285 IBS SOFTWARE SERVICES: COMPANY OVERVIEW
14.3.8 AVIATION INTELLIGENCE
TABLE 286 AVIATION INTELLIGENCE: COMPANY OVERVIEW
14.3.9 INNODATATICS INC.
TABLE 287 INNODATATICS INC.: COMPANY OVERVIEW
14.3.10 AEROFICIAL INTELLIGENCE
TABLE 288 AEROFICIAL INTELLIGENCE: COMPANY OVERVIEW
15 APPENDIX (Page No. - 242)
15.1 DISCUSSION GUIDE
15.2 KNOWLEDGESTORE: MARKETSANDMARKETS’ SUBSCRIPTION PORTAL
15.3 AVAILABLE CUSTOMIZATIONS
15.4 RELATED REPORTS
15.5 AUTHOR DETAILS
The study involved various activities in estimating the market size for aviation analytics. Exhaustive secondary research was undertaken to collect information on the aviation analytics market, its adjacent markets, and its parent market. The next step was to validate these findings, assumptions, and sizing with the industry experts across the value chain through primary research. Both demand- and supply-side analyses were carried out to estimate the overall size of the market. Thereafter, market breakdown and data triangulation procedures were used to estimate the sizes of different segments and subsegments of the aviation analytics market.
Secondary Research
In the secondary research process, various secondary sources, such as annual reports, European Aviation Safety Agency, United Nations Conference on Trade and Development (UNCTAD), press releases & investor presentations of companies, certified publications, and articles by recognized authors were referred to for identifying and collecting information on the aviation analytics market.
Primary Research
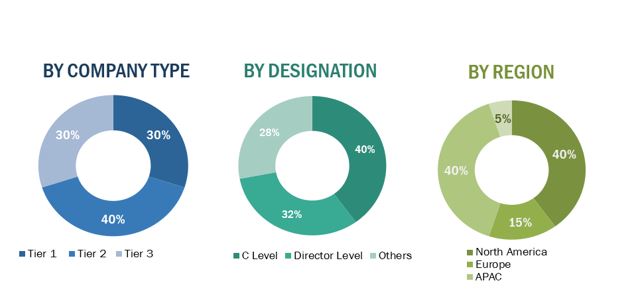
The aviation analytics market comprises several stakeholders such as aircraft MROs, airlines & aircraft operators, aircraft manufacturers, lessors, aircraft engine manufacturers, regulatory bodies, research institutes and organizations, wholesalers, retailers, and distributors of aviation analytics software and services in its supply chain. The supply side is characterized by technological advancements taking place in the field of aviation analytics such as the predictive analytics, blockchain, artificial intelligence, big data analytics. The following is the breakdown of the primary respondents that were interviewed to obtain qualitative and quantitative information about the aviation analytics market.
To know about the assumptions considered for the study, download the pdf brochure
Market Size Estimation
Both, top-down and bottom-up approaches were used to estimate and validate the aviation analytics market size. These methods were also used extensively to estimate the size of various segments and subsegments of the market. The research methodology used to estimate the market size included the following steps:
- Key players in the industry and market were identified through extensive secondary research of their product matrix and geographical presence and developments undertaken by them.
- All percentage shares, splits, and breakdowns were determined using secondary sources and verified through primary sources.
Research Approach
Both top-down and bottom-up approaches were used to estimate and validate the total size of the aviation analytics market. These methods were also used extensively to estimate the size of various segments and subsegment of the market. The research methodology used to estimate the market size included the following:
- Key players in the industry and market were identified through extensive secondary research of their product matrix and geographical presence and developments undertaken by them.
- All percentage shares, splits, and breakdowns were determined using secondary sources and verified through primary sources.
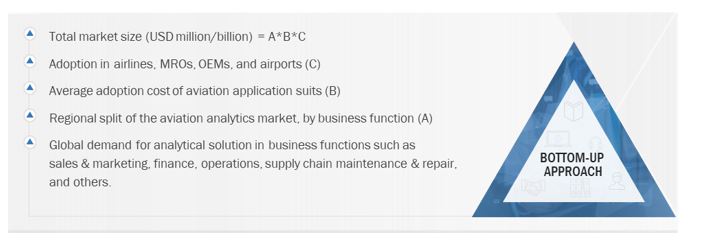
Global aviation analytics market Size: Bottom-Up Approach
Data Triangulation
After arriving at the overall size of the aviation analytics market using the market size estimation processes explained above, the market was split into several segments and subsegments. To complete the overall market engineering process and arrive at the exact statistics of each market segment and subsegment, data triangulation, and market breakdown procedures were employed, wherever applicable. The data was triangulated by studying various factors and trends from demand as well as supply sides of the aviation analytics market.
Objectives of the Report
- To define, describe, segment, and forecast the size of the aviation analytics market based on technology, application, end user, and region
- To understand the structure of the market by identifying its various segments and subsegments
- To forecast the size of various segments of the market with respect to four major regions, namely, North America, Europe, Asia Pacific, Middle East, and Rest of the World, along with the major countries in each of these regions
- To identify and analyze key drivers, restraints, opportunities, and challenges that influence the growth of the aviation analytics market
- To strategically analyze the micro-markets with respect to individual growth trends, prospects, and their contributions to the overall market
- To analyze the opportunities in the market for stakeholders by identifying key market trends
- To analyze competitive developments such as contracts, acquisitions, expansions, new product launches, and partnerships & agreements in the market
- To provide a detailed competitive landscape of the aviation analytics market, along with an analysis of the business and corporate strategies adopted by leading players
Available Customizations
MarketsandMarkets offers the following customizations for this market report:
- Additional country-level analysis of the aviation analytics market
- Profiling of additional market players (up to 5)
Product Analysis
- Product matrix, which provides a detailed comparison of the product portfolio of each company in the aviation analytics market
Growth opportunities and latent adjacency in Aviation Analytics Market