
Delivery Robots Market Size, Share & Trends

Delivery Robots Market Size, Share & Trends by Type (Indoor and Outdoor), Load Carrying Capacity (Up to 10 kg, more than 10 kg to 50 kg, more than 50 kg), Number of Wheels (3 wheels, 4 wheels, 6 wheels), Speed Limit, End-use Industry and Region - Global Forecast to 2030


DELIVERY ROBOTS MARKET SIZE, SHARE & TRENDS
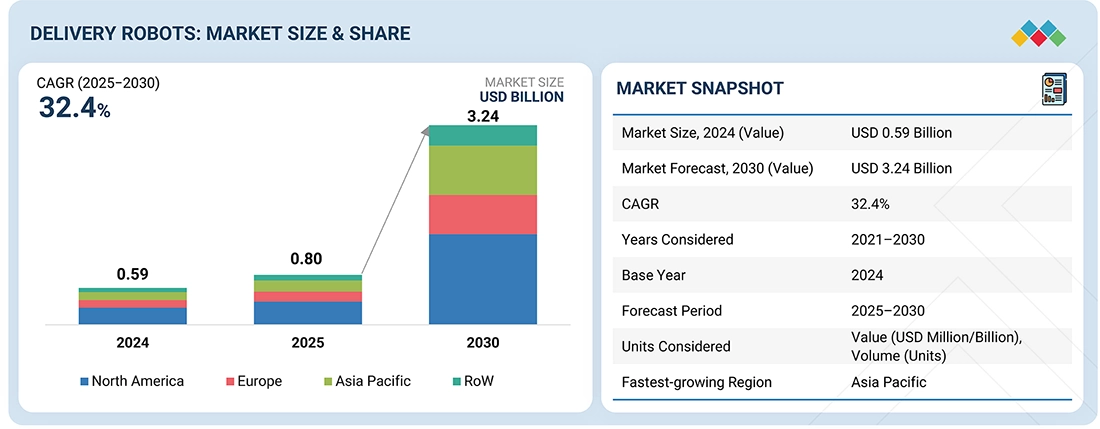
According to Marketsandmarkets, the Delivery Robots Market Size was valued at USD 0.80 billion in 2025 and is projected to reach USD 3.24 billion by 2030, growing at a CAGR of 32.4% from 2025 to 2030. The global delivery robot market is increasing robustly, driven by technological advancements, increasing demand for efficient last-mile delivery, and supporting government policies. Governments and organizations are influencing the market by enforcing regulations and carrying out activities that facilitate or prohibit the deployment of delivery robots.
MARKET SNAPSHOT TABLE
| REPORT METRIC | DETAILS |
|---|---|
| Market Size, 2025 (Value) | USD 0.80 Billion |
| Market Forecast, 2030 (Value) | USD 3.24 Billion |
| Growth Rate | CAGR of 32.4% from 2025 to 2030 |
| Years Considered | 2021–2030 |
| Base Year | 2024 |
| Forecast Period | 2025–2030 |
| Units Considered | Value (USD Million/Billion), Volume (Units) |
| Report Coverage | Revenue forecast, company ranking, competitive landscape, growth factors, and trends |
| Top Companies |
|
| Growth Driver |
|
| Segments Covered |
|
| Regions Covered | North America, Asia Pacific, Europe, Rest of the World (RoW) |
DELIVERY ROBOTS MARKET SIZE & FORECAST
DELIVERY ROBOTS MARKET KEY TAKEAWAYS
-
BY REGIONBy region, North America have dominated with a Delivery Robots Market Share of 47.6% in 2024.
-
BY LOAD CARRYING CAPACITYBy load carrying capcity, more than 50kg have dominated with a market share of 78.9% in 2024.
-
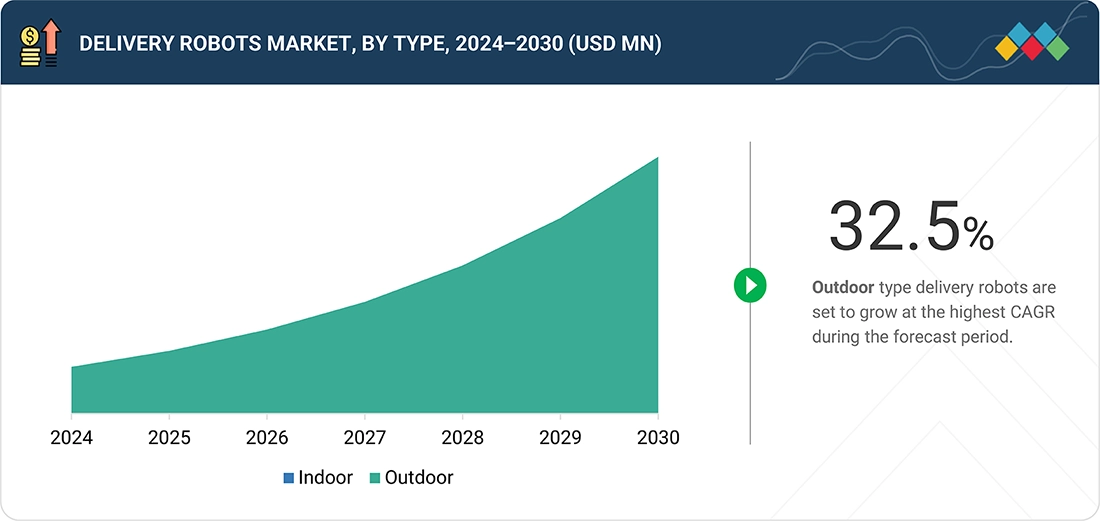
BY TYPEBy type, outdoor robots dominated with a market share of 93.0% in 2024.
-
BY NUMBER OF WHEELSBy number of wheels, 4-wheeled delivery robots dominated in 2024.
-
BY SPEED LIMITDelivery robots with speeds between 3 KPH and 6 KPH have dominated in 2024.
-
BY END-USE INDUSTRYThe retail end-use industry is poised to dominate the market.
-
COMPETITIVE LANDSCAPE (KEY PLAYERS)JD.com, Inc. (China) is identified as a star player. Relay Robotics, Inc. (US) is identified as an emerging leader in the market. Major market players have adopted both organic and inorganic strategies, including partnerships and investments.
-
COMPETITIVE LANDSCAPE (STARTUPS/SMES)Piaggio & C. SpA (Italy) is a progressive company in the delivery robots market, offering strong portfolios of solutions. TeleRetail (Germany) and ANYbotics (Switzerland) are recognized as responsive companies, possessing innovative solutions to cater to the future demands of clients for delivery robots.
The delivery robots industry is rapidly evolving as businesses increasingly turn to automation to overcome labor shortages and enhance operational efficiency. These robots are becoming essential in last-mile delivery, enabling contactless, reliable, and timely delivery of goods across retail, foodservice, and healthcare sectors. The ongoing advances in AI, sensor technology, and connectivity, coupled with supportive regulatory environments, are paving the way for broader adoption and integration into urban infrastructure.
Source: Secondary Research, Interviews with Experts, MarketsandMarkets Analysis
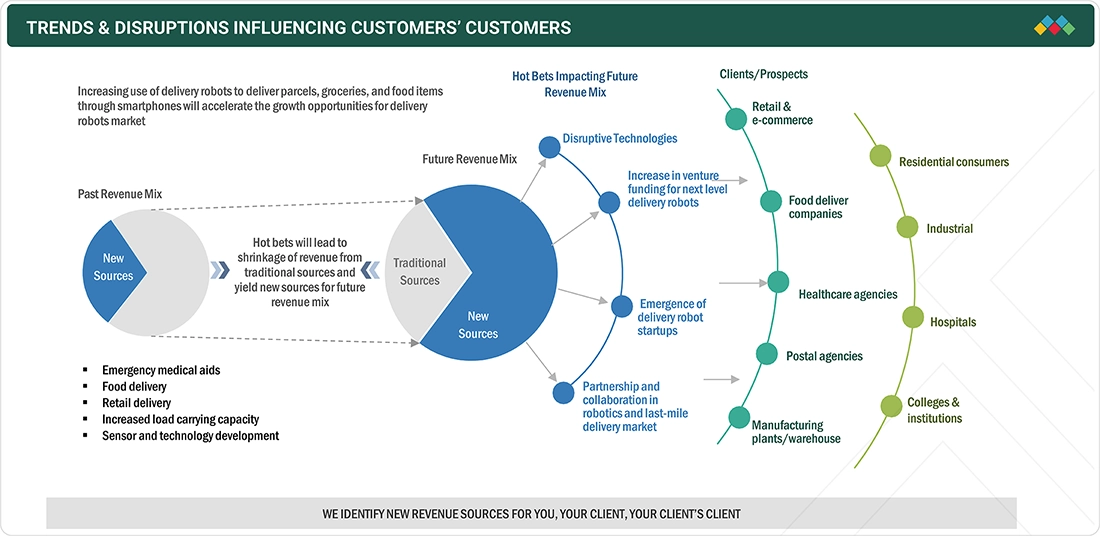
TRENDS & DISRUPTIONS IMPACTING CUSTOMERS' CUSTOMERS
The growing demand from the retail and food & beverage industries is driving the Delivery Robots Market Trends. Delivery robots are observing rapid technological improvements, which is another factor driving the market. The increasing integration of new technologies, such as AI, IoT, and Wi-Fi, is expected to drive the market for delivery robots. Manufacturers are also showcasing interest in video cameras, IR imaging, and advanced sensor technology, which helps increase imaging capabilities and allows delivery robots to inspect their surroundings, thereby enhancing safety within the premises.
Source: Secondary Research, Interviews with Experts, MarketsandMarkets Analysis
DELIVERY ROBOTS MARKET DYNAMICS
Level
-
Reduction in delivery costs in last-mile deliveries

-
Increase in venture funding

Level
-
Stringent regulations about the operations of delivery robots

Level
-
Worldwide growth of e-commerce market

-
Advancements in features of autonomous delivery robots

Level
-
Limited range of operation of ground delivery robots

-
Safety issues associated with operations of delivery robots in populated areas

Source: Secondary Research, Interviews with Experts, MarketsandMarkets Analysis
Driver: Reduction in delivery costs in last-mile deliveries
In the traditional method of product delivery, labor costs account for nearly 75% of the total delivery cost, while the remaining 25% comprises vehicle costs and fuel expenses. The deployment of autonomous delivery robots for product delivery will significantly reduce labor costs, constituting only 20–25% of the total delivery cost.
Restraint: Stringent regulations about the operations of delivery robots
The fact that delivery robots make use of public traffic areas designated for pedestrians binds them to operate under a legal, regulatory framework. Most Western legal authorities hold manufacturers responsible for the tort of negligence if their delivery robots cause damage or injury to a user or a nearby human.
Opportunity: Worldwide growth of e-commerce market
E-commerce is a rapidly growing industry with no signs of decline in the near future. Even some giant offline retailers are going online because people worldwide have started preferring online shopping due to the huge discounts and smooth delivery to their doorstep.
Challenge: Limited range of operation of ground delivery robots
It requires a set of tasks, such as building a map of the environment, localizing the robot within that map, and creating a motion plan based on the map, to be performed simultaneously so that the robots can travel or be operated easily in an uncontrolled environment or without any human intervention.
DELIVERY ROBOTS MARKET SIZE, SHARE & GROWTH, 2030: COMMERCIAL USE CASES ACROSS INDUSTRIES
| COMPANY | USE CASE DESCRIPTION | BENEFITS |
|---|---|---|
 |
Autonomous sidewalk delivery in urban and campus environments | Reduces last-mile delivery costs, enables contactless service, operates 24/7 with high safety |
 |
Autonomous local grocery and food delivery using small, driverless vehicles | Expands delivery range, lowers labor dependence, improves delivery speed and customer reach |
 |
Industrial AMRs for warehouse and factory transport of goods | Enhances operational efficiency, reduces labor strain, and supports high load capacity logistics |
Logos and trademarks shown above are the property of their respective owners. Their use here is for informational and illustrative purposes only.
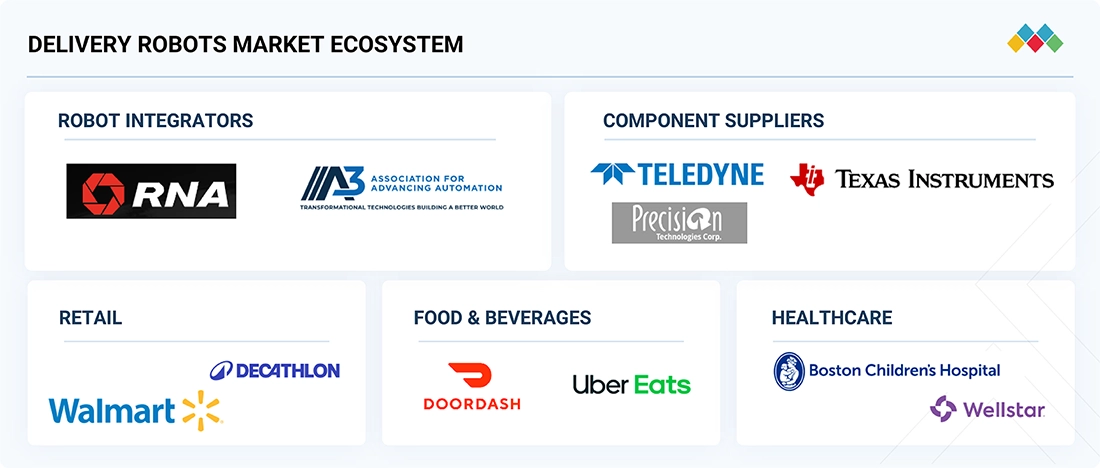
DELIVERY ROBOTS MARKET ECOSYSTEM
Various companies are involved in different stages of the ecosystem. A few players that provide components for delivery robots companies include Teledyne Lumenera (Canada), Precision Technologies (US), and Texas Instruments Incorporated (US), among others. Delivery robots are used in food & beverage, retail, healthcare, postal, and many other applications. Delivery robots are mostly used to deliver packages to customers from warehouses, retail stores, or grocery stores. New opportunities are emerging for players offering delivery robots due to the global growth of the e-commerce market.
Logos and trademarks shown above are the property of their respective owners. Their use here is for informational and illustrative purposes only.
DELIVERY ROBOTS MARKET SEGMENTS
Source: Secondary Research, Interviews with Experts, MarketsandMarkets Analysis
Delivery Robots Market, by Number of Wheels
The growth of six-wheel delivery robots is driven by their superior stability and ability to navigate complex terrains, making them suitable for suburban, semi-urban, and challenging environments. Their enhanced payload capacity and durability in diverse conditions position them as a preferred choice for long-range, heavy-duty, and industrial last-mile delivery applications, which are expected to see the fastest growth in the market.
Delivery Robots Market, by Load Carrying Capacity
Delivery robots with a carrying capacity of more than 50 kg are expected to have the largest market size due to their ability to handle bulk deliveries in retail warehousing, industrial parks, and healthcare supply chains. Their heavy-duty capabilities reduce reliance on human labor and are well-suited for complex environments and long-distance deliveries, driving significant demand from logistics and e-commerce sectors. These robots offer operational efficiency and cost savings for large-scale deliveries, making them integral to future last-mile delivery solutions.
Delivery Robots Market, by Type
The outdoor delivery robots segment is projected to experience a higher growth rate in the coming years. This is primarily due to the increasing demand for efficient and contactless last-mile delivery services. As e-commerce continues to boom and urban populations grow, outdoor delivery robots offer a scalable and sustainable solution.
Delivery Robots Market, by Speed Limit
In 2024, robots with a speed limit of higher than 3 KPH up to 6 KPH held the largest share of the delivery robots market, in terms of value. Many delivery robot manufacturing companies are working with a mission to minimize delivery costs; hence, they produce delivery robots with operating speeds of higher than 3 KPH up to 6 KPH.
Delivery Robots Market, by End-use Industry
The retail industry held the largest share of the delivery robots market in 2024. The ever-increasing trend of online shopping is expected to drive demand for delivery robots in e-commerce applications within the retail industry over the next few years. Once the rules and regulations for operating delivery robots are established worldwide, these robots will also be adopted for cargo deliveries, which is a significant factor that is likely to fuel the market's growth.
DELIVERY ROBOTS MARKET BY REGION
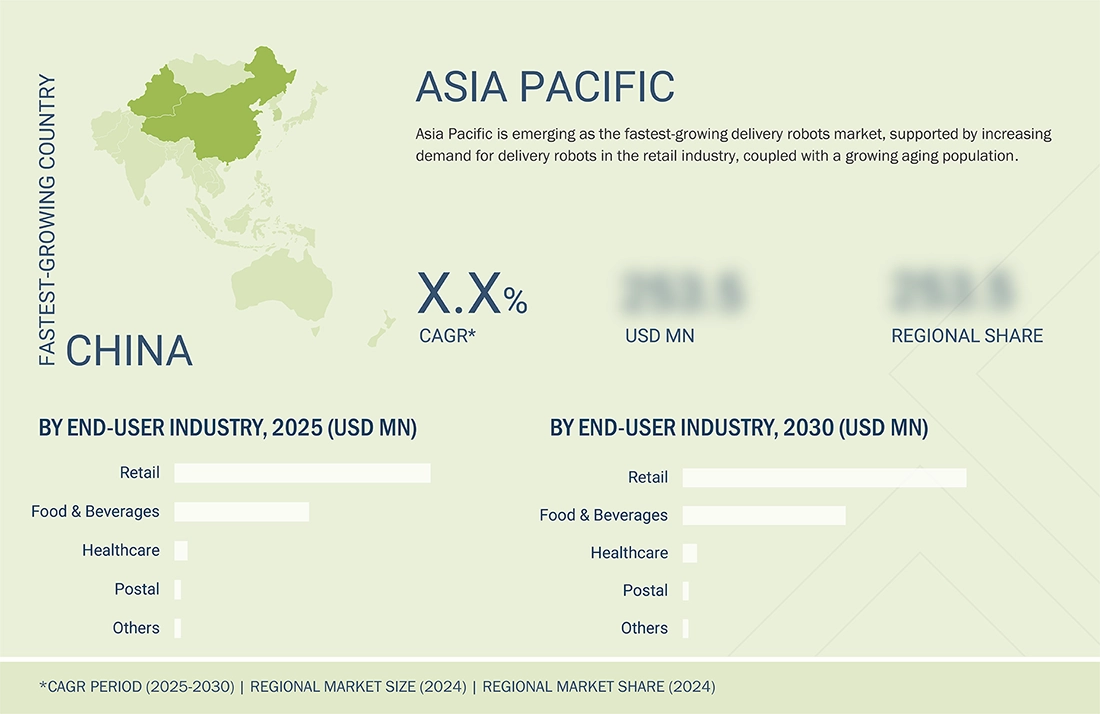
Asia Pacific to be fastest-growing region in global delivery robots market during forecast period
In Asia Pacific, China and Japan accounted for notable market shares. Australia, South Korea, and other countries also play a significant role in the delivery robots market growth in Asia Pacific. The growing awareness regarding the benefits of using delivery robots and the rapid inclusion of robotics in academic and educational institutions are expected to drive market growth. Apart from this, the absence of any regulations or regulatory bodies in Asia Pacific countries for operating delivery robots is also fueling market growth.
DELIVERY ROBOTS MARKET SIZE, SHARE & GROWTH, 2030: COMPANY EVALUATION MATRIX
Stars generally receive high scores for most of the evaluation criteria. They have strong service portfolios, a robust market presence, and effective business strategies. These are the leading market players in terms of new developments, such as product launches, innovative technologies, and the adoption of strategic growth plans. JD.com, Inc. (China) comes under this category. Emerging leaders demonstrate a more substantial product innovation than their competitors. They have a highly focused product portfolio. However, they lack effective growth strategies for their overall business. Relay Robotics, Inc. (US) comes under this category.
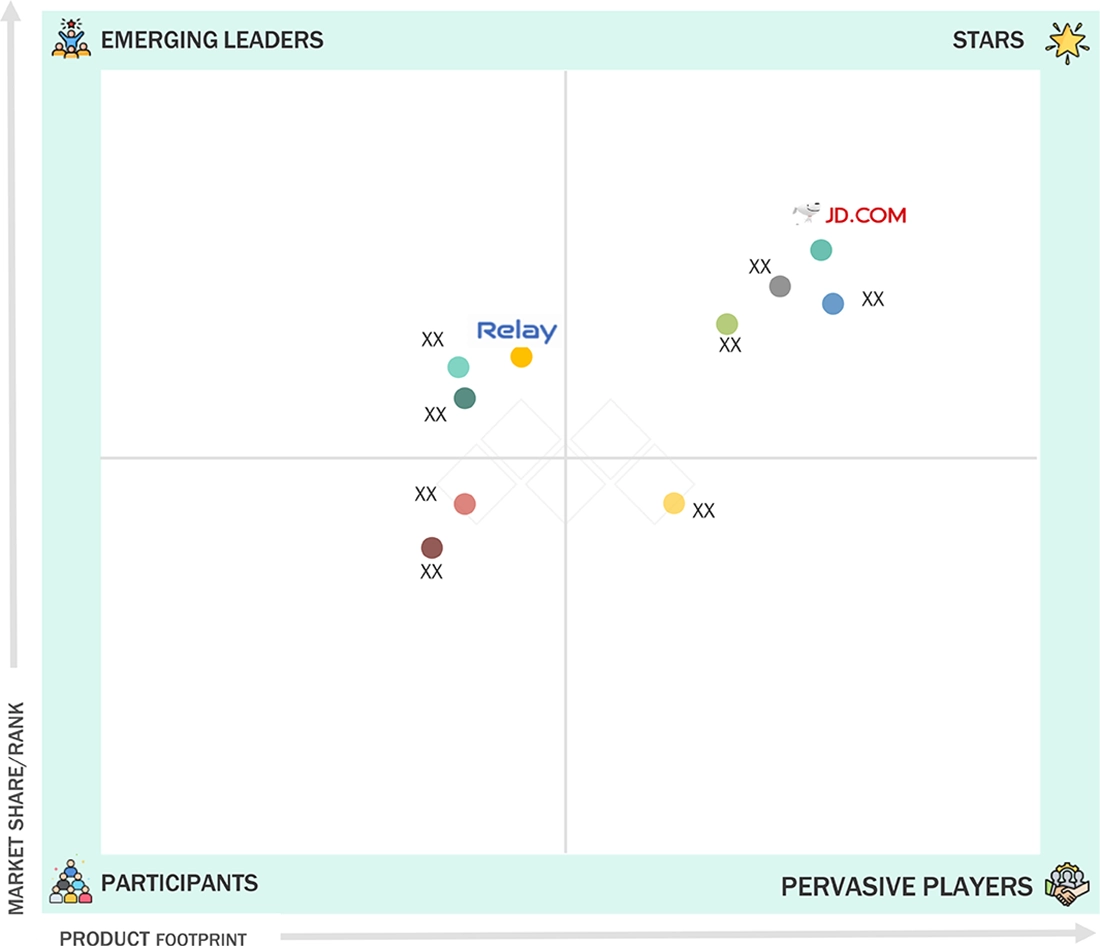
Source: Secondary Research, Interviews with Experts, MarketsandMarkets Analysis
DELIVERY ROBOTS MARKET KEY PLAYERS
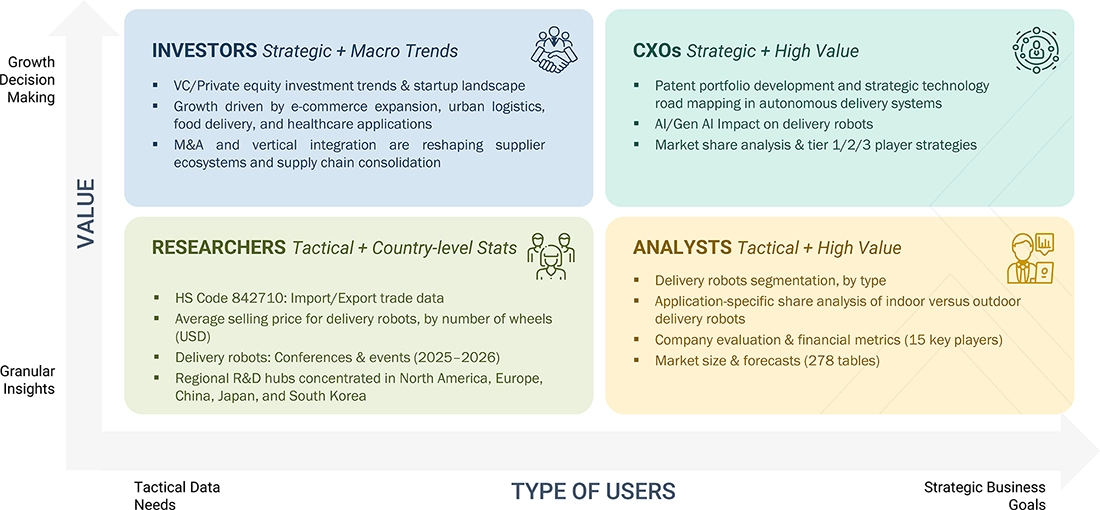
WHAT IS IN IT FOR YOU: DELIVERY ROBOTS MARKET SIZE, SHARE & GROWTH, 2030 REPORT CONTENT GUIDE
DELIVERED CUSTOMIZATIONS
We have successfully delivered the following deep-dive customizations:
| CLIENT REQUEST | CUSTOMIZATION DELIVERED | VALUE ADDS |
|---|---|---|
| Leading Retail & E-commerce OEM | Competitive profiling of delivery robot suppliers (payload capacity, navigation tech, operational geography) | Identify qualified delivery robot partners |
| Logistics & Supply Chain Operator | Benchmarking of delivery robot adoption across urban, campus, industrial, and healthcare applications | Switching cost analysis for robotic fleet integration |
| Delivery Service Platform | Regional and global ecosystem analysis of delivery robot platforms and logistics network integration | Identification of high-demand market segments |
RECENT DEVELOPMENTS
- August 2024 : Grubhub (US) and Starship Technologies (US), in partnership with UNM Food (Mexico), launched a robot food delivery service on The University of New Mexico’s (UNM) campus.
- April 2024 : Kiwibot (US) announced that it had acquired Auto Mobility Solutions (Taiwan), a firm that produces chips specifically for robotics and autonomous driving tech.
- February 2024 : Nuro, Inc. (US) partnered with chip designer Arm Limited (UK) to help develop its third-generation vehicle. The partnership was expected to enhance the capabilities and range of Nuro’s electric-powered robots, as well as fast-track the production and commercialization of the company’s delivery service.
- January 2024 : JD.com, Inc. (China) announced expanding the reach of its logistics service into North America and Europe. The company's logistics arm launched an international express delivery service from China to North America and Europe. It will initially cover deliveries in 23 countries in North America and Europe.
- Jun 2023 : Relay Robotics Inc. (US) unveiled its latest hotel delivery robot, Relay2, at the NYU International Hospitality Industry Investment Conference. The newly launched robot is said to have twice the capacity of previous models but retains the streamlined design. The company claims that Relay2 can deliver guest orders from the front desk or kitchen to hotel guest rooms in under four minutes on average.
Table of Contents
 Exclusive indicates content/data unique to MarketsandMarkets and not available with any competitors.
Methodology
The research process for this study included systematic gathering, recording, and analysis of data about customers and companies operating in the delivery robots market. This research study involved the extensive use of secondary sources, directories, and databases (Factiva, Oanda, and OneSource) for identifying and collecting valuable information for this extensive technical, market-oriented, and commercial study of the delivery robots market. In-depth interviews have been conducted with various primary respondents, including experts from core and related industries and preferred manufacturers, to obtain and verify critical qualitative and quantitative information, as well as to assess growth prospects. Key players in the delivery robots market have been identified through secondary research, and their market rankings have been determined through primary and secondary research. This research included studying annual reports of top players and interviewing key industry experts, such as CEOs, directors, and marketing executives.
Secondary Research
In the secondary research process, various secondary sources have been referred to for identifying and collecting information pertinent to this study. The secondary sources include annual reports, press releases, and investor presentations of companies; white papers, certified publications, and articles by recognized authors; directories; and databases. Secondary research has been mainly carried out to obtain key information about the supply chain of the delivery robots industry, the value chain of the market, the total pool of the key players, market classification and segmentation according to the industry trends to the bottom-most level, geographic markets, and key developments from both market- and technology-oriented perspectives.
Primary Research
In the primary research process, various primary sources from the supply and demand sides have been interviewed to obtain qualitative and quantitative information for this report. Primary sources from the supply side included industry experts such as CEOs, VPs, marketing directors, technology and innovation directors, and key executives from major companies and organizations operating in the delivery robots market.
After going through the entire market engineering (which includes calculations for market statistics, market breakdown, market size estimations, market forecasting, and data triangulation), extensive primary research has been conducted to gather information and verify and validate the obtained critical numbers. Primary research has been conducted to identify segmentation types, industry trends, key players, competitive landscape, and key market dynamics such as drivers, restraints, opportunities, and challenges, along with the key strategies adopted by players operating in the market.

Note: Other designations include sales managers, marketing managers, and production managers. Three tiers of companies have been defined based on their total/segmental revenue as of 2024; tier 1: revenue greater than or equal to USD 1 billion; tier 2: revenue between USD 100 million and USD 1 billion; and tier 3: revenue lesser than or equal to USD 100 million.
To know about the assumptions considered for the study, download the pdf brochure
Market Size Estimation
In the complete market engineering process, both top-down and bottom-up approaches have been used, along with several data triangulation methods, to estimate and forecast the size of the market and its segments and subsegments listed in the report. Extensive qualitative and quantitative analyses have been carried out on the complete market engineering process to list the key information/insights pertaining to the delivery robots market.
The key players in the market have been identified through secondary research, and their rankings in the respective regions have been determined through primary and secondary research. This entire procedure involved the study of the annual and financial reports of top players, as well as interviews with industry experts such as chief executive officers, vice presidents, directors, and marketing executives for both quantitative and qualitative key insights. All percentage shares, splits, and breakdowns have been determined using secondary sources and verified through primary sources. All parameters that affect the markets covered in this research study have been accounted for, viewed in extensive detail, verified through primary research, and analyzed to obtain the final quantitative and qualitative data. This data has been consolidated and enhanced with detailed inputs and analysis from MarketsandMarkets and presented in this report.
Delivery Robots Market : Top-Down and Bottom-Up Approach

Data Triangulation
After arriving at the overall market size from the estimation process explained above, the total market has been split into several segments and subsegments. To complete the overall market engineering process and arrive at the exact statistics for all the segments and subsegments, data triangulation and market breakdown procedures have been employed, wherever applicable. The data has been triangulated by studying various factors and trends from both the demand and supply sides. The market has also been validated using both top-down and bottom-up approaches.
Market Definition
Autonomous guided vehicles (AGVs) or autonomous mobile robots (AMRS) used by retailers for delivering food, grocery items, or any parcel to customers at their doorstep are called delivery robots, also known as last-mile delivery robots. Autonomous last-mile delivery is a term used for the quick and cost-effective transportation of merchandise from fulfillment centers to their destinations using autonomous ground delivery vehicles for applications, including business-to-consumer or business-to-business.
Key Stakeholders
- Original equipment manufacturers (OEMs)
- OEM technology solution providers
- Research institutes
- Market research and consulting firms
- Forums, alliances, and associations
- Technology investors
- Governments and financial institutions
- Analysts and strategic business planners
- End users that want to know more about the technology and the latest technological developments in the industry
Report Objectives
- To describe and forecast the delivery robots market in terms of value, segmented based on load carrying capacity, offering, end-use industry, number of wheels, speed limit, and region
-
To describe and forecast the delivery robots market in terms of volume based on
load carrying capacity, end-use industry, number of wheels, and speed limit - To describe important safety components of delivery robots
- To describe and forecast the market size, in terms of value, for various segments about the 4 main regions: North America, Europe, Asia Pacific, and RoW
- To provide detailed information regarding drivers, restraints, opportunities, and challenges influencing the growth of the market
- To provide a detailed overview of the value chain of the delivery robots ecosystem, along with the supply chain, key industry trends, technology, patent, trade, Porter’s Five Forces, and average price analyses and tariffs & regulations
- To strategically analyze micromarkets for individual growth trends, prospects, and contributions to the total market
- To analyze opportunities in the market for various stakeholders by identifying high-growth segments of the delivery robots market
- To strategically profile key players and comprehensively analyze their market position in terms of ranking and core competencies, along with detailing the competitive landscape for market leaders
- To provide a detailed impact of the recession on the delivery robots market, its segments, and market players
- To analyze the competitive developments, such as joint ventures, collaborations, agreements, contracts, partnerships, mergers & acquisitions, new product developments, and research & development (R&D), in the delivery robots market
Key Questions Addressed by the Report
What is the current size of the Delivery Robots Market?
The global delivery robots market is valued at approximately USD 0.80 billion in 2025.
What is the projected market size by 2030?
The market is expected to reach USD 3.24 billion by 2030, indicating strong growth potential.
What is the CAGR of the Delivery Robots Market?
The market is projected to grow at a CAGR of 32.4% from 2025 to 2030.
What are the key growth drivers of the market?
Major drivers include rise in e-commerce, demand for last-mile delivery, labor cost reduction, and AI advancements.
Which industry segment dominates the market?
The retail sector is expected to dominate due to high demand for fast and efficient deliveries.
Which type of delivery robots leads the market?
Outdoor delivery robots dominate with around 93% market share in 2024 due to wider application scope.
Which region holds the largest market share?
North America leads the market with approximately 47.6% share in 2024.
Which region is growing the fastest?
The Asia Pacific region is expected to grow at the fastest rate during the forecast period.
Who are the key companies in the market?
Major players include Starship Technologies, JD.com, Panasonic Holdings, Relay Robotics, and Nuro.
What are the key trends shaping the market?
Key trends include autonomous delivery adoption, contactless delivery demand, AI integration, and smart city infrastructure development.
Need a Tailored Report?
Customize this report to your needs
Get 10% FREE Customization
Customize This ReportPersonalize This Research
- Triangulate with your Own Data
- Get Data as per your Format and Definition
- Gain a Deeper Dive on a Specific Application, Geography, Customer or Competitor
- Any level of Personalization
Let Us Help You
- What are the Known and Unknown Adjacencies Impacting the Delivery Robots Market
- What will your New Revenue Sources be?
- Who will be your Top Customer; what will make them switch?
- Defend your Market Share or Win Competitors
- Get a Scorecard for Target Partners

Custom Market Research Services
We Will Customise The Research For You, In Case The Report Listed Above Does Not Meet With Your Requirements
Get 10% Free CustomisationTESTIMONIALS

Tetsuya Ohhira
Business Development Manager-Technology Business
Nikon Corporation,
Leading Japanese MNC specializing in optics and imaging productswww.nikon.com
MarketsandMarkets™ response
is quick. Their attitude is flexible and positive. Analyst Insights are globally considered and
significant. Client Services quickly respond to our inquiry and demand. Their wide range of global
surveys help us make our strategic plan.
We hope Knowledge Store will be easier to search
for a report.
VP - Marketing & Business Development
Leading Provider of Process Control Solutions
We engaged with MarketsandMarkets on a study to perform an analysis and recommend a Go-To-Market strategy for metrology and process control in the semiconductor market. The study was tailored to our targets and needs with well-defined milestones. Our overall experience with the MarketsandMarkets team was very good throughout the project in all aspects including the analysis methodologies used, the quality and depth of primary and secondary data sets, the professionalism and flexibility of the team and the ability to meet the target schedule and milestones. We want to thank MarketsandMarkets team for a job well done.
Growth opportunities and latent adjacency in Delivery Robots Market


Virginie
Apr, 2019
I work for a retail cluster and we are involved in a European project about last mile delivery and we are very interested in your report. Can you share a brochure of the report so that we can review it and think about allocating the budget for it..
Dan
Apr, 2019
We would like to analyze the business opportunities of entering the exterior lighting business for delivery robots..
Jordan
Jun, 2019
We would specifically like to look into the projected volume forecasts of the market, as well as the newly developing technologies within the delivery robot field..
Ruan
Dec, 2019
Of course the demand for robots with larger load capacity and the faster speed would be more in the future, but for technological realization the larger load capacity and faster speed means more complicated system and higher costing. In few situations, we need to compromise on load capacity or speed. So, in which cases we need to do trade-off and on which parameter?.
Karina
Sep, 2022
What is a Delivery robot, quadruped robot market in China and RoA?.
Jason
Sep, 2022
Wanted to Analyze the market for food delivery robots. .
Luke
Sep, 2022
I am interested in South Korea Market and Indoor delivery (food/office building etc.) . .
seth
Sep, 2019
Hi, We are a teleoperation company interested in your report. What does the 34 million represent? Robots on the road, revenue or what?.