Die Bonder Equipment Market by Type (Semiautomatic Die Bonder, Fully Automatic Die Bonder), Bonding Technique, Supply Chain Participant (IDM Firms, OSAT Companies), Device, Application (Consumer Electronics), and Region - Global Forecast to 2024


Global Die Bonder Equipment Market Size
The Die Bonder Equipment Market is projected to grow to USD 972 million by 2024, at a CAGR of 3.5% during forecast peroid.
Global Die Bonder Equipment Market Share
Key factors fueling the growth of die bonder equipment market include the growing demand for miniature electronic components and the increasing adoption of stacked die technology in IoT devices.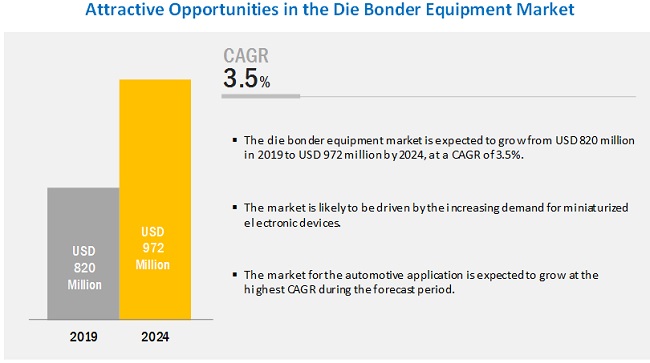
Optoelectronics devices accounted for largest share of die bonder equipment market in 2018
In 2018, optoelectronics accounted for the largest percentage of the die bonder equipment market share. Die bonding is a common method of optoelectronics packaging. The demand for optoelectronics such as LEDs, image sensors, and photodiodes is relatively high in consumer electronics, automotive, healthcare, and telecommunications applications. Hence, die bonding equipment manufacturers focus on offering advanced bonding techniques to meet the increasing demand for original equipment manufacturers (OEMs) pertaining to optoelectronics assembly.
Consumer electronics accounted for largest share of die bonder equipment industry in 2018
Among applications, the consumer electronics segment accounted for the largest share of the die bonder equipment market in 2018. The growth of this segment is attributed to the high demand for miniaturized consumer electronic products, such as smartphones, wearables, and white goods that provide advantages such as compactness and durability. These miniaturized products make use of several devices, such as optoelectronics, MEMS, and MOEMS. Die bonding equipment are required in the assembly process of these components.
Fully automatic die bonders accounted for largest share of die bonder equipment market in 2018
Among types, fully automatic die bonders accounted for the largest share of the die bonder equipment industry in 2018. The growth of this segment of the market can be attributed to their features such as automated assembly and packaging, large-scale assembly and packaging, and higher accuracy. Additionally, fully automatic die bonder equipment can work on different modules, such as wire bonding, wedge bonding, flip chip bonding, and die bonding. The increasing demand for fully automatic die bonders for assembly and packaging of the high volume of consumer products is expected to accelerate the growth of market for fully automatic die bonder equipment in the near future.
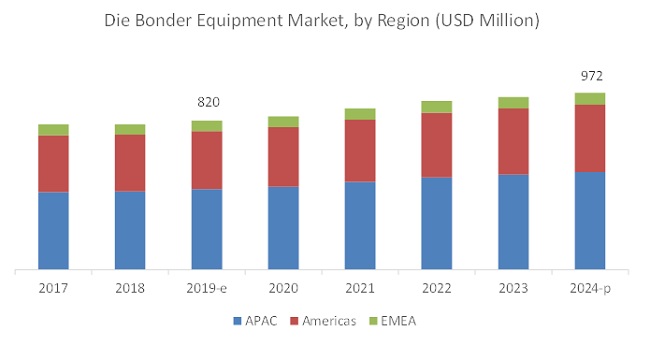
APAC accounted for largest share of die bonder equipment market in 2018
APAC accounted for the largest share of the die bonder equipment industry in 2018, and a similar trend is likely to continue in the near future. The commanding position of APAC is due to the presence of a large number of OSAT companies in the region. More than 60% of OSAT players present across the world have their headquarters in the APAC region. These OSAT companies use die bonding equipment in the semiconductor fabrication process. Additionally, an increasing number of IDMs in the region is expected to boost the market growth in the near future. Similarly, the mass production of electronic products, such as smartphones, wearables, and white goods, in China and Taiwan is also expected to accelerate die bonder equipment market growth in APAC.
Key Market Players
BE Semiconductor Industries N.V. (Netherlands), ASM Pacific Technology Ltd. (Singapore), Kulicke & Soffa (Singapore), Mycronic AB (Sweden), Palomar Technologies, Inc. (US), West�Bond, Inc. (US), MicroAssembly Technologies, Ltd. (Israel), Finetech GmbH & Co. KG (Germany), Dr. Tresky AG (Switzerland), Smart Equipment Technology (France) are a few major companies operating in the market. These companies have adopted both organic and inorganic growth strategies such as product launches, agreements, partnerships, collaborations, and acquisitions to strengthen their position in the market.
Die Bonder Equipment Market Report Scope:
|
Report Metric |
Details |
| Estimated Market Size | USD 820 Million |
| Revenue Forecast in 2024 | USD 972 Million |
| Growth rate | CAGR of 3.5% |
|
Base year considered |
2018 |
|
Forecast period |
2019�2024 |
|
On Demand Data Available |
2030 |
|
Segments covered |
|
|
Regions covered |
|
|
Companies covered |
|
| Key Market Driver | Miniature Electronic Components |
| Largest Growing Region | Asia Pacific (APAC) |
| Largest Market Share Segment | Consumer Electronics |
| Highest CAGR Segment | MEMS and MOEMS |
This report categorizes the market based on type, bonding technique, supply chain participant, device, application, and region.
Die Bonder Equipment Market, by Type
- Manual Die Bonders
- Semiautomatic Die Bonders
- Fully Automatic Die Bonders
Market, by Bonding Technique
- Epoxy
- Eutectic
- Soft Solder
- Others
Market , by Supply Chain Participant:
- OSAT Companies
- IDM Firms
Market, by Device:
- Optoelectronics
- MEMS and MOEMS
- Power Devices
Die Bonder Equipment Market, by Application:
- Consumer Electronics
- Automotive
- Industrial
- Telecommunications
- Healthcare
- Aerospace & Defense
Market, by Region
- Asia Pacific (APAC)
- Taiwan
- China
- Japan
- South Korea
- Rest of APAC
- Americas
- US
- Canada
- Rest of Americas (Mexico, Brazil, and Argentina)
- Europe, the Middle East, and Africa (EMEA)
- Germany
- UK
- Israel
- France
- Rest of EMEA (Sweden, Italy, Russia, Netherlands, Finland, Switzerland, Czech Republic, and African countries)
Key Questions Addressed by the Report
- Where will all these developments take the industry in the mid-to-long term?
- What are the upcoming trends in market?
- What are the opportunities for the existing players and for those who are planning to enter various stages of the die bonder equipment value chain?
- How will inorganic growth strategies implemented by key players impact the growth of market, and who will have the undue advantage?
- What are emerging applications of die bonder equipment?
Frequently Asked Questions (FAQ):
Which are the major applications of die bonder equipment? How huge is the opportunity for their growth in the next five years?
The major applications of die bonder equipment include consumer electronics, automotive, industrial, and telecommunications. These are expected to open new revenue pockets for the die bonder equipment market, which will lead to market opportunity of USD 972 million.
Which are the major companies in the die bonder equipment market? What are their major strategies to strengthen their market presence?
BE Semiconductor Industries N.V. (Netherlands), ASM Pacific Technology Ltd.(Singapore), Kulicke & Soffa (Singapore), Mycronic AB (Sweden), and Palomar Technologies, Inc. (US) are dominant players in the global die bonder equipment market. Product launches is one of the key strategies adopted by these players. Apart from launches, these players extend their focus on partnerships, collaborations, contracts, agreements, acquisitions, and expansions.
Which region is expected to witness significant demand for die bonder equipment market in the coming years?
APAC is the highest growing region for this market. More than 60% of OSAT players present across the world have their headquarters in the APAC region. These OSAT companies use die bonding equipment in the semiconductor fabrication process. Additionally, an increasing number of IDMs in the region is expected to boost the die bonder equipment market growth in the near future.
Which are the major types for die bonder equipment? How huge is the opportunity for their growth in the next five years?
The major types of die bonder equipment are manual, semiautomatic, and fully automatic. The fully automatic segment is projects to grow at the highest CAGR during the forecast period. Fully automatic die bonder equipment can work on different modules, such as wire bonding, wedge bonding, flip chip bonding, and die bonding. The increasing demand for fully automatic die bonders for assembly and packaging of the high volume of consumer products is expected to accelerate the growth of the market for fully automatic die bonder equipment in the near future.
What are the drivers and opportunities for the die bonder equipment market?
Increasing demand for miniature electronic components is a major driving factor for the die bonder equipment market growth. Opportunities for the manufacturers in the die bonder equipment market include increasing demand for 3D semiconductor assembly and packaging.
To speak to our analyst for a discussion on the above findings, click Speak to Analyst
 Exclusive indicates content/data unique to MarketsandMarkets and not available with any competitors.
Table of Contents
1 Introduction (Page No. - 19)
1.1 Study Objectives
1.2 Market Definition and Scope
1.2.1 Inclusions and Exclusions
1.3 Scope
1.3.1 Markets Covered
1.3.2 Years Considered
1.4 Currency
1.5 Limitations
1.6 Market Stakeholders
2 Research Methodology (Page No. - 23)
2.1 Research Data
2.1.1 Secondary Data
2.1.1.1 Secondary Sources
2.1.2 Primary Data
2.1.2.1 Breakdown of Primary Interviews
2.1.2.2 Key Data From Primary Sources
2.2 Market Size Estimation
2.2.1 Bottom-Up Approach
2.2.1.1 Approach for Capturing Market Size By Bottom-Up Analysis (Demand Side)
2.2.2 Top-Down Approach
2.2.2.1 Approach for Capturing Market Share By Top-Down Analysis (Supply Side)
2.3 Market Breakdown and Data Triangulation
2.4 Research Assumptions
3 Executive Summary (Page No. - 33)
4 Premium Insights (Page No. - 38)
4.1 Attractive Growth Opportunities in Market
4.2 Market, By Country
4.3 Market, By Bonding Technique
4.4 Market, By Application and Region
5 Market Overview (Page No. - 41)
5.1 Introduction
5.2 Market Dynamics
5.2.1 Drivers
5.2.1.1 Growing Demand for Miniature Electronic Components
5.2.1.2 Increasing Adoption of Stacked Die Technology in IoT Devices
5.2.2 Restraints
5.2.2.1 High Cost of Ownership
5.2.3 Opportunities
5.2.3.1 Increasing Demand for 3D Semiconductor Assembly and Packaging
5.2.4 Challenges
5.2.4.1 Mechanical Unbalance of Moving Parts
5.3 Value Chain Analysis
5.3.1 Die Bonder Equipment Value Chain
6 Die Bonder Equipment Market, By Type (Page No. - 48)
6.1 Introduction
6.2 Manual Die Bonders
6.2.1 Manual Die Bonders Play Significant Role in R&D, Testing, and Prototyping Applications
6.3 Semiautomatic Die Bonders
6.3.1 Semiautomatic Die Bonders are Easy to Use and Flexible
6.4 Fully Automatic Die Bonders
6.4.1 Fully Automatic Die Bonders to Continue to Register Highest CAGR and Largest Market Size During 2019�2024
7 Market, By Bonding Technique (Page No. - 61)
7.1 Introduction
7.2 Epoxy
7.2.1 Epoxy Bonding to Account for Largest Share of Market Due to Low Cost and Low Curing Temperature
7.3 Eutectic
7.3.1 Market for Eutectic Bonding Technique to Grow at Highest CAGR During Forecast Period
7.4 Soft Solder
7.4.1 Soft Solder Boidng Plays Significant Role in Fabrication of Power Devices
7.5 Others
7.5.1 Assembly of Temperature-Restricted Products Fuel Growth of Market for Other Bonding Techniques
8 Market, By Supply Chain Participant (Page No. - 68)
8.1 Introduction
8.2 Osat Companies
8.2.1 Osat Companies to Play Significant Role Owing to Challenges Faced By Foundries Related to Assembly and Packaging
8.3 IDM Firms
8.3.1 IDM Firms to Continue to Lead Market Owing to Their Ability to Progress Rapidly With Innovative Technologies During Forecast Period
9 Market, By Device (Page No. - 77)
9.1 Introduction
9.2 Optoelectronics
9.2.1 Optoelectronics to Continue to Account for Largest Share of Market During Forecast Period
9.3 MEMS and MOEMs
9.3.1 Automotive, Consumer Electronics, Healthcare, and Telecommunications Sectors Contribute Most to Highest CAGR of MEMS and MOEMs Devices in Coming Years
9.4 Power Devices
9.4.1 Die Attach Packaging Methodology Enables Power Devices to Withstand Extreme Operating Conditions
10 Die Bonder Equipment Market, By Application (Page No. - 91)
10.1 Introduction
10.2 Consumer Electronics
10.2.1 Increasing Adoption of Miniaturized and Lightweight Electronic Products Accelerates Demand for Die Bonders
10.3 Automotive
10.3.1 Rising Use of MEMS to Ensure Improved Passenger Safety Would Spur Demand for Die Bonders in Automotive Applications
10.4 Industrial
10.4.1 Growing Implementation of Industrial IoT to Drive Growth of Market for Industrial Applications
10.5 Telecommunications
10.5.1 Rising Deployment of 5G Network Infrastructure Contributing to Growth of Market for Telecommunications Applications
10.6 Healthcare
10.6.1 Surging Demand for Nano-Sized and Lightweight Healthcare Gadgets Augments Adoption of Die Bonders in Healthcare Applications
10.7 Aerospace & Defense
10.7.1 Increasing Demand for Robust Components Boosting Die Bonder Market Growth for Aerospace & Defense Applications
11 Geographic Analysis (Page No. - 103)
11.1 Introduction
11.2 APAC
11.2.1 Taiwan
11.2.1.1 Presence of Many Key Osat Companies Drives Market Growth in Taiwan
11.2.2 China
11.2.2.1 Growing Trend of Miniaturization in Consumer Electronic Products Spurs Growth of Market in China
11.2.3 Japan
11.2.3.1 Increasing Demand for Passenger Cars and Commercial Vehicles and Expanding Presence of Market Players in Country Fuels Growth of Market in Japan
11.2.4 South Korea
11.2.4.1 South Korea to Continue to Account for Largest Size of Market in APAC During 2019�2024
11.2.5 Rest of APAC
11.2.5.1 Strong Presence of Die Bonder Equipment Manufactures Accelerates Market Growth in Rest of APAC
11.3 Americas
11.3.1 US
11.3.1.1 US to Continue to Lead Market in Americas During 2019�2024
11.3.2 Canada
11.3.2.1 Government Initiatives Toward Developing Electric Vehicle Infrastructure to Create Growth Opportunities for Market in Near Future
11.3.3 Rest of Americas
11.3.3.1 Increasing Demand for IoT and 5G Surging Demand for Die Bonding Equipment in Rest of Americas
11.4 EMEA
11.4.1 Germany
11.4.1.1 Adoption of Smart Homes and Connected Cars to Spur Demand in Germany
11.4.2 UK
11.4.2.1 Deployment of 5G Infrastructure Fueling Market Growth in UK
11.4.3 Israel
11.4.3.1 Presence of Fabrication Plants of IDM Companies Including Intel and Tower Jazz to Boost Market Growth in Israel
11.4.4 France
11.4.4.1 Developed Communication Network has Prompted Market Growth in France
11.4.5 Rest of EMEA
11.4.5.1 Initiatives of Die Bonder Equipment Manufacturers to Propel Market Growth in Rest of EMEA
12 Competitive Landscape (Page No. - 123)
12.1 Introduction
12.2 Market Ranking Analysis, 2018
12.3 Competitive Scenario
12.3.1 Product Launches
12.3.2 Partnerships, Collaborations, Contracts and Agreements
12.3.3 Acquisitions
12.3.4 Expansions
12.4 Competitive Leadership Mapping
12.4.1 Visionary Leaders
12.4.2 Dynamic Differentiators
12.4.3 Innovators
12.4.4 Emerging Companies
12.5 Strength of Product Portfolio
12.6 Business Strategy Excellence
13 Company Profiles (Page No. - 132)
13.1 Key Players
(Business Overview, Products Offered, Recent Developments, SWOT Analysis, MnM View)*
13.1.1 Be Semiconductor Industries N.V.
13.1.2 ASM Pacific Technology Ltd.
13.1.3 Kulicke & Soffa
13.1.4 Mycronic AB
13.1.5 Palomar Technologies, Inc.
13.1.6 West�Bond, Inc.
13.1.7 Microassembly Technologies, Ltd.
13.1.8 Finetech GmbH & Co. Kg
13.1.9 Dr. Tresky Ag
13.1.10 Smart Equipment Technology
13.2 Right to Win
13.3 Other Key Players
13.3.1 Hybond, Inc.
13.3.2 Shibuya Corporation
13.3.3 Anza Technology, Inc.
13.3.4 Paroteq GmbH
13.3.5 Tresky GmbH
13.3.6 Dias Automation (Hk) Ltd
13.3.7 Shinkawa Ltd.
13.3.8 Four Technos Co., Ltd.
13.3.9 Fasford Technology Co., Ltd.
13.3.10 Unitemp GmbH
13.3.11 Tpt Wire Bonder GmbH & Co. Kg
*Details on Business Overview, Products Offered, Recent Developments, SWOT Analysis, MnM View Might Not Be Captured in Case of Unlisted Companies.
14 Appendix (Page No. - 161)
14.1 Discussion Guide
14.2 Knowledge Store: Marketsandmarkets� Subscription Portal
14.3 Available Customizations
14.4 Related Reports
14.5 Author Details
List of Tables (110 Tables)
Table 1 Die Bonder Equipment Market, By Type, 2016�2024 (USD Million)
Table 2 Market, By Bonding Technique, 2016�2024 (USD Million)
Table 3 Market, By Device, 2016�2024 (USD Million)
Table 4 Market for Optoelectronics, By Application, 2016�2024 (USD Million)
Table 5 Market for MEMS and MOEMs, By Application, 2016�2024 (USD Million)
Table 6 Market for Power Devices, By Application, 2016�2024 (USD Million)
Table 7 Market, By Application, 2016�2024 (USD Million)
Table 8 Manual Die Bonder Equipment, By Supply Chain Participant, 2016�2024 (USD Million)
Table 9 Market, By Bonding Technique, 2016�2024 (USD Million)
Table 10 Market, By Device, 2016�2024 (USD Million)
Table 11 Market for Optoelectronics, By Application, 2016�2024 (USD Million)
Table 12 Market for MEMS and MOEMs, By Application, 2016�2024 (USD Million)
Table 13 Market for Power Devices, By Application, 2016�2024 (USD Million)
Table 14 Market, By Application, 2016�2024 (USD Million)
Table 15 Semiautomatic Die Bonder Equipment, By Supply Chain Participant, 2016�2024 (USD Million)
Table 16 Market, By Bonding Technique, 2016�2024 (USD Million)
Table 17 Market, By Device, 2016�2024 (USD Million)
Table 18 Market for Optoelectronics, By Application, 2016�2024 (USD Million)
Table 19 Market for MEMS and MOEMs, By Application, 2016�2024 (USD Million)
Table 20 Market for Power Devices, By Application, 2016�2024 (USD Million)
Table 21 Market, By Application, 2016�2024 (USD Million)
Table 22 Fully Automatic Die Bonder Equipment, By Supply Chain Participant, 2016�2024 (USD Million)
Table 23 Market, By Bonding Technique, 2016�2024 (USD Million)
Table 24 Market for Epoxy Bonding Technique, By Type, 2016�2024 (USD Million)
Table 25 Market for Eutectic Bonding Technique, By Type, 2016�2024 (USD Million)
Table 26 Market for Soft Solder Bonding Technique, By Type, 2016�2024 (USD Million)
Table 27 Market for Other Bonding Techniques, By Type, 2016�2024 (USD Million)
Table 28 Market, By Supply Chain Participant, 2016�2024 (USD Million)
Table 29 Market for Osat Companies, By Type, 2016�2024 (USD Million)
Table 30 Market for Osat Companies, By Device, 2016�2024 (USD Million)
Table 31 Market for Optoelectronics in Osat Companies, By Region, 2016�2024 (USD Million)
Table 32 Market for MEMS and MOEMs in Osat Companies, By Region, 2016�2024 (USD Million)
Table 33 Market for Power Devices in Osat Companies, By Region, 2016�2024 (USD Thousand)
Table 34 Market for Osat Companies, By Region, 2016�2024 (USD Million)
Table 35 Market for Osat Companies, By Application, 2016�2024 (USD Million)
Table 36 Market for IDM Firms, By Type, 2016�2024 (USD Million)
Table 37 Market for IDM Firms, By Device, 2016�2024 (USD Million)
Table 38 Market for Optoelectronics in IDM Firms, By Region, 2016�2024 (USD Thousand)
Table 39 Market for MEMS and MOEMs in IDM Firms, By Region, 2016�2024 (USD Million)
Table 40 Market for Power Devices in IDM Firms, By Region, 2016�2024 (USD Million)
Table 41 Market for IDM Firms, By Region, 2016�2024 (USD Million)
Table 42 Market for IDM Firms, By Application, 2016�2024 (USD Thousand)
Table 43 Market, By Device, 2016�2024 (USD Million)
Table 44 Market for Optoelectronics, By Type, 2016�2024 (USD Million)
Table 45 Market for Optoelectronics, By Supply Chain Participant, 2016�2024 (USD Million)
Table 46 Market for Optoelectronics, By Application, 2016�2024 (USD Million)
Table 47 Market for Optoelectronics, By Region, 2016�2024 (USD Million)
Table 48 Market in APAC for Optoelectronics, By Country, 2016�2024 (USD Million)
Table 49 Market in Americas for Optoelectronics, By Country, 2016�2024 (USD Million)
Table 50 Market in EMEA for Optoelectronics, By Country, 2016�2024 (USD Thousand)
Table 51 Market for MEMS and MOEMs, By Type, 2016�2024 (USD Million)
Table 52 Market for MEMS and MOEMs, By Supply Chain Participant, 2016�2024 (USD Million)
Table 53 Market for MEMS and MOEMs, By Application, 2016�2024 (USD Million)
Table 54 Market for MEMS and MOEMs, By Region, 2016�2024 (USD Million)
Table 55 Market in APAC for MEMS and MOEMs, By Country, 2016�2024 (USD Million)
Table 56 Market in Americas for MEMS and MOEMs, By Country, 2016�2024 (USD Million)
Table 57 Die Bonder Equipment Market for MEMS and MOEMs in EMEA, By Country, 2016�2024 (USD Thousand)
Table 58 Market for Power Devices, By Type, 2016�2024 (USD Million)
Table 59 Market for Power Devices, By Supply Chain Participant, 2016�2024 (USD Million)
Table 60 Market for Power Devices, By Application, 2016�2024 (USD Million)
Table 61 Market for Power Devices, By Region, 2016�2024 (USD Million)
Table 62 Market in APAC for Power Devices, By Country, 2016�2024 (USD Million)
Table 63 Market in Americas for Power Devices, By Country, 2016�2024 (USD Million)
Table 64 Market in EMEA for Power Devices, By Country, 2016�2024 (USD Thousand)
Table 65 Market, By Application, 2016�2024 (USD Million)
Table 66 Market for Consumer Electronics Applications, By Type, 2016�2024 (USD Million)
Table 67 Market for Consumer Electronics Applications, By Supply Chain Participant, 2016�2024 (USD Million)
Table 68 Market for Consumer Electronics Applications, By Device, 2016�2024 (USD Million)
Table 69 Market for Automotive Applications, By Type, 2016�2024 (USD Million)
Table 70 Market for Automotive Applications, By Supply Chain Participant, 2016�2024 (USD Million)
Table 71 Market for Automotive Applications, By Device, 2016�2024 (USD Million)
Table 72 Market for Industrial Applications, By Type, 2016�2024 (USD Million)
Table 73 Market for Industrial Applications, By Supply Chain Participant, 2016�2024 (USD Million)
Table 74 Market for Industrial Applications, By Device, 2016�2024 (USD Million)
Table 75 Market for Telecommunications Applications, By Type, 2016�2024 (USD Million)
Table 76 Market for Telecommunications Applications, By Supply Chain Participant, 2016�2024 (USD Million)
Table 77 Market for Telecommunications Applications, By Device, 2016�2024 (USD Million)
Table 78 Market for Healthcare Applications, By Type, 2016�2024 (USD Million)
Table 79 Market for Healthcare Applications, By Supply Chain Participant, 2016�2024 (USD Million)
Table 80 Market for Healthcare Applications, By Device, 2016�2024 (USD Million)
Table 81 Market for Aerospace & Defense Applications, By Type, 2016�2024 (USD Million)
Table 82 Market for Aerospace & Defense Applications, By Supply Chain Participant, 2016�2024 (USD Thousand)
Table 83 Market for Aerospace & Defense Applications, By Device, 2016�2024 (USD Million)
Table 84 Market, By Region, 2016�2024 (USD Million)
Table 85 Market in APAC, By Supply Chain Participant, 2016�2024 (USD Million)
Table 86 Market in APAC, By Device, 2016�2024 (USD Million)
Table 87 Market in APAC, By Country, 2016�2024 (USD Million)
Table 88 Market in Taiwan, By Device, 2016�2024 (USD Million)
Table 89 Market in China, By Device, 2016�2024 (USD Million)
Table 90 Market in Japan, By Device, 2016�2024 (USD Million)
Table 91 Market in South Korea, By Device, 2016�2024 (USD Million)
Table 92 Die Bonder Equipment Market in Rest of APAC, By Device, 2016�2024 (USD Million)
Table 93 Market in Americas, By Supply Chain Participant, 2016�2024 (USD Million)
Table 94 Market in Americas, By Device, 2016�2024 (USD Million)
Table 95 Market in Americas, By Country, 2016�2024 (USD Million)
Table 96 Market in Us, By Device, 2016�2024 (USD Million)
Table 97 Market in Canada, By Device, 2016�2024 (USD Thousand)
Table 98 Market in Rest of Americas, By Device, 2016�2024 (USD Million)
Table 99 Market in EMEA, By Supply Chain Participant, 2016�2024 (USD Million)
Table 100 Market in EMEA, By Device, 2016�2024 (USD Million)
Table 101 Market in EMEA, By Country, 2016�2024 (USD Million)
Table 102 Market in Germany, By Device, 2016�2024 (USD Million)
Table 103 Market in Uk, By Device, 2016�2024 (USD Thousand)
Table 104 Market in Israel, By Device, 2016�2024 (USD Thousand)
Table 105 Market in France, By Device, 2016�2024 (USD Thousand)
Table 106 Market in Rest of EMEA, By Device, 2016�2024 (USD Thousand)
Table 107 Product Launches, 2017�2019
Table 108 Partnerships, Collaborations, Contracts and Agreements, 2017�2019
Table 109 Acquisitions, 2018
Table 110 Expansions, 2017�2019
List of Figures (61 Figures)
Figure 1 Die Bonder Equipment Market: Research Design
Figure 2 Market Size Estimation Methodology: Approach 1 (Supply Side): Revenue Generated From Products in Market
Figure 3 Market Size Estimation Methodology: Approach 2 Bottom-Up (Supply Side): Illustrative Example of Company in Market
Figure 4 Market Size Estimation Methodology: Approach 2 � Bottom-Up (Demand Side): Supply Chain Participants Covered Under Market
Figure 5 Market Size Estimation Methodology: Approach 3 � Bottom-Up Market Estimation for Die Bonder Equipment, By Type
Figure 6 Market Size Estimation Methodology: Bottom-Up Approach
Figure 7 Market Size Estimation Methodology: Top-Down Approach
Figure 8 Data Triangulation
Figure 9 Research Study Assumptions
Figure 10 Market for Fully Automatic Die Bonder Equipment to Grow at Highest CAGR During 2019�2024
Figure 11 Market for IDM Firms to Grow at Higher CAGR During 2019�2024
Figure 12 Automotive Application to Witness Highest CAGR in Market During 2019�2024
Figure 13 APAC to Be Fastest-Growing Region in Market During Forecast Period
Figure 14 Increasing Demand for Miniaturized Electronic Devices to Spur Market Growth During Forecast Period
Figure 15 China to Record Highest CAGR in Overall Market During Forecast Period
Figure 16 Epoxy Bonding Technique to Continue to Account for Largest Share of Market Till 2024
Figure 17 Consumer Electronics and APAC Likely to Be Largest Shareholders in Overall Market, By Application and Region, Respectively, in 2024
Figure 18 Growing Demand of Miniaturization of Electronic Devices to Drive Die Bonder Equipment Market
Figure 19 Market Drivers and Their Impact
Figure 20 Market Restraints and Their Impact
Figure 21 Market Opportunities and Their Impact
Figure 22 Market Challenges and Their Impact
Figure 23 Die Bonder Equipment Ecosystem: Major Value is Added By Product Manufacturers
Figure 24 Market, By Type
Figure 25 Market for Fully Automatic Die Bonders to Grow at Highest CAGR During Forecast Period
Figure 26 Market for Automotive Application to Grow at Highest CAGR During Forecast Period
Figure 27 IDM Firms to Exhibit Higher CAGR in Semiautomatic Die Bonding Equipment Market During Forecast Period
Figure 28 Market for Automotive Application to Grow at Highest CAGR During Forecast Period
Figure 29 Market, By Bonding Technique
Figure 30 Market for Eutectic Bonding Technique to Grow at Highest CAGR During Forecast Period
Figure 31 Fully Automatic Soft Solder Die Bonders to Dominate Market During Forecast Period
Figure 32 Market, By Supply Chain Participant
Figure 33 IDM Firms to Command Market During 2019�2024
Figure 34 APAC to Register Highest CAGR in Market for OSAT Companies During Forecast Period
Figure 35 Automotive Application to Record Highest CAGR in Die Bonder Market for IDM Firms During Forecast Period
Figure 36 Die Bonder Equipment Market, By Device
Figure 37 Market for MEMS and MOEMs Devices to Grow at Highest CAGR During Forecast Period
Figure 38 APAC to Register Highest CAGR in Market for Optoelectronics During Forecast Period
Figure 39 Fully Automatic Market for MEMS and MOEMs Devices to Grow at Highest CAGR During Forecast Period
Figure 40 Germany to Dominate Market for MEMS and MOEMs During Forecast Period
Figure 41 Automotive Application to Witness Highest CAGR in Market for Power Devices During Forecast Period
Figure 42 Die Bonder Equipment Market, By Application
Figure 43 Automotive Application to Grow at Highest CAGR During Forecast Period
Figure 44 Fully Automatic Die Bonders to Dominate Market for Automotive Applications During Forecast Period
Figure 45 MEMS and MOEMs Devices to Exhibit Highest CAGR in Market for Industrial Applications During Forecast Period
Figure 46 IDM Firms to Lead Market for Healthcare Applications During Forecast Period
Figure 47 Die Bonder Equipment in APAC to Grow at Highest CAGR During Forecast Period
Figure 48 APAC: Die Bonder Equipment - Snapshot
Figure 49 MEMS and MOEMs Devices to Record Highest CAGR in Market in Japan During Forecast Period
Figure 50 Americas: Die Bonder Equipment - Snapshot
Figure 51 Market in Canada for MEMS and MOEMs Devices to Grow at Highest CAGR During Forecast Period
Figure 52 EMEA: Die Bonder Equipment - Snapshot
Figure 53 Germany to Register Highest CAGR in Market in EMEA During Forecast Period
Figure 54 Memes and MOEMs Devices to Exhibit Highest CAGR in French Market During Forecast Period
Figure 55 Companies Adopted Product Launches as Key Growth Strategies From 2017 to 2019
Figure 56 Ranking of Top 5 Players in Market
Figure 57 Market (Global) Competitive Leadership Mapping, 2018
Figure 58 Be Semiconductor Industries N.V.: Company Snapshot
Figure 59 ASM Pacific Technology Ltd: Company Snapshot
Figure 60 Kulicke & Soffa: Company Snapshot
Figure 61 Mycronic AB: Company Snapshot
The study involved 4 major activities for estimating the size of the die bonder equipment market. Exhaustive secondary research has been carried out to collect information relevant to the market, the peer market, and the parent market. Primary research has been undertaken to validate these findings, assumptions, and sizing with the industry experts across the value chain of the die bonder equipment. Both top-down and bottom-up approaches have been employed to estimate the complete market size. After that the market breakdown and data triangulation methods have been used to estimate the size of different segments and subsegments of the market.
Secondary Research
The research methodology used to estimate and forecast the size of the market began with capturing data related to revenues of key vendors in the market through secondary research. This study involved the extensive use of secondary sources, directories, and databases (such as Hoovers, Bloomberg Businessweek, Factiva, and OneSource) to identify and collect information useful for a technical, market-oriented, and commercial study of market. Vendor offerings have been taken into consideration to determine the market segmentation. The entire research methodology included the study of annual reports, press releases, and investor presentations of companies; white papers; and certified publications and articles by recognized authors, directories, and databases.
Primary Research
The die bonder equipment market comprises several stakeholders, such as suppliers of standard components and original equipment manufacturers (OEMs). The demand side of this market is characterized by the IDM firms and OSAT companies, as well as by the development and manufacturing of die bonder equipment-based devices. The supply side is characterized by advancements carried out in die bonder equipment systems using different techniques and their diverse applications. Various primary sources from both the supply and demand sides of the market have been interviewed to obtain qualitative and quantitative information. Following is the breakdown of primary respondents.
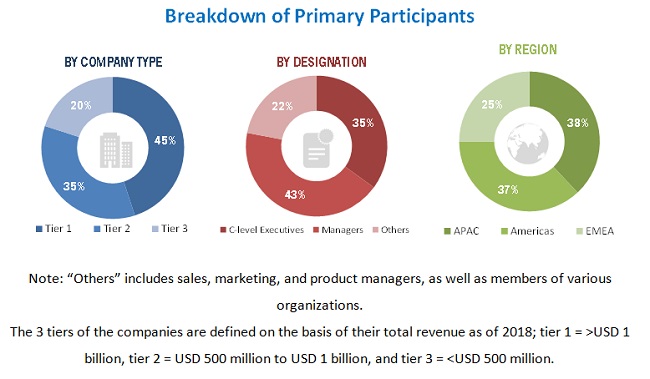
To know about the assumptions considered for the study, download the pdf brochure
Market Size Estimation
Both top-down and bottom-up approaches have been used to estimate and validate the size of the die bonder equipment market and its segments. The research methodology used to estimate the market size included the following:
- Key players in the market have been identified through extensive secondary research.
- The supply chain of the manufacturing industry and the size of market, in terms of value, have been determined through primary and secondary research processes.
- All percentage shares, splits, and breakdowns have been determined using secondary sources and verified through primary sources.
Data Triangulation
After arriving at the overall market size�using the market size estimation process explained above�the market has been split into several segments and subsegments. Data triangulation and market breakdown procedures have been employed, wherever applicable, to complete the overall market engineering process and arrive at the exact statistics of each market segment and subsegment. The data has been triangulated by studying various factors and trends from both the demand and supply sides of the die bonder equipment market.
Research Objectives
- To describe, segment, and forecast the overall size of market, by bonding type, bonding technique, supply chain participant, device, application, and region, in terms of value
- To describe and forecast the market size for various segments with regard to 3 main regions�Asia Pacific (APAC), the Americas, and Europe and the Middle East & Africa (EMEA), in terms of value
- To provide detailed information regarding major factors such as drivers, restraints, opportunities, and challenges influencing the growth of the market
- To describe the die bonder equipment value chain in brief
- To analyze competitive developments such as product launches and developments, agreements, partnerships, acquisitions, expansions, and research and development (R&D) activities in market
- To analyze competitive developments such as product launches, expansions, agreements, partnerships, collaborations, and acquisitions undertaken in market
Available Customizations
Along with the market data, MarketsandMarkets offers customizations according to the specific requirements of companies. The following customization options are available for the report:
Company Information
- Detailed analysis and profiling of additional market players (up to 5)
Critical Questions
- What new application areas are being explored by the providers of die bonder equipment?
- Who are the key players in market, and how intense is the competition in this market?


Growth opportunities and latent adjacency in Die Bonder Equipment Market