
Digital Education Market Size, Size, Growth & Latest Trends

Digital Education Market by Learning Model (Self-paced, Blended, Microlearning, Adaptive, Mobile), Course Type (Academic, Test Preparation, Professional Certification & Skill Development, Vocational Training, Corporate Training) - Global Forecast to 2030


OVERVIEW
Source: Secondary Research, Interviews with Experts, MarketsandMarkets Analysis
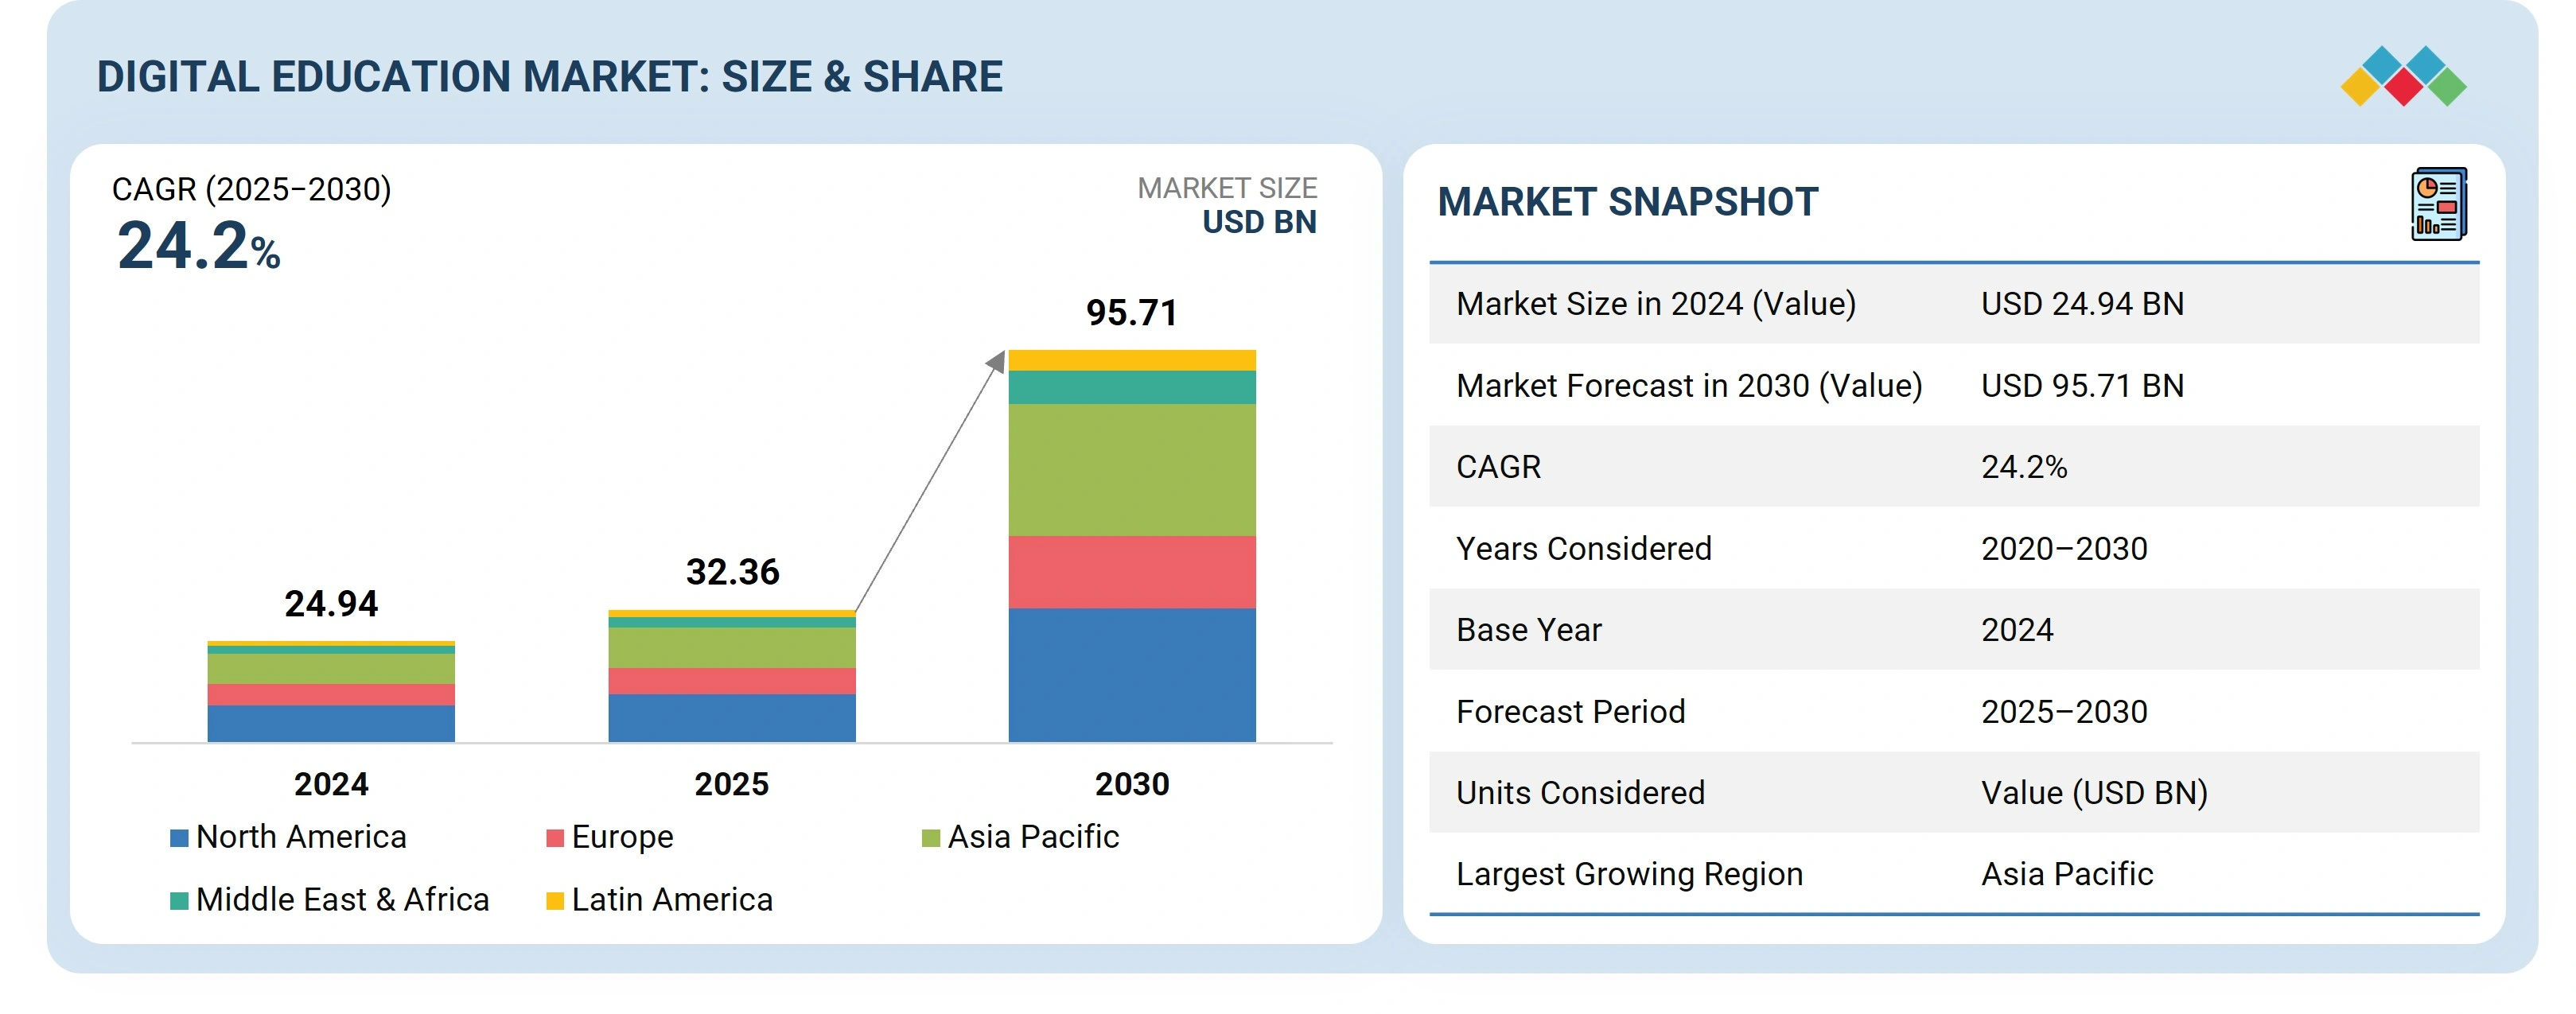
The digital education market is expected to grow from USD 32.36 billion in 2025 to USD 95.70 billion by 2030, registering a CAGR of 24.2%. It encompasses online learning, virtual classrooms, and e-learning platforms that extend education beyond traditional settings. Major players like Udemy, Coursera, edX, and Pluralsight are advancing their platforms to meet evolving academic and corporate learning needs. According to the Digital Education Council’s 2024 Global AI Student Survey, 86% of students use AI in their studies, marking a strong shift toward AI-driven learning. AI adoption enhances learning through instant feedback, personalized pacing, and improved comprehension, while reducing learning time. This growing integration is driving institutions to invest in AI-enabled education platforms offering personalized content, predictive analytics, and adaptive assessments to optimize learning outcomes.
Market Size and Forecast:
- Market Size Value in 2024: USD 24.94 billion
- Market Size Value in 2025: USD 32.36 billion
- Revenue Forecast in 2030: USD 95.70 billion
- Growth Rate: CAGR of 24.2% from 2025 to 2030
- Data available from 2020 to 2030
- Base year: 2024
- Forecast period: 2025-2030
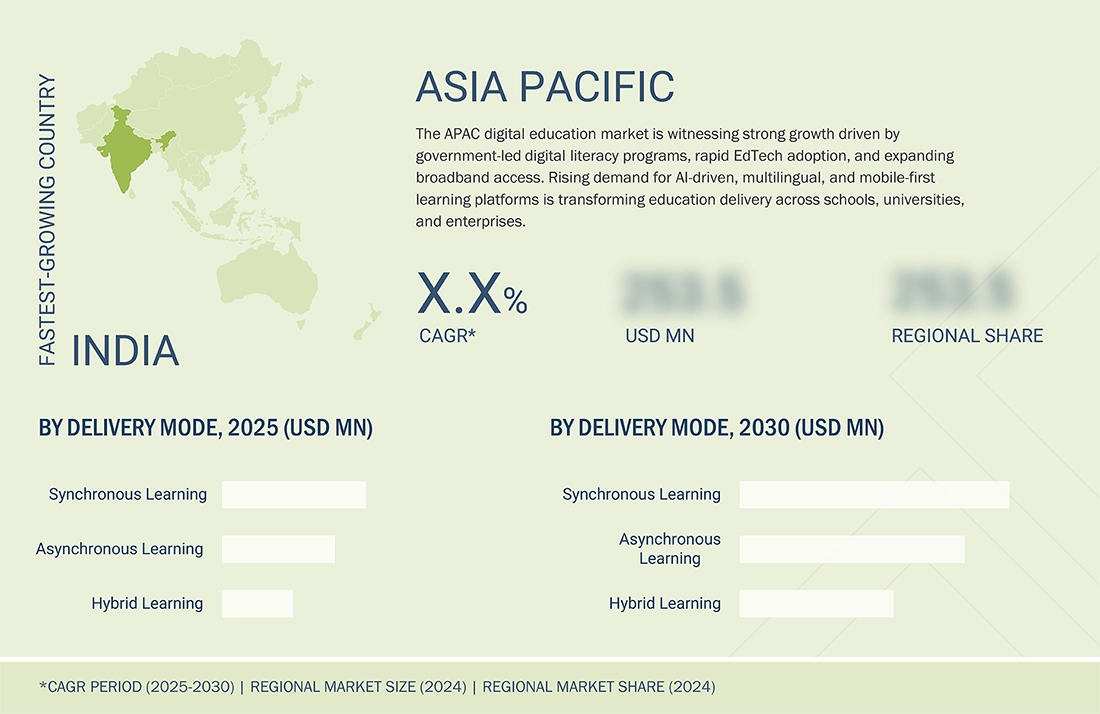
- Fastest Growing Region: Asia Pacific
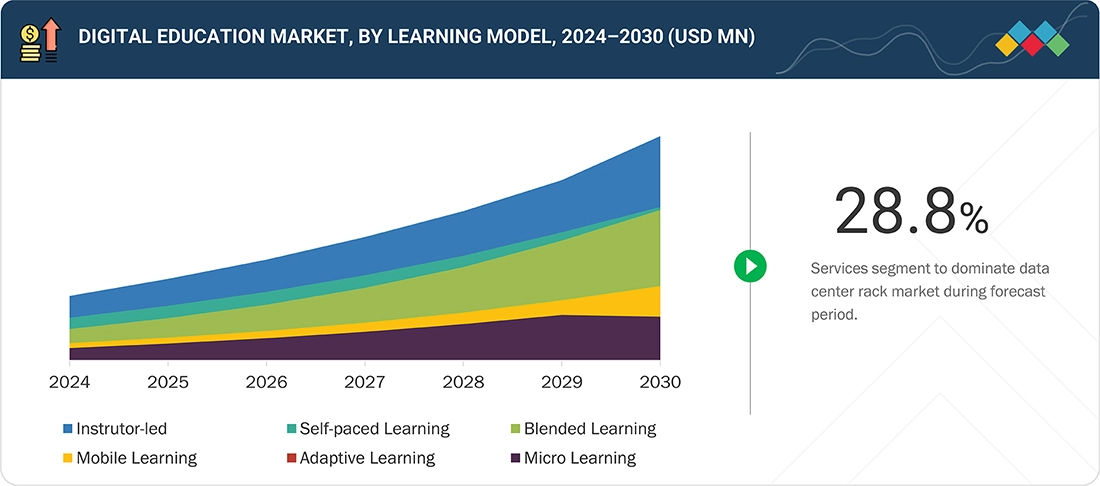
- Services segment to dominate data center rack market at a CAGR of 28.8% from 2025 to 2030.
Key Market Trends and Insights
- Growth Driver: Rising AI-powered personalized learning drives digital education market adoption.
-
Growth Drivers: Growing online learning, digital literacy, and cloud platforms accelerate market growth.
- Opportunities: Expanding corporate upskilling and adaptive learning create digital education opportunities.
- AI Impact: AI enables adaptive learning, automated assessments, and personalized student engagement.
KEY TAKEAWAYS
-
BY LEARNING MODELThe instructor-led learning model holds the largest market share in the digital education market due to its structured approach, real-time interaction, and guided learning experience. Learners benefit from direct engagement with instructors, which enhances understanding and retention. This model is increasingly supported by virtual classrooms and blended learning platforms, combining traditional teaching strengths with digital flexibility. Institutions and corporations prefer this approach for effective skill development and personalized mentorship, driving its continued dominance in the market.
-
BY COURSE TYPEThe academic education segment is expected to hold the largest market share in the digital education market, driven by the rapid digital transformation of schools and universities. Growing adoption of online degree programs, virtual classrooms, and AI-powered learning tools is enhancing accessibility and engagement. Governments and institutions are investing heavily in digital infrastructure and curriculum modernization, making education more inclusive and flexible. This shift toward technology-enabled academic learning is fueling sustained market growth.
-
BY DELIVERY MODEThe synchronous learning segment is expected to hold the largest market share due to its real-time interaction and collaborative learning environment. This model enables live communication between instructors and learners, promoting engagement and immediate feedback. The rise of virtual classrooms, video conferencing tools, and interactive platforms has accelerated its adoption across academic and corporate sectors. Growing demand for immersive, instructor-led digital sessions continues to strengthen the dominance of synchronous learning in the market.
-
BY END USERThe academic institutions segment is expected to hold the largest market share in the digital education market, driven by the widespread adoption of online learning platforms and digital classrooms. Schools and universities are embracing AI-enabled tools, cloud-based systems, and virtual learning environments to enhance teaching efficiency and student engagement. Increasing government support for digital literacy and education modernization further accelerates this trend. The growing focus on scalable, accessible, and data-driven learning continues to reinforce the segment’s leadership.
-
BY REGIONThe Asia-Pacific (APAC) region is expected to grow at the highest CAGR (26.7%) in the digital education market, driven by rapid digitalization and expanding internet penetration. Countries like India, China, Japan, and South Korea are investing heavily in edtech infrastructure, online learning platforms, and AI-driven education tools. Government initiatives promoting digital literacy and skill development are further accelerating adoption. The region’s large student population and rising demand for flexible, affordable learning solutions make APAC a key growth hub for digital education.
-
COMPETITIVE LANDSCAPEThe digital education market is highly competitive, with key players such as Coursera, Udemy, edX, Pluralsight, and Udacity leading the global landscape. These companies are focusing on AI-driven personalization, flexible learning models, and industry-aligned content to attract diverse learners across academic, professional, and corporate segments. Coursera and edX are strengthening partnerships with universities to expand accredited online degree programs, while Udemy and Pluralsight emphasize workforce upskilling and enterprise learning solutions. Udacity continues to focus on specialized technology programs and nano-degree courses. Continuous innovation, strategic collaborations, and expanding global reach define the competitive strategies shaping this fast-evolving market.
The digital education market presents significant global growth opportunities driven by rising demand for personalized, flexible, and technology-enabled learning solutions. Expanding internet penetration, smartphone adoption, and cloud infrastructure are enabling broader access to online education across regions, including emerging markets. Increasing emphasis on AI-powered adaptive learning, microlearning, and skill-based training is creating opportunities for both academic institutions and corporate training providers. Moreover, government initiatives promoting digital literacy, lifelong learning, and workforce upskilling are accelerating adoption. These factors collectively position the market for sustained global expansion, catering to diverse learners and evolving educational needs.
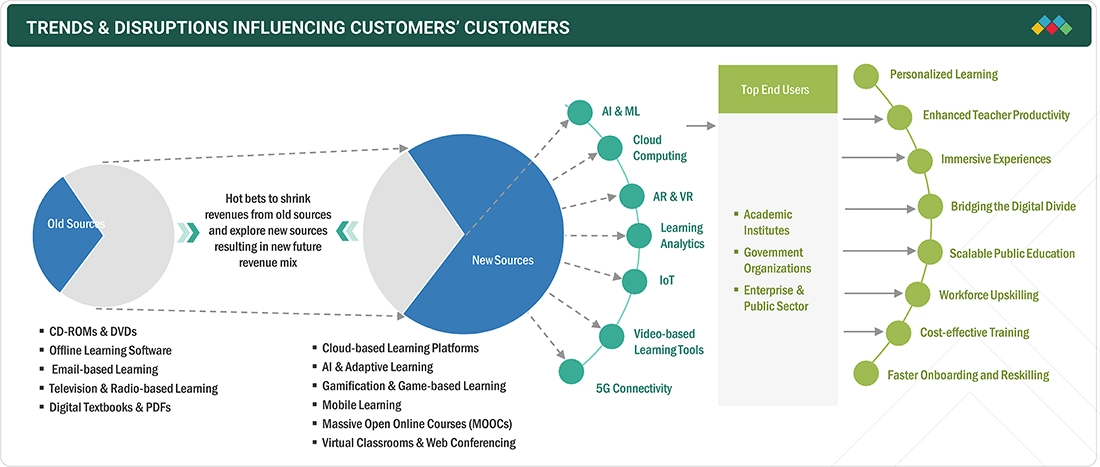
TRENDS & DISRUPTIONS IMPACTING CUSTOMERS' CUSTOMERS
The digital education market is witnessing major trends and disruptions driven by AI integration, immersive learning technologies, and data-driven personalization. Artificial intelligence and analytics are transforming content delivery, enabling adaptive learning paths and real-time performance tracking. Virtual and augmented reality (VR/AR) are creating interactive, experiential learning environments that enhance engagement and retention. The rise of microlearning, mobile learning, and hybrid education models is reshaping how learners access and consume content. These disruptions are pushing institutions and enterprises to adopt agile, tech-enabled learning ecosystems, accelerating innovation and competitiveness in the education landscape.
Source: Secondary Research, Interviews with Experts, MarketsandMarkets Analysis
MARKET DYNAMICS
Level
-
Growing demand for adaptive technology-driven personalized learning

-
Gamification enhancing student engagement in learning

Level
-
Infrastructure shortage in rural areas

-
Prolonged screen time

Level
-
Transforming microlearning and modular learning with digital education

-
Offering local language content boosts course completion rates

Level
-
Insufficient interaction in virtual classrooms hindering student engagement

-
Inadequate teacher training hampering effective integration of digital tools

Source: Secondary Research, Interviews with Experts, MarketsandMarkets Analysis
Driver: Growing demand for adaptive technology-driven personalized learning
The growing demand for personalized learning is a key driver of the digital education market, as traditional models struggle to meet diverse learner needs. AI and machine learning-based adaptive systems are enabling customized learning experiences through real-time feedback and content adjustment. In October 2024, Anthology partnered with Obrizum to integrate adaptive learning technology into Blackboard, enhancing global student engagement. Similarly, the South Korean government invested USD 0.74 billion to introduce AI-powered digital textbooks by 2028, advancing classroom personalization. In November 2024, Digital Promise and LINC launched “Yourway”, an AI tool for personalized lesson planning. These innovations highlight how AI-driven adaptive learning is reshaping education to deliver more engaging, efficient, and inclusive outcomes.
Restraint: Infrastructure shortage in rural areas
Infrastructural challenges such as limited internet access, unreliable electricity, and insufficient digital devices are major restraints on the digital education market, particularly in low-income and rural areas. For instance, a UNICEF 2025 report highlights that in Nigeria, only 36% have internet access, 78% of youth lack digital literacy, and less than half of teachers have basic ICT skills, limiting platform effectiveness. To address these gaps, governments are investing in infrastructure improvements; the UK committed USD 58.3 million to enhance school connectivity via wireless networks and fiber upgrades by 2030. Resolving these deficits is essential to expand digital education adoption and promote inclusive, equitable learning opportunities globally.
Opportunity: Transforming microlearning and modular learning with digital education
Microlearning and modular learning are transforming the digital education landscape by providing flexible, personalized, and scalable learning solutions. Microlearning delivers short, focused content like videos and quizzes for quick knowledge acquisition, ideal for professionals upskilling at their own pace. Modular learning breaks content into independent segments, allowing learners to target specific skills or knowledge gaps. The Commonwealth Bank of Australia (CBA) illustrates this trend with its AI for All microlearning series, launched in May 2024, upskilling 43,000 employees on generative AI and responsible AI through bite-sized modules and an AI Boot Camp. These approaches enhance engagement, retention, and workforce readiness in a rapidly evolving digital education environment.
Challenge: Insufficient interaction in virtual classrooms hindering student engagement
Student engagement remains a key challenge in the digital education market, as online learning often struggles with distractions, lower motivation, and limited social interaction compared to traditional classrooms. Many platforms use a one-size-fits-all approach, making it difficult to sustain active participation and reduce dropout rates. To address this, providers are adopting personalized and interactive solutions. For example, in October 2024, InScribe partnered with Pima Community College, supported by the US Department of Education, to enhance engagement through real-time support, dynamic peer networks, and integrated LMS features. Such initiatives aim to boost student motivation, persistence, and learning outcomes in digital education.
Digital Education Market: COMMERCIAL USE CASES ACROSS INDUSTRIES
| COMPANY | USE CASE DESCRIPTION | BENEFITS |
|---|---|---|
 |
ITX, a software development and consulting firm, adopted Udemy Business to drive continuous learning, enhance employee skills, and strengthen loyalty, aligning its workforce with industry needs and company values. | Fostered a strong culture of continuous learning. Upskilled employees with in-demand technical skills like JavaScript, .NET, AngularJS, and Scrum Development. Improved employee loyalty and strengthened ITX’s reputation as a great place to work. Supported global alignment with company values and norms. |
 |
The Abu Dhabi School of Government (ADSG) partnered with Coursera to upskill 60,000+ government employees through 3,600+ online courses, covering data science, AI, leadership, and digital transformation to build a future-ready workforce. | 489,162 learning hours and 33,189 courses completed, showcasing strong adoption and engagement Skills mapping and tailored content aligned with Abu Dhabi’s competency framework Integration with promotion rubrics, linking learning to career progression Real-time analytics and insights to measure ROI and track learner progress |
 |
Hallym University partnered with edX to launch the K-University Model, integrating AI-powered courses, hybrid learning, and modular curricula to align with global standards and boost student engagement. This initiative addressed declining enrollments while equipping students and faculty with innovative learning tools. | Enhanced teaching methods with AI-powered tools and hybrid models. Improved accessibility through AI translation for multilingual learning. Greater flexibility for both students and professors in course delivery. Fostered self-directed learning and global competence among students. Rapid scaling of online learning programs to meet long-term goals |
 |
Airbus, Europe’s largest aeronautics company, partnered with Udacity to digitally upskill over 1,000 employees in data analytics, AI, and machine learning, creating new technical roles. | Digitally upskilled over 1,000 employees. Established new technical roles within the organization. Delivered a 237% return on investment (ROI). Boosted employee capabilities and readiness for emerging technologies. Positioned Airbus as a leader in digital transformation in aerospace. |
Logos and trademarks shown above are the property of their respective owners. Their use here is for informational and illustrative purposes only.
MARKET ECOSYSTEM
The digital education ecosystem encompasses a wide range of academic, test preparation, and corporate learning solutions, tailored to diverse learner needs and objectives. Providers offer formal academic programs, including degrees and MOOCs, alongside test preparation platforms for competitive exams and certifications. Additionally, the ecosystem supports corporate learning, focusing on workforce upskilling, compliance training, and professional development. This diverse landscape reflects how vendors customize offerings to address specific user groups, learning goals, and market demands, shaping a comprehensive and dynamic digital education environment.
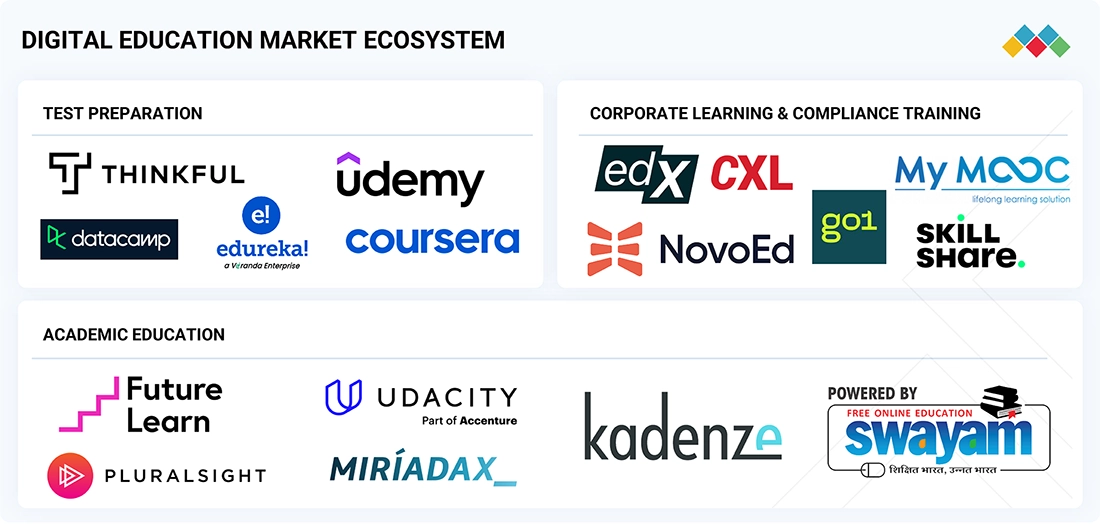
Logos and trademarks shown above are the property of their respective owners. Their use here is for informational and illustrative purposes only.
MARKET SEGMENTS
Source: Secondary Research, Interviews with Experts, MarketsandMarkets Analysis
Digital Education Market, By Learning Model
The instructor-led segment holds the largest market share as it provides structured guidance, interactive sessions, and real-time feedback, making it ideal for learners seeking high engagement and effective knowledge retention. Key drivers include: Preference for expert-led training and mentorship High learner engagement through interactive sessions Effective support for complex and professional learning outcomes These factors are driving institutions and organizations to adopt instructor-led solutions to enhance learning outcomes, ensure better skill acquisition, and deliver measurable training impact.
Digital Education Market, By Course Type
The professional certification & skill development segment is expected to grow at the highest CAGR due to increasing demand for industry-relevant skills and certifications that enable career progression and workforce readiness. Key drivers include: Growing need for industry-recognized credentials and specialized skills Rising adoption of online certification programs for career growth Alignment with emerging technologies and professional standards These trends are encouraging learners and enterprises to prioritize skill-based courses that improve employability, support career advancement, and meet evolving industry requirements.
Digital Education Market, By Delivery Model
The synchronous learning segment holds the largest market share as it enables live interaction, real-time collaboration, and immediate feedback, fostering engaging and effective learning experiences. Key drivers include: Demand for live virtual classrooms and interactive sessions Support for collaborative learning and peer engagement Integration with corporate training and academic programs These advantages are making synchronous learning the preferred mode for delivering high-quality, engaging, and impactful digital education across institutions and organizations.
Digital Education Market, By End User
The corporate enterprises segment is witnessing the highest CAGR, driven by the need for continuous employee upskilling, talent development, and scalable learning programs across global teams. Key drivers include: Emphasis on workforce development and skill enhancement Implementation of large-scale, scalable learning initiatives Focus on learning analytics to improve performance and retention These factors are motivating enterprises to invest in digital education solutions that enhance productivity, strengthen employee capabilities, and ensure competitive advantage.
REGION
Asia Pacific is expected to grow at the fastest level in the global digital education market during the forecast period.
The Asia Pacific digital education market is projected to be the fastest-growing globally, due to growing student population within the region, rapid digital governmental infrastructure expansion, and increased focus on workforce readiness. Innovations occurring throughout the region, including super app-based learning ecosystems, government-backed digital educational platforms, AI-based multilingual education solutions, and mobile-first educational delivery methods, are accelerating the accessibility and scalability of personalised learning for a diverse range of socioeconomic populations driving the growth in the market.
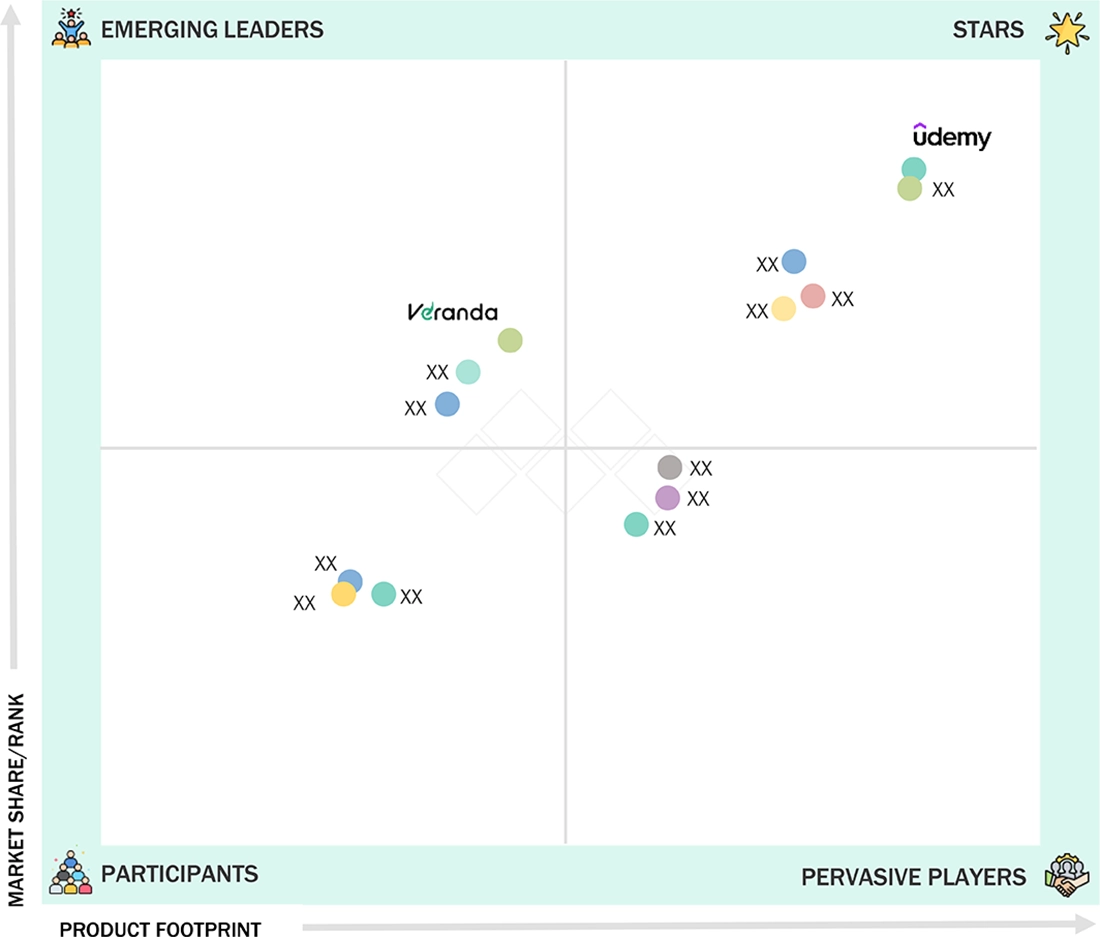
Digital Education Market: COMPANY EVALUATION MATRIX
In the global digital education market, Udemy (star), offers a vast portfolio of professional and skill-based courses with a strong international presence and AI-driven personalized learning experiences. Veranda Learning (emerging leader), is gaining recognition for its innovative instructor-led programs and interactive solutions tailored to corporate and professional training. Both companies leverage technology to enhance learner engagement, expand accessibility, and meet the growing demand for flexible, scalable, and skill-focused digital learning solutions worldwide.
Source: Secondary Research, Interviews with Experts, MarketsandMarkets Analysis
KEY MARKET PLAYERS
MARKET SCOPE
| REPORT METRIC | DETAILS |
|---|---|
| Market Size in 2024 (Value) | USD 24.94 BN |
| Market Forecast in 2030 (value) | USD 95.71 BN |
| Growth Rate | 24.2% |
| Years Considered | 2020–2030 |
| Base Year | 2024 |
| Forecast Period | 2025–2030 |
| Units Considered | Value (USD BN) |
| Report Coverage | Revenue forecast, company ranking, competitive landscape, growth factors, and trends. |
| Segments Covered |
|
| Regions Covered | North America, Asia Pacific, Europe, Middle East & Africa, Latin America |
WHAT IS IN IT FOR YOU: Digital Education Market REPORT CONTENT GUIDE
DELIVERED CUSTOMIZATIONS
We have successfully delivered the following deep-dive customizations:
| CLIENT REQUEST | CUSTOMIZATION DELIVERED | VALUE ADDS |
|---|---|---|
| Leading Provider (US) | In-depth segmentation of the global Digital Education Market, covering learning models, course types, delivery modes, and end-users. Extended regional analysis for North America, Europe, APAC, and Latin America. | Identified high-growth regional and segment opportunities across K–12, higher education, corporate training, and professional upskilling. Enabled tailored market entry strategies based on regional learning trends, regulatory environments, and digital infrastructure readiness. Supports optimized resource allocation and investment prioritization aligned with evolving learner needs, emerging technologies (AI/AR/VR), and skill development demands. |
| Leading Provider (EU) | Detailed profiling of additional market players (up to 5 vendors), including platform offerings, learning delivery methods, and competitive positioning. | Enhances competitive intelligence for strategic planning and go-to-market execution. Reveals market gaps and white spaces for differentiation and innovation. Supports targeted growth initiatives by aligning product development and content strategies with unmet learner needs and emerging demand clusters in professional certification, upskilling, and corporate learning solutions. |
RECENT DEVELOPMENTS
- April 2025 : Coursera launched Compass, an AI-driven feature that personalizes course recommendations based on learners' career goals. By completing a brief quiz, users receive tailored content suggestions aligned with 60 in-demand roles, supplemented by localized salary and job data across 39 countries. Compass aims to streamline career advancement pathways.
- January 2025 : edX introduced the 'Groups' feature within its edX For Business platform, enabling administrators to create learner groups across various plans without budget constraints. This enhancement allows for streamlined bulk course assignments, filtered progress tracking, and improved learner management, facilitating more organized and efficient training programs
- November 2024 : Pluralsight partnered with Carahsoft to deliver technology skills development solutions to US government agencies. This collaboration enables public sector organizations to access Pluralsight's comprehensive learning platform through Carahsoft's contracts, facilitating upskilling in cloud computing, cybersecurity, and software development.
- August 2024 : Alteryx partnered with Udacity to launch a comprehensive course on data preparation with Alteryx Designer, along with a free beginner course on predictive analytics. This collaboration aims to expand data and AI literacy, equipping learners with essential skills for predictive analytics and AI implementation.
Table of Contents
 Exclusive indicates content/data unique to MarketsandMarkets and not available with any competitors.
Methodology
This research study used extensive secondary sources, directories, and databases, such as D&B Hoovers, Bloomberg Businessweek, and Factiva, to identify and collect information for a technical, market-oriented, and commercial study of the digital education market. A few other market-related reports and analyses published by various industry associations and consortia, such as the National Security Agency (NSA) and SC Magazine, were considered during the secondary research. The primary sources were mainly industry experts from the core and related industries and preferred suppliers, manufacturers, distributors, service providers, technology developers, and technologists from companies and organizations related to all segments of this industry’s value chain. In-depth interviews were conducted with primary respondents, including key industry participants, subject-matter experts, C-level executives of key market players, and industry consultants, to obtain and verify critical qualitative and quantitative information and assess the prospects.
Secondary Research
The market size of companies offering digital education was arrived at based on the secondary data available through paid and unpaid sources, as well as by analyzing the product portfolios of major companies in the ecosystem and rating the companies based on their product capabilities and business strategies.
In the secondary research process, various sources were referred to to identify and collect information for the study. The secondary sources included annual reports, press releases, investor presentations of companies, product data sheets, white papers, journals, certified publications, articles from recognized authors, government websites, directories, and databases.
Secondary research was mainly used to obtain key information about the industry’s supply chain, the total pool of key players, market classification and segmentation according to industry trends to the bottom-most level, regional markets, and key developments from both market- and technology-oriented perspectives, all of which were further validated by primary sources.
Primary Research
In the primary research process, various sources from the supply and demand sides were interviewed to obtain qualitative and quantitative information for this report. The primary sources from the supply side included industry experts, such as chief executive officers (CEOs), vice presidents (VPs), marketing directors, technology and innovation directors, and related key executives from various key companies and organizations operating in the digital education market.
Primary interviews were conducted to gather insights, such as market statistics, the latest trends disrupting the market, new use cases implemented, data on revenue collected from products and services, market breakups, market size estimations, market forecasts, and data triangulation. Primary research also helped understand various technology-related trends, segmentation types, industry trends, and regions. Demand-side stakeholders, such as Chief Information Officers (CIOs), Chief Technology Officers (CTOs), Chief Security Officers (CSOs), and the installation teams of governments/end users using digital education platforms and digital initiatives project teams, were interviewed to understand the buyer’s perspective on suppliers, products, service providers, and their current use of services, which would affect the overall digital education market.

Note 1: Others include sales managers, marketing managers, and product managers.
Note 2: Tier 1 companies’ revenues are more than USD 10 billion; tier 2 companies’ revenues range between USD 1 and 10 billion; and tier 3 companies’ revenues range between USD 500 million and USD 1 billion.
Source: Industry Experts
To know about the assumptions considered for the study, download the pdf brochure
Market Size Estimation
Multiple approaches were adopted to estimate and forecast the digital education market. The first approach involved estimating the market size by the summation of the companies’ revenue generated through the sale of services.
The research methodology used to estimate the market size included the following.
- Primary and secondary research was conducted to assess the revenue contributions of major market participants in each country, with secondary research identifying these participants.
- Critical insights were obtained by conducting in-depth interviews with industry professionals, including directors, CEOs, VPs, and marketing executives, and by reading the annual and financial reports of the top firms in the market.
- Primary sources were used to verify all percentage splits and breakups, which were calculated using secondary sources.
Digital Education Market : Top-Down and Bottom-Up Approach

Data Triangulation
Once the overall market size was determined, the market was divided into segments and subsegments using the previously described market size estimation procedures. When required, market breakdown and data triangulation procedures were employed to complete the market engineering process and specify the exact figures for every market segment and subsegment. The data was triangulated by examining several variables and patterns from the government entities’ supply and demand sides.
Market Definition
Digital education refers to the use of digital technologies and tools to facilitate teaching and learning. It encompasses online learning platforms, virtual classrooms, digital content, and interactive resources that enhance access to education beyond traditional settings. Digital education enables personalized learning, supports flexible study environments, and fosters collaboration through technology. It includes various formats: e-learning, blended learning, and mobile learning. With artificial intelligence and cloud computing advancements, digital education is crucial in equipping learners with essential digital skills and promoting inclusive, lifelong learning opportunities across various age groups and educational contexts.
Stakeholders
- Students
- Teachers & Educators
- Educational Institutions
- EdTech Companies
- Governments & Regulatory Bodies
- Parents & Guardians
- Content Providers & Publishers
- Technology Providers
- Investors & Venture Capitalists
- NGOs & Foundations
- Telecommunication Companies
- Assessment & Accreditation Bodies
Report Objectives
- To define, describe, and forecast the global digital education market based on learning model (self-paced online learning, instructor-based online learning, blended learning, microlearning, adaptive learning, mobile learning), delivery mode (synchronous learning, asynchronous, hybrid/flipped classroom), course type (academic education, test preparation, professional certification & skill development, vocational training, corporate learning & compliance training), end user (educational institutions, corporate & enterprise, government & public sector, edtech companies,) and region
- To forecast the market size of the five major regional segments: North America, Europe, Asia Pacific, the Middle East & Africa, and Latin America
- To strategically analyze the market subsegments concerning individual growth trends, prospects, and contributions to the total market
- To provide detailed information related to the significant factors influencing the growth of the market (drivers, restraints, opportunities, and challenges)
- To strategically analyze macro and micro markets concerning growth trends, prospects, and their contributions to the overall market
- To analyze industry trends, patents, innovations, and pricing data related to the digital education market
- To analyze the opportunities in the market for stakeholders and provide details of the competitive landscape for major players
- To analyze the impact of AI/GenAI on the digital education market
- To profile key players in the market and comprehensively analyze their market share/ranking and core competencies
- To track and analyze competitive developments, such as mergers & acquisitions, product developments, and partnerships & collaborations in the market
Available Customizations
MarketsandMarkets provides customizations based on the company’s unique requirements using market data. The following customization options are available for the report.
Product Analysis
- The product matrix provides a detailed comparison of each company’s portfolio.
Geographic Analysis as per Feasibility
- Further breakup of the digital education market
Company Information
- Detailed analysis and profiling of five additional market players
Key Questions Addressed by the Report
What is a digital education?
Digital education refers to teaching and learning using digital technologies like computers, the Internet, software, and online platforms. It enables access to educational content anytime and anywhere, supporting self-paced and interactive learning. Tools like virtual classrooms, e-learning platforms, and AI-powered tutors personalize learning experiences. Digital education also helps educators track progress and adapt instruction based on data.
What innovations are improving digital education?
Trending innovations in digital education include AI-powered personalized learning, immersive AR/VR experiences, gamification, and blockchain-based credentials. Tools like intelligent tutoring systems, learning analytics, and metaverse classrooms enhance engagement, accessibility, and real-time progress tracking.
Which are the key vendors providing digital education?
Some significant vendors offering digital education worldwide include Udemy (US), Coursera (US), LinkedIn Learning (US), Pluralsight (US), edX (US), Udacity (US), Intellipaat (India), Swayam (India), Veranda Learning (India), and Alison (Ireland).
What is the total CAGR recorded for the digital education market from 2025 to 2030?
The digital education market is expected to achieve a CAGR of 24.2 % from 2025 to 2030.
Which are the major clients adopting digital education?
Key clients adopting the digital education platforms include:-
- Large Enterprises
- Higher Education Institutions
- K-12 Schools
- Government & Public Sector
- Healthcare Organizations
- Defense & Aerospace Sector
- Non-Profits & NGOs
- Professional Certification Bodies
Need a Tailored Report?
Customize this report to your needs
Get 10% FREE Customization
Customize This ReportPersonalize This Research
- Triangulate with your Own Data
- Get Data as per your Format and Definition
- Gain a Deeper Dive on a Specific Application, Geography, Customer or Competitor
- Any level of Personalization
Let Us Help You
- What are the Known and Unknown Adjacencies Impacting the Digital Education Market
- What will your New Revenue Sources be?
- Who will be your Top Customer; what will make them switch?
- Defend your Market Share or Win Competitors
- Get a Scorecard for Target Partners

Custom Market Research Services
We Will Customise The Research For You, In Case The Report Listed Above Does Not Meet With Your Requirements
Get 10% Free CustomisationTESTIMONIALS


Growth opportunities and latent adjacency in Digital Education Market