Distillation Systems Market by Technique (Fractional, Steam, Vacuum, MED), Application (Water Treatment, Food, Beverage, Petroleum, Pharmaceutical, Chemical), Operation (Continuous, Batch), Component, Type, Process, and Region - Global Forecast to 2023


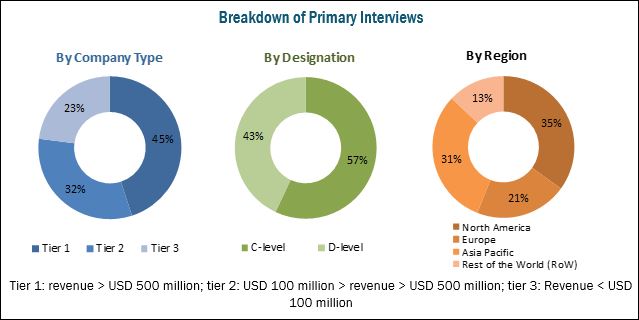
[192 Pages Report] The distillation systems market was valued at USD 5.94 billion in 2017; it is projected to grow at a CAGR of 5.1%, to reach USD 7.91 billion by 2023. The basic objective of the report is to define, segment, and project the global market size for distillation systems on the basis of component, techniques, type, industry, operation, process, and region. Other objectives include analyzing the opportunities in the market for stakeholders and providing a competitive landscape of the market trends, analyzing the macro and microeconomic indicators of this market to provide factor analysis and project the growth rate of the market. The figure below shows the breakdown of profiles of industry experts that participated in the primary discussions.
Get more details about this research, Request Free Sample Report
This report includes estimations of the distillation systems market size in terms of value (USD million). Both, top-down and bottom-up approaches have been used to estimate and validate the size of the global market and to estimate the size of various other dependent submarkets. The key players in the market have been identified through secondary research (from sources such as press releases and paid databases, which include Factiva and Bloomberg), annual reports, and financial journals; their market shares in respective regions have also been determined through primary and secondary research. All percentage shares, splits, and breakdowns have been determined using secondary sources and were verified through primary sources.
The key players that are profiled in the report include GEA (Germany), Alfa Laval (Sweden), SPX FLOW (US), Sulzer (Switzerland), Core Laboratories (Netherlands), PILODIST (Germany), Anton Paar (Austria), Praj Industries (India), L&T Hydrocarbon Engineering (India), EPIC Modular Process Systems (US), B�FA Composite System (Germany), and Bosch Packaging Technology (Germany).
This report is targeted at the existing players in the industry, which include the following:
- Manufacturers, importers & exporters, traders, distributors, and suppliers of distillation systems
- Raw material suppliers
- Food & beverage processing equipment manufacturers/suppliers
- Food & beverage manufacturers/suppliers/processors
- Petroleum refineries
- Chemicals manufacturers
- Regulatory bodies, including government agencies and NGOs
- Research & development (R&D) institutions and financial institutions
- Government organizations and consulting firms
- Trade associations and industry bodies
�The study answers several questions for stakeholders, primarily which market segments to focus on in the next two to five years for prioritizing efforts and investments.�
To know about the assumptions considered for the study, download the pdf brochure
Scope of the Distillation Systems Market Report
On the basis of Component,
- Column shells
- Plates & packings
- Reboilers & heaters
- Condenser
- Others (reflux drums, pumps, and vacuum systems)
On the basis of Technology,
- Fractional
- Steam
- Vacuum
- Multiple-effect (MED)
- Others (simple, membrane, azeotropic, and molecular)
On the basis of Type,
- Column still
- Pot still
On the basis of Industry,
- Petroleum & biorefinery
- Water treatment
- Food
- Beverage
- Alcoholic
- Non-alcoholic
- Pharmaceuticals
- Cosmetics
- Chemicals
On the basis of Operation,
- Continuous
- Batch
On the basis of Process,
- Multicomponent
- Binary
On the basis of Region,
- North America
- Europe
- Asia pacific
- Rest of the World (ROW)
Available Customizations
With the given market data, MarketsandMarkets offers customizations according to the company�s specific scientific needs.
The following customization options are available for the report:
Product Analysis
- Product matrix, which gives a detailed comparison of the product portfolio of each company
Segmental Analysis
- Further breakdown of distillation systems techniques by applications
- Further breakdown of distillation systems processes by applications
Geographic Analysis of Distillation Systems Market
- Further breakdown of the Rest of Asia Pacific market by countries
- Further breakdown of South America in the Rest of the World market, by key countries
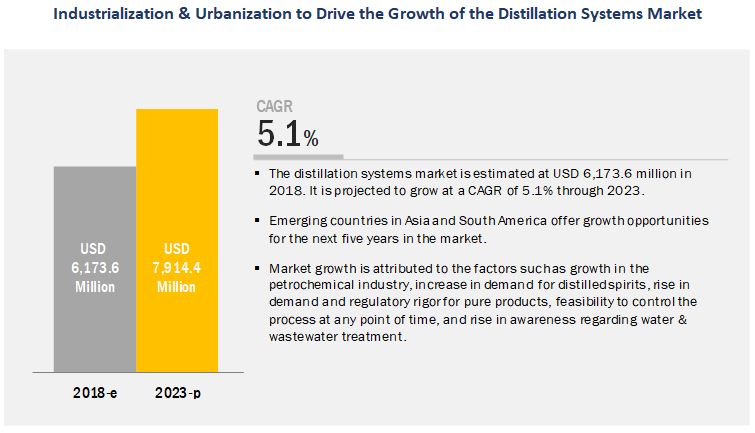
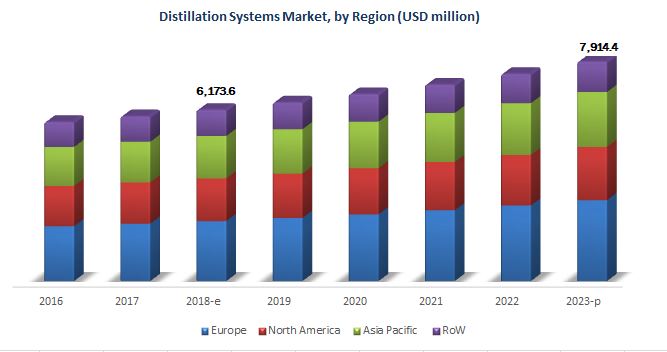
The distillation systems market is estimated to be valued at USD 6.17 billion in 2018 and is projected to reach USD 7.91 billion by 2023, at a CAGR of nearly 5.1% from 2018. Southeast Asia is a potential market for the distillation systems in various industrial applications due to the growth in the manufacturing sector in the region. The distillation process is used to separate the phases and obtain the pure form of the product. Imposition of regulations for pure products, including water, is projected to fuel the demand for distillation systems.
Get more details about this research, Request Free Sample Report
Various R&D activities have been observed in the distillation systems market pertaining to the advancement of the technologies. The research institutes and companies engaged in distillation technologies have received substantial funding in the recent years for conducting R&D activities and technological advancements. Companies are focusing on investing significantly in the R&D activities to launch new products that can offer process efficiency to their clients.
The distillation systems market, based on components, is segmented into column shells, plates & packings, reboilers & heaters, condenser, and others. The column shells segment is estimated to dominate the market with the largest share in 2018 due to the high cost of the components. This is followed by the plates & packings segment, as these are consumable components in the distillation systems and are used largely across industries.
The market, based on technique, is segmented into fractional, steam, vacuum, multiple-effect (MED), and others. The vacuum segment is projected to grow at the highest CAGR among all distillation techniques from 2018 to 2023. The technique is widely used for the separation of components, where chances of decomposition are high due to change in temperature and pressure. Vacuum distillation is commonly used for the separation of heavy hydrocarbon residues that are left during the atmospheric distillation of crude oil.
Based on application, the market is segmented into petroleum & biorefineries, water treatment, food, beverages, pharmaceuticals, cosmetics, and chemicals. Of the various applications, the beverages segment is projected to witness the fastest growth due to the high growth of the alcoholic beverage market. Distillation is an important process used in the manufacturing of alcoholic beverages, such as wine, beer, brandy, gin, rum, whiskey, and vodka. Although the continuous distillation process used in the manufacturing of alcoholic beverages dominates the market segment, the batch distillation process is also used significantly to manufacture alcoholic beverages with various flavors and different percentage levels of alcohol.
The Asia Pacific market has witnessed robust growth in the distillation systems market. The Asian subcontinent is an emerging market, which is growing at a rapid pace. Desalination requirements, high consumption of alcoholic beverages, and the rising potential for industrial growth highlight the positive growth prospects in the region. Countries such as China, India, South Korea, Australia, and Japan are among the key manufacturing hubs in the region. Distillation system manufacturers are mainly focusing on expanding their presence in the Asia Pacific market through new product launches and expansions to strengthen their position. The growing R&D activities by governments as well as private organizations in the region is projected to drive the market growth. Technological advancements in Asia Pacific countries due to the development of infrastructure provides a potential scope for innovation in the production of distillation systems, thereby improving their cost-effectiveness and output.
Distillation is regarded as a process with low efficiency due to high energy consumption. Hence, the economic burden due to the high energy consumption inhibits the growth of the market.
To speak to our analyst for a discussion on the above findings, click Speak to Analyst
 Exclusive indicates content/data unique to MarketsandMarkets and not available with any competitors.
Table of Contents
1 Introduction (Page No. - 18)
1.1 Objectives of the Study
1.2 Market Definition
1.3 Market Scope
1.4 Periodization Considered
1.5 Currency Considered
1.6 Stakeholders
2 Research Methodology (Page No. - 22)
2.1 Research Data
2.1.1 Secondary Data
2.1.2 Primary Data
2.1.2.1 Breakdown of Primaries
2.2 Market Size Estimation
2.3 Data Triangulation
2.4 Research Assumptions
2.5 Research Limitations
3 Executive Summary (Page No. - 29)
4 Premium Insights (Page No. - 35)
4.1 Opportunities in the Distillation Systems Market
4.2 Distillation Systems Market: Key Country
4.3 Distillation Systems Market, By Application & Region
4.4 Market, By Technique & Region
4.5 Developed vs Developing Markets for Distillation Systems
4.6 Distillation Systems Market, By Operation
4.7 Market, By Process
4.8 North America: Distillation Systems Market, By Application & Country
5 Market Overview (Page No. - 41)
5.1 Introduction
5.1.1 Patents Pertaining to Distillation Technology
5.2 Market Dynamics
5.2.1 Drivers
5.2.1.1 Growing Industrialization and Rapid Urbanization Fuel the Demand for Distillation Systems
5.2.1.1.1 Preference for Reactive Distillation Due to Process Efficiency
5.2.1.2 Growth in the Petrochemical & Refinery Industry
5.2.1.2.1 Stringent Environmental Regulations Pertaining to Cleaner Fuels
5.2.1.3 Growing Demand for Distilled Spirits
5.2.1.3.1 Rise in Disposable Income
5.2.1.4 Rise in the Demand and Regulatory Rigor for Pure Form Products
5.2.1.5 Convenience to Control the Process at Any Stage is Driving the Market for Distillation Systems
5.2.1.6 Increasing Awareness Regarding Water & Wastewater Treatment
5.2.1.6.1 Requirement of Selective Separation Technology for Meeting Water Quality Standards
5.2.2 Restraints
5.2.2.1 High Energy Consumption
5.2.2.1.1 Adoption of Alternative Technologies to Combat Energy Consumption
5.2.3 Opportunities
5.2.3.1 Biofuels Industry
5.2.3.2 Growth of the Manufacturing Sector in Southeast Asia
5.2.3.3 Growth in the Biopharmaceutical Industry
5.2.4 Challenges
5.2.4.1 Heat Recovery in the Process
5.2.4.2 Flooding in Distillation Columns
5.2.4.3 Inflexibility of the Process
6 Market for Distillation Systems, By Component (Page No. - 62)
6.1 Introduction
6.2 Column Shells
6.3 Plates (Or Trays) & Packings
6.4 Reboilers & Heaters
6.5 Condensers
6.6 Others
7 Market for Distillation Systems, By Technique (Page No. - 68)
7.1 Introduction
7.2 Fractional
7.3 Steam
7.4 Vacuum
7.5 Multiple-Effect (MED)
7.6 Others
8 Market for Distillation Systems, By Type (Page No. - 75)
8.1 Introduction
8.2 Pot Still
8.3 Column Still
9 Market for Distillation Systems, By Application (Page No. - 78)
9.1 Introduction
9.2 Petroleum & Biorefineries
9.3 Water Treatment
9.4 Food
9.5 Beverages
9.5.1 Alcoholic
9.5.2 Non-Alcoholic
9.6 Pharmaceuticals
9.7 Cosmetics
9.8 Chemicals
9.8.1 Industrial Alcohol
9.8.2 Petrochemicals
9.8.3 Others
10 Market for Distillation Systems, By Operation (Page No. - 87)
10.1 Introduction
10.2 Continuous
10.3 Batch
11 Market for Distillation Systems, By Process (Page No. - 92)
11.1 Introduction
11.2 Multicomponent
11.3 Binary
12 Market for Distillation Systems, By Region (Page No. - 96)
12.1 Introduction
12.2 North America
12.2.1 US
12.2.2 Canada
12.2.3 Mexico
12.2.4 Rest of North America
12.3 Europe
12.3.1 Germany
12.3.2 UK
12.3.3 France
12.3.4 Italy
12.3.5 Spain
12.3.6 Russia
12.3.7 Rest of Europe
12.4 Asia Pacific
12.4.1 China
12.4.1 Japan
12.4.2 India
12.4.3 Australia & New Zealand
12.4.4 Rest of Asia Pacific
12.5 Rest of the World (RoW)
12.5.1 South America
12.5.2 Africa
12.5.3 Middle East
13 Competitive Landscape (Page No. - 154)
13.1 Overview
13.2 Market Ranking
13.3 Competitive Scenario
13.3.1 New Product and Technology Launches
13.3.2 Expansions
13.3.3 Acquisitions
13.3.4 Agreements, Joint Ventures, and Partnerships
14 Company Profiles (Page No. - 160)
(Business Overview, Products Offered, Recent Developments, SWOT Analysis & MnM View)*
14.1 GEA
14.2 Alfa Laval
14.3 SPX Flow
14.4 Sulzer
14.5 Core Laboratories
14.6 Pilodist
14.7 Anton Paar
14.8 Praj Industries
14.9 L&T Hydrocarbon Engineering
14.1 EPIC Modular Process Systems
14.11 B�fa Composite Systems
14.12 Bosch Packaging Technology
*Details on Business Overview, Products Offered, Recent Developments, SWOT Analysis & MnM View Might Not Be Captured in Case of Unlisted Companies.
15 Appendix (Page No. - 184)
15.1 Discussion Guide
15.2 More Company Developments
15.2.1 Expansions
15.2.2 New Product Launches
15.2.3 Acquisitions
15.2.4 Partnerships
15.3 Knowledge Store: Marketsandmarkets� Subscription Portal
15.4 Available Customizations
15.5 Related Reports
15.6 Author Details
List of Tables (121 Tables)
Table 1 US Dollar Exchange Rates Considered, 2015�2017
Table 2 Patents Pertaining to Distillation Technology, 2017-2018
Table 3 World�s Largest Oil Refineries, 2016
Table 4 Control Loops of the Distillation Column
Table 5 Distillation Control Parameters and Methods to Control the Process
Table 6 Distillation Systems Market Size, By Component, 2016�2023 (USD Million)
Table 7 Column Shells: Wind and Seismic Load Bearing Capacities
Table 8 Column Shells: Internal and External Pressure Capacities
Table 9 Market Size for Distillation Systems, By Technique, 2016�2023 (USD Million)
Table 10 Fractional: Market Size for Distillation Systems, By Region, 2016�2023 (USD Million)
Table 11 Steam: Market Size for Distillation Systems, By Region, 2016�2023 (USD Million)
Table 12 Vacuum: Market Size for Distillation Systems, By Region, 2016�2023 (USD Million)
Table 13 Multiple-Effect (MED): Market Size for Distillation Systems, By Region, 2016�2023 (USD Million)
Table 14 Others: Market Size for Distillation Systems, By Region, 2016�2023 (USD Million)
Table 15 Market Size for Distillation Systems, By Application, 2016�2023 (USD Million)
Table 16 Beverages Market Size, By Beverage Type, 2016�2023 (USD Million)
Table 17 Petroleum & Biorefineries Market Size, By Region, 2016�2023 (USD Million)
Table 18 Water Treatment Market Size, By Region, 2016�2023 (USD Million)
Table 19 Food Market Size, By Region, 2016�2023 (USD Million)
Table 20 Beverages Market Size, By Region, 2016�2023 (USD Million)
Table 21 Alcoholic Beverages Market Size, By Region, 2016�2023 (USD Million)
Table 22 Non-Alcoholic Beverages Market Size, By Region, 2016�2023 (USD Million)
Table 23 Pharmaceuticals Market Size, By Region, 2016�2023 (USD Million)
Table 24 Cosmetics Market Size, By Region, 2016�2023 (USD Million)
Table 25 Chemicals Market Size, By Region, 2016�2023 (USD Million)
Table 26 Distillation Systems Market Size, By Operation, 2016�2023 (USD Million)
Table 27 Continuous Market Size for Distillation Systems, By Region, 2016�2023 (USD Million)
Table 28 Batch Market Size for Distillation Systems, By Region, 2016�2023 (USD Million)
Table 29 Market Size for Distillation Systems, By Process, 2016�2023 (USD Million)
Table 30 Multicomponent: Market Size for Distillation Systems, By Region, 2016�2023 (USD Million)
Table 31 Binary: Market Size for Distillation Systems, By Region, 2016�2023 (USD Million)
Table 32 Market Size for Distillation Systems, By Region, 2016�2023 (USD Million)
Table 33 North America: Market Size for Distillation Systems, By Country, 2016�2023 (USD Million)
Table 34 North America: Market Size, By Technique, 2016�2023 (USD Million)
Table 35 North America: Market Size, By Application, 2016�2023 (USD Million)
Table 36 North America: Market Size, By Beverage Application, 2016�2023 (USD Million)
Table 37 North America: Market Size, By Operation, 2016�2023 (USD Million)
Table 38 North America: Market Size, By Process, 2016�2023 (USD Million)
Table 39 US: List of Top Refineries, 2018 (Bbl/D)
Table 40 US: Distillation Systems Market Size, By Application, 2016�2023 (USD Million)
Table 41 US: Market Size, By Beverage Application, 2016�2023 (USD Million)
Table 42 Canada: List of Refineries, 2018 (Bbl/D)
Table 43 Canada: Market Size, By Application, 2016�2023 (USD Million)
Table 44 Canada: Market Size, By Beverage Application, 2016�2023 (USD Million)
Table 45 Mexico: List of Refineries, 2018 (Bbl/D)
Table 46 Mexico: Market Size, By Application, 2016�2023 (USD Million)
Table 47 Mexico: Market Size, By Beverage Application, 2016�2023 (USD Million)
Table 48 Rest of North America: List of Refineries In, 2018 (Bbl/D)
Table 49 Rest of North America: Market Size, By Application, 2016�2023 (USD Million)
Table 50 Rest of North America: Market Size for Distillation Systems, By Beverage Application, 2016�2023 (USD Million)
Table 51 Europe: Distillation Systems Market Size, By Country, 2016�2023 (USD Million)
Table 52 Europe: Market Size, By Technique, 2016�2023 (USD Million)
Table 53 Europe: Market Size, By Application, 2016�2023 (USD Million)
Table 54 Europe: Beverage Market Size, By Beverage Application, 2016�2023 (USD Million)
Table 55 Europe: Market Size, By Operation, 2016�2023 (USD Million)
Table 56 Food: European Market Size for Distillation Systems, By Process, 2016�2023 (USD Million)
Table 57 Germany: List of Top Refineries, 2017
Table 58 Germany: Market Size for Distillation Systems, By Application, 2016�2023 (USD Million)
Table 59 Germany: Beverage Market Size for Distillation Systems, By Beverage Application, 2016�2023 (USD Million)
Table 60 UK: List of Top Oil Refineries, 2017
Table 61 UK: Market Size, By Application, 2016�2023 (USD Million)
Table 62 UK: Beverage Distillation Systems Market Size, By Beverage Application, 2016�2023 (USD Million)
Table 63 France: List of Top Oil Refineries, 2017
Table 64 France: Market Size, By Application, 2016�2023 (USD Million)
Table 65 France: Beverage Market Size for Distillation Systems, By Beverage Application, 2016�2023 (USD Million)
Table 66 Italy: List of Top Refineries, 2017
Table 67 Italy: Market Size for Distillation Systems, By Application, 2016�2023 (USD Million)
Table 68 Italy: Beverage Market Size, By Beverage Application, 2016�2023 (USD Million)
Table 69 Spain: List of Top Refineries, 2017
Table 70 Spain: Market Size for Distillation Systems, By Application, 2016�2023 (USD Million)
Table 71 Spain: Beverage Distillation Systems Market Size, By Beverage Application, 2016�2023 (USD Million)
Table 72 Russia: List of Top Refineries, 2017
Table 73 Russia: Market Size, By Application, 2016�2023 (USD Million)
Table 74 Russia: Beverage Distillation Systems Market Size, By Beverage Application, 2016�2023 (USD Million)
Table 75 Rest of Europe: List of Refineries, 2017
Table 76 Rest of Europe: Market Size for Distillation Systems, By Application, 2016�2023 (USD Million)
Table 77 Rest of Europe: Beverage Distillation Systems Market Size, By Beverage Application, 2016�2023 (USD Million)
Table 78 Asia Pacific: Market Size for Distillation Systems, By Country, 2016�2023 (USD Million)
Table 79 Asia Pacific: Market Size, By Technique, 2016�2023 (USD Million)
Table 80 Asia Pacific: Natural Distillation Systems Market Size, By Application, 2016�2023 (USD Million)
Table 81 Asia Pacific: Beverage Distillation Systems Market Size, By Beverage Type, 2016�2023 (USD Million)
Table 82 Asia Pacific: Market Size, By Operation, 2016�2023 (USD Million)
Table 83 Asia Pacific: Food Distillation Systems Market Size, By Process, 2016�2023 (USD Million)
Table 84 China: List of Top Refineries, 2017
Table 85 China: Distillation Systems Market Size, By Application, 2016�2023 (USD Million)
Table 86 China: Beverage Distillation Systems Market Size, By Beverage Type, 2016�2023 (USD Million)
Table 87 Japan: List of Top Oil Refineries, 2017
Table 88 Japan: Market Size, By Application, 2016�2023 (USD Million)
Table 89 Japan: Beverage Distillation Systems Market Size, By Beverage Type, 2016�2023 (USD Million)
Table 90 India: List of Top Refineries, 2017
Table 91 India: Market Size, By Application, 2016�2023 (USD Million)
Table 92 India: Beverage Distillation Systems Market Size, By Beverage Type, 2016�2023 (USD Million)
Table 93 Australia & New Zealand: List of Top Refineries, 2017
Table 94 Australia & New Zealand: Distillation Systems Market Size, By Application, 2016�2023 (USD Million)
Table 95 Australia & New Zealand: Beverage Distillation Systems Market Size, By Beverage Type, 2016�2023 (USD Million)
Table 96 Rest of Asia Pacific: List of Top Refineries, 2017
Table 97 Rest of Asia Pacific: Market Size for Distillation Systems, By Application, 2016�2023 (USD Million)
Table 98 Rest of Asia Pacific: Beverage Market Size for Distillation Systems, By Beverage Type, 2016�2023 (USD Million)
Table 99 RoW: Distillation Systems Market Size, By Region, 2016�2023 (USD Million)
Table 100 RoW: Market Size, By Technique, 2016�2023 (USD Million)
Table 101 RoW: Market Size, By Application, 2016�2023 (USD Million)
Table 102 RoW: Market Size, By Beverage Application, 2016�2023 (USD Million)
Table 103 RoW: Market Size, By Operation, 2016�2023 (USD Million)
Table 104 RoW: Market Size, By Process, 2016�2023 (USD Million)
Table 105 South America: List of Top Refineries, 2017
Table 106 South America: Distillation Systems Market Size, By Application, 2016�2023 (USD Million)
Table 107 South America: Market Size, By Beverage Application, 2016�2023 (USD Million)
Table 108 Africa: List of Top Refineries, 2017
Table 109 Africa: Market Size for Distillation Systems, By Application, 2016�2023 (USD Million)
Table 110 Africa: Market Size, By Beverage Application, 2016�2023 (USD Million)
Table 111 Middle East: List of Top Refineries, 2017
Table 112 Middle East: Distillation Systems Market Size, By Application, 2016�2023 (USD Million)
Table 113 Middle East: Market Size, By Beverage Application, 2016�2023 (USD Million)
Table 114 New Product and Technology Launches, 2014�2018
Table 115 Expansions, 2012�2018
Table 116 Acquisitions, 2014�2018
Table 117 Agreements, Joint Ventures, and Partnerships, 2014�2018
Table 118 Expansions, 2018
Table 119 New Product Launches, 2014
Table 120 Acquisitions, 2018
Table 121 Partnerships, 2015�2018
List of Figures (62 Figures)
Figure 1 Distillation Systems Market: Market Segmentation
Figure 2 Distillation Systems Market: Geographic Segmentation
Figure 3 Research Design: Distillation Systems
Figure 4 Market Size Estimation Methodology: Bottom-Up Approach
Figure 5 Market Size Estimation Methodology: Top-Down Approach
Figure 6 Data Triangulation Methodology
Figure 7 Distillation Systems Market Snapshot, By Technique, 2018 vs 2023 (USD Million)
Figure 8 Market Size, By Application, 2018 vs 2023 (USD Million)
Figure 9 Market Size, By Operation, 2018 vs 2023 (USD Million)
Figure 10 Market Size for Distillation Systems, By Process, 2018 vs 2023 (USD Million)
Figure 11 Europe to Grow at the Highest CAGR in the Market From 2018 Through 2023
Figure 12 Market Share, By Region, 2017
Figure 13 Industrialization & Urbanization to Drive the Growth of the Market
Figure 14 The UK to Be the Fastest-Growing Country in the Market By 2023
Figure 15 Europe Dominated Globally With the Largest Shares in Four Applications of Distillation Systems in 2017
Figure 16 Fractional Distillation Dominated the Market Across All Regions in 2017
Figure 17 Developing Countries to Emerge at the Highest Growth Rates During the Forecast Period
Figure 18 Continuous Segment Dominated the Market Across All Operation Types
Figure 19 Multicomponent Segment Dominated the Market Across All Processes
Figure 20 The US Accounted for the Largest Share in 2017
Figure 21 Distillation Systems Market Dynamics
Figure 22 Population Living in Urban Areas (%)
Figure 23 Global Annual Growth Rate of Industries, 2012�2017
Figure 24 World Primary Energy Demand, By Fuel Type, 2015�2040 (Mboe/D)
Figure 25 Scotch Whisky Companies and Their Market Share, 2015
Figure 26 Alcohol Consumption, 2015 (Liters Per Capita)
Figure 27 World GDP Growth, 2011�2018 (%)
Figure 28 Net Annual Growth Rate in Household Disposable Income By Country, 2016
Figure 29 US Disposable Personal Income, 2017�2018 (USD Billion)
Figure 30 Population in Countries Having Access to Wastewater Treatment Facilities, 2011�2016 (%)
Figure 31 US Total Energy Consumption, 2017
Figure 32 Biofuel Production, By Region, 2011�2016 (Terawatt-Hours Per Year)
Figure 33 Market Size for Distillation Systems, By Component, 2018 vs 2023 (USD Million)
Figure 34 Market Size, By Technique, 2018 vs 2023 (USD Million)
Figure 35 Fractional: Distillation Systems Market Size, By Region, 2018 vs 2023
Figure 36 Market Share (Value), By Type, 2017
Figure 37 Market Size for Distillation Systems, By Application, 2018 vs 2023 (USD Million)
Figure 38 Crude Oil Input to Refineries, 2018 (Mt)
Figure 39 Petroleum & Biorefineries Market Size, By Region, 2018 vs 2023
Figure 40 Market Size for Distillation Systems, By Operation, 2018 vs 2023 (USD Million)
Figure 41 Continuous Distillation Systems Market Size, By Region, 2018 vs 2023 (USD Million)
Figure 42 Market Size for Distillation Systems, By Process, 2018 vs 2023 (USD Million)
Figure 43 Multicomponent: Distillation Systems Market Size, By Region, 2018 vs 2023 (USD Million)
Figure 44 The US Held the Largest Share in the Market, 2017
Figure 45 North America: Market Snapshot
Figure 46 Europe: Market Snapshot
Figure 47 Asia Pacific: Market Snapshot
Figure 48 Key Developments of the Leading Players in the Distillation Systems Market, 2014-2018
Figure 49 Top Five Companies in the Market, 2017
Figure 50 Market Evaluation Framework
Figure 51 GEA: Company Snapshot
Figure 52 GEA: SWOT Analysis
Figure 53 Alfa Laval: Company Snapshot
Figure 54 Alfa Laval: SWOT Analysis
Figure 55 SPX Flow: Company Snapshot
Figure 56 SPX Flow: SWOT Analysis
Figure 57 Sulzer: Company Snapshot
Figure 58 Sulzer: SWOT Analysis
Figure 59 Core Laboratories: Company Snapshot
Figure 60 Core Laboratories: SWOT Analysis
Figure 61 Praj Industries: Company Snapshot
Figure 62 L&T Hydrocarbon Engineering: Company Snapshot


Growth opportunities and latent adjacency in Distillation Systems Market