Deodorization Systems Market by Seedoil (Palm Oil, Soybean, Sunflower, Groundnut & Others), Component, Refinery Method (Physical & Chemical), Operation (Batch, Semi, & Automatic), Technique (Thin Film & Packed Column) - Global Forecast to 2023


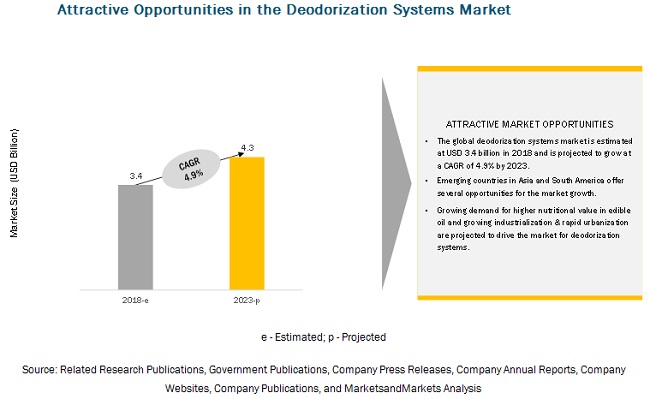
[184 Pages Report] The deodorization systems market is estimated to account for a value of USD 3.4 billion in 2018 and is projected to grow at a CAGR of 4.9% from 2018, to reach a value of USD 4.3 billion by 2023. Growing industrialization and rapid urbanization, growth in the oil industry, and growing demand for higher nutritional value in edible oil are some of the factors driving the growth of the deodorization systems market.
By technology, the packed column segment is projected to be the fastest-growing segment in the deodorization systems market during the forecast period.
The packed column segment in the market is projected to be the fastest-growing segment as packed column technology employs a dual temperature system, which allows the deodorizer to operate in two different temperatures. This enables the system to achieve a better balance in terms of the residence time for deodorization, thereby allowing the deodorization equipment to process edible oils at various temperature and pressure requirements.
By refining method, the chemical refining segment is projected to dominate the deodorization systems during the forecast period.
The chemical refining segment is projected to hold the largest market share in the deodorization systems during the forecast period as it is relatively an efficient method for reducing the fatty acid content in the crude oil with higher boiling point. This method is used in order to treat the oil with high free fatty acid content.
By edible oil, the palm oil segment is projected to dominate the deodorization systems market during the forecast period.
The palm oil segment dominates the market as palm oil is easily refined and has lower costs. Palm oils have a high tocopherol content, which is favored by commercial industries as this results in better stability in the oils, thereby improving their shelf life. Indonesia and Malaysia are among the key players in the palm oil market
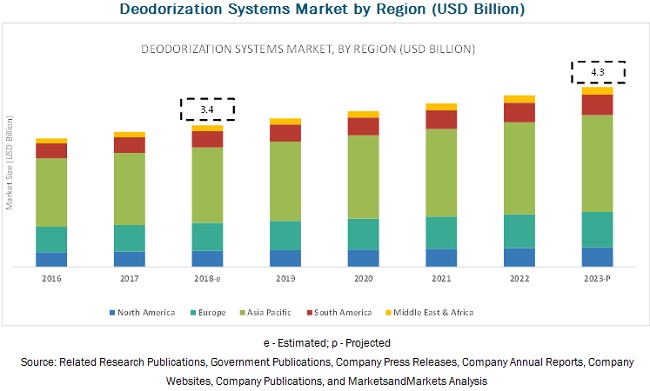
The increasing demand for deodorization systems in the Asia Pacific region is driving the growth of the deodorization systems market.
The Asia Pacific countries are witnessing increasing demand for deodorization solutions. High industrial growth potential and industry favorable policies, increasing demand for edible oil due to growing population, and increasing manufacturer participation through setting up of new refinery units have driven the market for deodorization systems in this region. Emerging markets such as China and India are the major suppliers of deodorization systems in this region.
Key Market Players
Key players in this market include Alfa Laval AB (Sweden), Desmet Ballestra (Belgium), Crown Iron Works (US), Compro International (Canada), Zhengzhou Sunshine Machinery Co. Inc. (China), Luohe Zhonzhiyuan Grains & Oil Machinery Co. Inc (China), Myande Group (China), Goyum Screw Press Pvt. Ltd. (India), HUM Oil and Fat Technologies (Turkey), Andreotti Impianti S.p.A (Italy), DVC Process Technologists Pvt. Ltd. (India), and Gianazza International S.p.A. (Italy). Major players in this market are focusing on increasing their market share and presence through new product launches & developments, investments, and partnerships. These companies have a strong presence in Asia Pacific and Europe. They also have manufacturing facilities along with strong distribution networks across these regions.
Recent Developments:
- In May 2018, Myande Group launched a 3D design application for its oil and fat engineering products, which included all technologies and derivatives associated with the market. The launch of 3D design applications would ensure a faster and more accurate design process aimed toward eliminating any design errors and improving client interaction to ensure smoother workflow, observe dynamic changes, and highlight future problems.
- In April 2018, Desmet Ballestra announced its plan to invest in the R&D department to develop new sustainable processes, optimize designs & yields, improve health & safety standards, and test new customer applications.
- In April 2018, Alfa Laval launched a new series of products for oilseed processing. The new products launched by the company included an enzymatic degumming biological catalyst aimed at improving oil recovery and enhancing efficiency in the process.
- In September 2015, Zhengzhou Sunshine Machinery Co. Ltd. announced the development of its new line of machinery for soybean. The primary function of the machine would be focused on the extraction process. The new machine includes deodorization systems, which are aimed at increasing the yield and eliminating any kind of oil loss that may occur during the processing.
Key questions addressed by the report:
- What are the new technologies in the deodorization systems market that companies are exploring?
- Who are some of the key players operating in the market and how intense is the competition?
- What kind of competitors and stakeholders would be interested in this market? What will be their go-to-market strategy, and which emerging market will be of significant interest?
- How are the current R&D activities and M&A�s in the market projected to create a disrupting environment in the coming years?
- What will be the level of impact of new product launches on the revenues of stakeholders, due to the benefits offered by the market, such as increasing revenue, environmental regulatory compliance, and sustainable profits for the suppliers?
To speak to our analyst for a discussion on the above findings, click Speak to Analyst
 Exclusive indicates content/data unique to MarketsandMarkets and not available with any competitors.
Table of Contents
1 Introduction (Page No. - 18)
1.1 Objectives of the Study
1.2 Market Definition
1.3 Market Scope
1.4 Periodization Considered
1.5 Currency Considered
1.6 Stakeholders
2 Research Methodology (Page No. - 23)
2.1 Research Data
2.1.1 Secondary Data
2.1.2 Primary Data
2.1.2.1 Breakdown of Primaries
2.2 Market Size Estimation
2.3 Data Triangulation
2.4 Research Assumptions
2.5 Research Limitations
3 Executive Summary (Page No. - 30)
4 Premium Insights (Page No. - 35)
4.1 Opportunities in the Deodorization Systems Market
4.2 Market: Key Country/Region
4.3 Market, By Component
4.4 Developed vs Developing Markets for Deodorization Systems
4.5 Market, By Operation
4.6 Market, By Refining Method
4.7 Asia Pacific: Deodorization Systems Market, By Edible Oil and Country, 2017
5 Market Overview (Page No. - 40)
5.1 Introduction
5.2 Industry Trends
5.2.1 Higher Capacities
5.2.2 High-Energy Efficiency
5.2.3 High-Stripping Efficiency
5.2.4 Lower Neutral Oil Losses
5.2.5 Lower Heat Load
5.2.6 Lower Pressure
5.2.7 Higher Distillate Value
5.3 Patent Analysis
5.4 Market Dynamics
5.4.1 Drivers
5.4.1.1 Growing Industrialization and Rapid Urbanization
5.4.1.1.1 Growth in Nanoneutralization Deodorization Technology
5.4.1.2 Growth in the Oil Industry
5.4.1.2.1 Increasing Demand for Edible Oil for Domestic Use
5.4.1.2.2 Increasing Demand for Deodorizer Distillates for Industrial Use
5.4.1.3 Growing Demand for Higher Nutritional Value in Edible Oil
5.4.1.3.1 Stringent Regulations Imposed on Oil Production
5.4.1.4 Facilitates Easy System Control
5.4.1.5 Technological Developments to Overcome Process Limitations
5.4.1.5.1 Heat Recovery Systems
5.4.1.5.2 Automated Systems and Higher Processing Capacities
5.4.2 Restraints
5.4.2.1 High Energy Consumption
5.4.2.1.1 Adoption of Heat Recovery Technologies
5.4.3 Opportunities
5.4.3.1 Growth of the Manufacturing Sector in Southeast Asia
5.4.3.2 Upcoming Demand for Hybridization of Algal Oils With Regular Oils
5.4.4 Challenges
5.4.4.1 Technical Difficulties During Oil Processing
5.4.4.2 Oil Losses By Evaporation
5.4.4.3 Oil Losses By Entrainment
6 Deodorization Systems Market, By Component (Page No. - 57)
6.1 Introduction
6.2 Pumps
6.3 Towers
6.4 Coolers
6.5 Oil and Water Management Systems
6.6 Tanks
6.7 Others
7 Deodorization Systems Market, By Technology (Page No. - 60)
7.1 Introduction
7.2 Thin Film
7.3 Packed Column
7.3.1 Increasing Capacities Back Growth of Packed Column Systems
8 Deodorization Systems Market, By Refining Method (Page No. - 62)
8.1 Introduction
8.2 Physical Refining
8.3 Chemical Refining
8.3.1 Increased Production and Demand for Palm Oils Driving Chemical Refining Growth
9 Deodorization Systems Market, By Edible Oil (Page No. - 67)
9.1 Introduction
9.1.1 Soybean Oil
9.1.1.1 US and South America to Be the Dominant Regions for Soybean Oil Deodorization Systems
9.1.2 Olive Oil
9.1.2.1 Spain Captures the Largest Market for Olive Oil Deodorization Market
9.1.3 Peanut Oil
9.1.3.1 India and China to Be the Fastest Growing Markets for Peanut Oil Deodorization Systems
9.1.4 Rapeseed/Canola Oil
9.1.4.1 European Market Dominated the Deodorization Systems Market for Canola Oil
9.1.5 Sunflower Oil
9.1.5.1 Ukraine is the Largest Country to Produce Sunflower Oil With A Volume of 6,235 Tons
9.1.6 Palm Kernel Oil
9.1.6.1 Indonesia and Malaysia Set to Dominate International Markets for Palm Oil Production
9.1.7 Cottonseed Oil
9.1.7.1 Continuous Deodorization is the Largely Applied Operation System for Cottonseed Oil Production
9.1.8 Coconut Oil
9.1.8.1 Indonesia to Be the Dominant Market for Coconut Oil Deodorization Systems
9.1.9 Palm Oil
9.1.9.1 Indonesia and Malaysia to Be the Largest and Fastest Growing Markets for Palm Oil Production
9.1.10 Others
9.1.10.1 US is the Largest Exporter of Corn Oil in the World
10 Deodorization Systems Market, By Operation (Page No. - 82)
10.1 Introduction
10.2 Batch Deodorization Systems
10.2.1 Largely Used in the Small-Scale Edible Oil Refineries
10.3 Semi-Continuous Systems
10.3.1 Margarine and Shortenings are the Major Application Areas for Semi-Continuous Systems
10.4 Continuous Deodorization Systems
10.4.1 Largest and the Fastest Growing Systems for Process Efficiency in Large-Scale Units
11 Deodorization Systems Market, By Region (Page No. - 92)
11.1 Introduction
11.2 North America
11.2.1 US
11.2.1.1 Increasing Edible Oil Imports to Supplement Growth of Deodorization Systems in Us
11.2.2 Canada
11.2.2.1 Increasing Production and Edible Oil Exports Drive Demand for Deodorization Systems in the Canadian Market
11.2.3 Mexico
11.2.3.1 Increasing Domestic Demand and Imports to Impact Mexican Deodorization Systems Market
11.3 Europe
11.3.1 Germany
11.3.1.1 Increasing International Presence to Drive German Deodorization Systems Market
11.3.2 UK
11.3.2.1 Edible Oil Imports and Healthy Consumer Lifestyle Drive Growth for UK Deodorization Systems Market
11.3.3 France
11.3.3.1 Manufacturer Interests Advance French Edible Oils Industry
11.3.4 Italy
11.3.4.1 Demand for Healthy Oils and Fats Prompts Edible Oil Market Growth in Italy
11.3.5 Netherlands
11.3.5.1 Centralized Hubs and Increasing Trade Volumes Advance Edible Oils and Deodorization Systems in Netherlands
11.3.6 Rest of Europe
11.3.6.1 Fragmented Markets Push Demand for Deodorization Systems in Rest of Europe
11.4 Asia Pacific
11.4.1 China
11.4.1.1 Large Manufacturer Base and Increasing Local Production Dictates Positive Growth for Deodorization Systems in Chinese Markets
11.4.2 Japan
11.4.2.1 Corporate Consolidation and Fierce Competition From Neighboring Countries to Affect Growth Prospects in Japan
11.4.3 India
11.4.3.1 Participation From Local Manufacturers and Increased Domestic Production Highlights Positive Growth Prospects in Indian Markets
11.4.4 Indonesia
11.4.4.1 Increasing Exports and Global Demand Influence Indonesian Deodorization Systems Market
11.4.5 Malaysia
11.4.5.1 Environmental Concerns and Government Intervention to Affect Prospects for Deodorization Systems Market in Malaysia
11.4.6 Rest of Asia Pacific
11.4.6.1 Increased Local Production and Competition From Neighboring Countries to Drive Growth in Rest of Asia Pacific Markets
11.5 South America
11.5.1 Brazil
11.5.1.1 Soybean Exports and Escalating Trade Tensions Between US and China to Drive Growth for Brazilian Deodorization Systems Market
11.5.2 Argentina
11.5.2.1 Ideal Climactic Conditions for Soybean Production to Drive Argentinian Deodorization System Markets
11.5.3 Rest of South America
11.5.3.1 Increasing Exports of Palm and Rapeseed to Impact Deodorization Systems in the Rest of South America
11.6 Middle East & Africa
11.6.1 South Africa
11.6.1.1 Increasing Agricultural Capabilities and Local Demand to Have A Positive Influence on South African Markets
11.6.2 Middle East
11.6.2.1 Easing Regulations and Increasing Market Participants Have A Positive Impact on Middle Eastern Markets
11.6.3 Rest of Africa
11.6.3.1 Fragmented Markets in Rest of Africa to Fill in the Increasing Local Demand for Deodorization Systems
11.6.3.1.1 Ghana
11.6.3.1.2 Tanzania
12 Competitive Landscape (Page No. - 153)
12.1 Overview
12.2 Market Ranking
12.3 Competitive Scenario
12.3.1 New Product Launches& Developments
12.3.2 Investments and Partnerships
13 Company Profiles (Page No. - 159)
(Business Overview, Products Offered, Recent Developments, SWOT Analysis, MnM View)*
13.1 Alfa Laval
13.2 Desmet Ballestra
13.3 Crown Iron Works
13.4 Compro International
13.5 Zhengzhou Sunshine Machinery Co. Ltd.
13.6 Luohe Zhongzhiyuan Grains & Oil Machinery Co. Ltd.
13.7 Myande Group Co. Ltd.
13.8 Goyum Screw Press
13.9 Hum Oil & Fat Technologies
13.10 Andreotti Impianti S.P.A
13.11 DVC Process Technologists Pvt. Ltd.
13.12 Gianazza International S.P.A
*Details on Business Overview, Products Offered, Recent Developments, SWOT Analysis, MnM View Might Not Be Captured in Case of Unlisted Companies.
14 Appendix (Page No. - 177)
14.1 Discussion Guide
14.2 Knowledge Store: Marketsandmarkets� Subscription Portal
14.3 Available Customizations
14.4 Related Reports
14.5 Author Details
List of Tables (125 Tables)
Table 1 US Dollar Exchange Rates Considered for Study, 2015�2017
Table 2 Patents Pertaining to Deodorization Systems
Table 3 Control Loops of Deodorization Column
Table 4 Deodorization Control Parameters and Methods to Control the Process
Table 5 Differences Between Physical and Chemical Refining
Table 6 Deodorization Systems Market Size, By Refining Method, 2016�2023 (USD Million)
Table 7 Market Size for Physical Refining Method, By Region, 2016�2023 (USD Million)
Table 8 Market Size for Chemical Refining Method, By Region, 2016�2023 (USD Million)
Table 9 Edible Oil Fat Content and Refining Methods
Table 10 Global Edible Oil Production, 2014�2018 (MMT)
Table 11 Market Size, By Edible Oil, 2016�2023 (USD Million)
Table 12 Soybean Oils Snapshot
Table 13 Soybean: Deodorization Systems Market Size, By Region, 2016�2023 (USD Million)
Table 14 Eu Olive Oil Production, 2014�2017 (Tons)
Table 15 Olive Oil: Market Size, By Region, 2016�2023 (USD Million)
Table 16 Peanut Oil: Market Size, By Region, 2016�2023 (USD Million)
Table 17 Global Rapeseed Oil Production, 2014 (Pounds)
Table 18 Rapeseed/Canola Oil: Market Size, By Region, 2016�2023 (USD Million)
Table 19 Global Sunflower Oil Production, 2017 (Tons)
Table 20 Sunflower Oil: Market Size, By Region, 2016�2023 (USD Million)
Table 21 Palm Kernel Oil: Market Size, By Region, 2016�2023 (USD Million)
Table 22 Cottonseed Oil: Market Size, By Region, 2016�2023 (USD Million)
Table 23 Coconut Oil: Market Size, By Region, 2016�2023 (USD Million)
Table 24 Global Palm Oil Production, 2017 (Pounds)
Table 25 Palm Oil: Market Size, By Region, 2016�2023 (USD Million)
Table 26 Others Oils: Market Size, By Region, 2016�2023 (USD Million)
Table 27 Market Size, By Operation, 2016�2023 (USD Million)
Table 28 Process Effects on Deodorized Oil Quality
Table 29 Batch Market Size, By Region, 2016�2023 (USD Million)
Table 30 Deodorizer Operating Conditions for Vegetable Oils
Table 31 Semi-Continuous Market Size, By Region, 2016�2023 (USD Million)
Table 32 Continuous Market Size, By Region, 2016�2023 (USD Million)
Table 33 Processing Parameters Influencing Deodorization
Table 34 Market Size, By Region, 2016�2023 (USD Million)
Table 35 North America: Deodorization Systems Market Size, By Country, 2016�2023 (USD Million)
Table 36 North America: Market Size, By Edible Oil, 2016�2023 (USD Million)
Table 37 North America: Market Size for Palm Oil, By Country, 2016�2023 (USD Million)
Table 38 North America: Market Size for Soybean Oil, By Country, 2016�2023 (USD Million)
Table 39 North America: Market Size for Rapeseed Oil, By Country, 2016�2023 (USD Million)
Table 40 North America: Market Size for Sunflower Oil, By Country, 2016�2023 (USD Million)
Table 41 North America: Market Size for Palm Kernel Oil, By Country, 2016�2023 (USD Million)
Table 42 North America: Market Size for Cottonseed Oil, By Country, 2016�2023 (USD Million)
Table 43 North America: Market Size for Peanut Oil, By Country, 2016�2023 (USD Million)
Table 44 North America: Market Size for Coconut Oil, By Country, 2016�2023 (USD Million)
Table 45 North America: Market Size for Olive Oil, By Country, 2016�2023 (USD Million)
Table 46 North America: Market Size for Other Oils, By Country, 2016�2023 (USD Million)
Table 47 US: Market Size, By Edible Oil, 2016�2023 (USD Million)
Table 48 Canada: Market Size, By Edible Oil, 2016�2023 (USD Million)
Table 49 Mexico: Market Size, By Edible Oil, 2016�2023 (USD Million)
Table 50 Europe: Market Size, By Edible Oil, 2016�2023 (USD Million)
Table 51 Europe: Market Size, By Country, 2016�2023 (USD Million)
Table 52 Europe: Market Size for Palm Oil, By Country, 2016�2023 (USD Million)
Table 53 Europe: Market Size for Soybean Oil, By Country, 2016�2023 (USD Million)
Table 54 Europe: Market Size for Rapeseed Oil, By Country, 2016�2023 (USD Million)
Table 55 Europe: Market Size for Sunflower Oil, By Country, 2016�2023 (USD Million)
Table 56 Europe: Market Size for Palm Kernel Oil, By Country, 2016�2023 (USD Million)
Table 57 Europe: Market Size for Cottonseed Oil, By Country, 2016�2023 (USD Million)
Table 58 Europe: Market Size for Peanut Oil, By Country, 2016�2023 (USD Million)
Table 59 Europe: Market Size for Coconut Oil, By Country, 2016�2023 (USD Million)
Table 60 Europe: Deodorization Systems Market Size for Olive Oil, By Country, 2016�2023 (USD Million)
Table 61 Europe: Market Size for Other Oils, By Country, 2016�2023 (USD Million)
Table 62 Germany: Deodorization Equipment Market Size, By Edible Oil, 2016�2023 (USD Million)
Table 63 UK: Deodorization Equipment Market Size, By Edible Oil, 2016�2023 (USD Million)
Table 64 France: Deodorization Equipment Market Size, By Edible Oil, 2016�2023 (USD Million)
Table 65 Italy: Deodorization Equipment Market Size, By Edible Oil, 2016�2023 (USD Million)
Table 66 Netherlands: Market Size, By Edible Oil, 2016�2023 (USD Million)
Table 67 Rest of Europe: Market Size, By Edible Oil, 2016�2023 (USD Million)
Table 68 Asia Pacific: Market Size, By Country/Region, 2016�2023 (USD Million)
Table 69 Asia Pacific: Deodorization Systems Market Size, By Edible Oil, 2016�2023 (USD Million)
Table 70 Asia Pacific: Market Size for Palm Oil, By Country/Region, 2016�2023 (USD Million)
Table 71 Asia Pacific: Market Size for Soybean Oil, By Country/Region, 2016�2023 (USD Million)
Table 72 Asia Pacific: Market Size for Rapseed Oil, By Country/Region, 2016�2023 (USD Million)
Table 73 Asia Pacific: Market Size for Sunflower Oil, By Country/Region, 2016�2023 (USD Million)
Table 74 Asia Pacific: Market Size for Palm Kernel Oil, By Country/Region, 2016�2023 (USD Million)
Table 75 Asia Pacific: Market Size for Cottonseed Oil, By Country/Region, 2016�2023 (USD Million)
Table 76 Asia Pacific: Market Size for Peanut Oil, By Country/Region, 2016�2023 (USD Million)
Table 77 Asia Pacific: Market Size for Coconut Oil, By Country/Region, 2016�2023 (USD Million)
Table 78 Asia Pacific: Market Size for Olive Oil, By Country/Region, 2016�2023 (USD Million)
Table 79 Asia Pacific: Market Size for Other Oils, By Country/Region, 2016�2023 (USD Million)
Table 80 China Market Size, By Edible Oil, 2016�2023 (USD Million)
Table 81 Japan Market Size, By Edible Oil, 2016�2023 (USD Million)
Table 82 India Market Size, By Edible Oil, 2016�2023 (USD Million)
Table 83 Indonesia Market Size, By Edible Oil, 2016�2023 (USD Million)
Table 84 Malaysia Market Size, By Edible Oil, 2016�2023 (USD Million)
Table 85 Rest of Asia Pacific: Market Size, By Edible Oil, 2016�2023 (USD Million)
Table 86 South America: Deodorization Systems Market Size, By Country, 2016�2023 (USD Million)
Table 87 South America: Market Size, By Edible Oil, 2016�2023 (USD Million)
Table 88 South America: Market Size for Palm Oil, By Country, 2016�2023 (USD Million)
Table 89 South America: Market Size for Soybean Oil, By Country, 2016�2023 (USD Million)
Table 90 South America: Market Size for Rapeseed Oil, By Country, 2016�2023 (USD Million)
Table 91 South America: Market Size for Sunflower Oil, By Country, 2016�2023 (USD Million)
Table 92 South America: Market Size for Palm Kernel Oil, By Country, 2016�2023 (USD Million)
Table 93 South America: Market Size for Cottonseed Oil, By Country, 2016�2023 (USD Million)
Table 94 South America: Market Size for Peanut Oil, By Country, 2016�2023 (USD Million)
Table 95 South America: Market Size for Coconut Oil, By Country, 2016�2023 (USD Million)
Table 96 South America: Market Size for Olive Oil, By Country, 2016�2023 (USD Million)
Table 97 South America: Market Size for Other Oils, By Country, 2016�2023 (USD Million)
Table 98 Brazil: Market Size, By Edible Oil, 2016�2023 (USD Million)
Table 99 Argentina: Market Size, By Edible Oil, 2016�2023 (USD Million)
Table 100 Rest of South America: Market Size, By Edible Oil, 2016�2023 (USD Million)
Table 101 Sub-Saharan Africa: Palm Oil Imports From Malaysia, By Country, 2017 (MT)
Table 102 Middle East & Africa: Oil Production, 2017 (Tons)
Table 103 Middle East & Africa: Deodorization Systems Market Size, By Country/Region, 2016�2023 (USD Million)
Table 104 Middle East & Africa: Market Size, By Edible Oil, 2016�2023 (USD Million)
Table 105 Middle East & Africa: Palm Oil: Market Size, By Country/Region, 2016�2023 (USD Million)
Table 106 Middle East & Africa: Soybean Oil: Market Size, By Country/Region, 2016�2023 (USD Million)
Table 107 Middle East & Africa: Market Size for Rapeseed Oil, By Country/Region, 2016�2023 (USD Million)
Table 108 Middle East & Africa: Market Size for Sunflower Oil, By Country/Region, 2016�2023 (USD Million)
Table 109 Middle East & Africa: Market Size for Palm Kernel Oil, By Country/Region, 2016�2023 (USD Million)
Table 110 Middle East & Africa: Market Size for Cottonseed Oil, By Country/Region, 2016�2023 (USD Million)
Table 111 Middle East & Africa: Market Size for Peanut Oil, By Country/Region, 2016�2023 (USD Million)
Table 112 Middle East & Africa: Market Size for Coconut Oil, By Country/Region, 2016�2023 (USD Million)
Table 113 Middle East & Africa: Market Size for Olive Oil, By Country/Region, 2016�2023 (USD Million)
Table 114 Middle East & Africa: Market Size for Other Oils, By Country/Region, 2016�2023 (USD Million)
Table 115 South Africa: Soybean Oil Production, 2014�2017
Table 116 South Africa: Sunflower Oil Production, 2014�2017
Table 117 South Africa: Market Size, By Edible Oil, 2016�2023 (USD Million)
Table 118 Middle East: Market Size, By Edible Oil, 2016�2023 (USD Million)
Table 119 Ghana: Palm Oil Production, 2013�2017
Table 120 Tanzania: Cottonseed Oil Production, 2014�2017
Table 121 Tanzania: Peanut Oil Production, 2014�2017 (MT)
Table 122 Rest of Africa: Market Size, By Edible Oil, 2016�2023 (USD Million)
Table 123 Top Five Companies in the Deodorization Systems Market, 2016
Table 124 New Product Launches and Developments, 2016�2017
Table 125 Investments and Partnerships, 2013-2015
List of Figures (61 Figures)
Figure 1 Deodorization Systems Market: Market Segmentation
Figure 2 Market: Geographic Segmentation
Figure 3 Research Design: Deodorization Systems
Figure 4 Market Size Estimation Methodology: Bottom-Up Approach
Figure 5 Market Size Estimation Methodology: Top-Down Approach
Figure 6 Data Triangulation Methodology
Figure 7 Market Snapshot, By Refining Method, 2018 vs 2023
Figure 8 Market Size, By Edible Oil, 2018�2023
Figure 9 Market Size, By Operation, 2018�2023
Figure 10 Market Size, By Technology, 2018�2023
Figure 11 Middle East & Africa to Grow at the Highest CAGR in the Deodorization Systems Market, 2018�2023
Figure 12 Market Share, By Region
Figure 13 Growing Industrialization & Rapid Urbanization to Drive the Growth of the Deodorization Systems Market
Figure 14 Africa to Be the Fastest-Growing Region in the Market By 2023
Figure 15 Towers Segment Dominated the Market in 2017
Figure 16 Developing Countries to Emerge at the Highest Growth Rates During the Forecast Period
Figure 17 Continuous Segment Dominated the Market Across All Operation Types
Figure 18 Chemical Refining Segment Dominated the Deodorization Systems Market Across All Methods
Figure 19 China Accounted for the Largest Share in 2017
Figure 20 Patent Insights
Figure 21 Market Dynamics: Deodorization Systems Market
Figure 22 Growing Population in Urban Areas (%)
Figure 23 Global Annual Growth Rate of Industries, 2012 - 2017 (%)
Figure 24 Global Edible Oil Consumption, 2013�2017 (MMT)
Figure 25 Deodorization Process Flow (Physical and Chemical)
Figure 26 Global Vegetable Oil Production, 2013�2018 (MMT)
Figure 27 US Total Energy Consumption, 2017
Figure 28 Southeast Asia GDP Growth, 2016�2018 (USD Billion)
Figure 29 Southeast Asia: Manufacturing Sector Share, By Country, 2016
Figure 30 China: Edible Oil Production and Consumption Market Share, 2016
Figure 31 Market Share (Value), By Component, 2017
Figure 32 Market, By Technology, 2018 vs 2023 (USD Million)
Figure 33 Market Size, By Refinery Method, 2018 vs 2023 (USD Million)
Figure 34 Physical and Chemical Refining: Process Flow
Figure 35 Global Edible Oil Production 2014�2018 (MMT)
Figure 36 Global Soybean Oil Production, 2017 (Tons)
Figure 37 Dual Temperature With Packed Column Continuous Deodorization System Process Flow
Figure 38 Market, By Operation, 2018�2023 (USD Million)
Figure 39 Batch Operation Process Flow
Figure 40 Semi Continuous Deodorization: Process Flow
Figure 41 Thermosiphon Heat Recovery in Semi-Continuous Deodorization Systems
Figure 42 Continuous Deodorization Systems: Process Flow
Figure 43 China Held the Largest Share in the Deodorization Systems Market in 2017
Figure 44 North America: Market Snapshot, 2017
Figure 45 Asia Pacific: Market Snapshot, 2017
Figure 46 Vegetable Oil Consumption in China
Figure 47 Vegetable Oil Production in China
Figure 48 Sub-Saharan Africa: Palm Oil Import Share From Malaysia (Volume), By Country, 2017
Figure 49 South Africa: Soybean Oil Production Figures, 2014�2017 (MT)
Figure 50 South Africa: Sunflower Oil Production, 2014�2017 (MT)
Figure 51 Ghana: Palm Oil Production, 2014�2017 (MT)
Figure 52 Tanzania: Cottonseed Oil Production, 2014�2017 (MT)
Figure 53 Tanzania: Peanut Oil Production Figures, 2014�2017
Figure 54 Key Developments of the Leading Players in the Deodorization Systems Market, 2013�2018
Figure 55 Market Evaluation Framework
Figure 56 Alfa Laval: Company Snapshot
Figure 57 Alfa Laval: SWOT Analysis
Figure 58 Desmet Ballestra: SWOT Analysis
Figure 59 Crown Iron Works: SWOT Analysis
Figure 60 Compro International: SWOT Analysis
Figure 61 Zhengzhou Sunshine Machinery Co. Ltd.: SWOT Analysis
The study involves four major activities to estimate the current market size of the deodorization systems market. Exhaustive secondary research was done to collect information on the market, peer market, and parent market. These findings, assumptions, and market sizes were validated with industry experts across the value chain through primary research. Both the top-down and bottom-up approaches were employed to estimate the complete market size. Thereafter, the market breakdown and data triangulation approaches were used to estimate the market size of segments and subsegments.
Secondary Research
In the secondary research process, various secondary sources have been referred to, so as to identify and collect information for this study. The secondary sources included annual reports, press releases, and investor presentations of companies offering deodorization equipment and deodorization solutions, white papers, certified publications, articles by recognized authors, regulatory bodies, trade directories, and databases, among other sources. Secondary research has mainly been used to obtain key information about the industry�s value chain and supply chain, the total pool of key players, market classification & segmentation according to industry trends to the bottom-most level, and geographical markets. It has also been used to obtain information on the key developments from a market-oriented perspective.
Primary Research
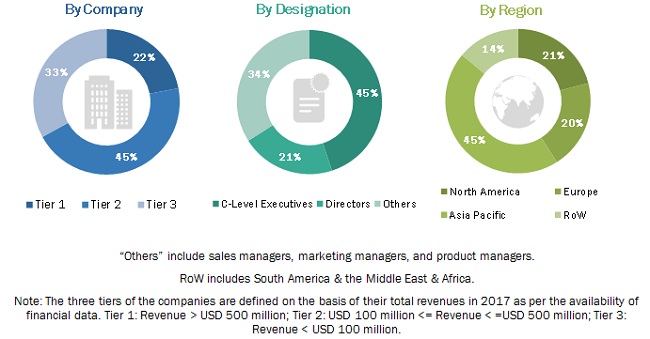
The deodorization systems market includes several stakeholders in the supply chain�suppliers, R&D institutes, and end-product manufacturers. The demand side of the market is characterized by the presence of importers/exporters, distributors, and manufacturers of food & beverage, petrochemicals, cosmetics, and chemicals. The supply side is characterized by the presence of key providers of deodorization systems. Various primary sources from the supply and demand sides of both markets have been interviewed to obtain qualitative and quantitative information. Following is the breakdown of primary respondents:
To know about the assumptions considered for the study, download the pdf brochure
Market Size Estimation
Both the top-down and bottom-up approaches were used to estimate and validate the total size of the deodorization systems market. These methods were also used extensively to estimate the size of various subsegments in the market. The research methodology used to estimate the market size includes the following:
- The key players in the industry and markets have been identified through extensive secondary research.
- The industry�s supply chain and market size, in terms of value, have been determined through primary and secondary research processes.
- All percentage shares, splits, and breakdowns have been determined using secondary sources and verified through primary sources.
- All the possible parameters that affect the markets covered in this research study have been accounted for, viewed in extensive detail, verified through primary research, and analyzed to obtain the final quantitative and qualitative data.
- The research included the study of reports, reviews, and newsletters of top market players, along with extensive interviews for opinions from leaders such as CEOs, directors, and marketing executives.
Data Triangulation
After arriving at the overall market size from the estimation process explained above, the total market has been split into several segments and subsegments. In order to complete the overall market engineering process and arrive at the exact statistics for all segments and subsegments, the data triangulation & market breakdown procedures have been employed wherever applicable. The data has been triangulated by studying various factors and trends from both, the demand- and supply-sides. Along with this, the market size has been validated using both, the top-down and bottom-up approaches.
Report Objectives
- Determining and projecting the size of the deodorization systems market, with respect to component, technology, seed oil, operation, type, refining method, and regional markets, over a five-year period, ranging from 2018 to 2023
- Identifying attractive opportunities in the market by determining the largest and fastest-growing segments across the key regions
- Identifying and profiling prominent market players in the market
- Providing a comparative analysis of the market leaders on the basis of the following:
- Product offerings
- Business strategies
- Strengths and weaknesses
- Key financials
- Understanding the competitive landscape and identifying key growth strategies adopted by the players across the key regions
- Analyzing the regulatory frameworks across regions and their impact on the prominent market players
- Providing insights on key innovations, and investments in technology
Scope of the report
|
Report Metric |
Details |
|
Market size available for years |
2016-2023 |
|
Base year considered |
2017 |
|
Forecast period |
2018-2023 |
|
Forecast units |
USD |
|
Segments covered |
Component, Technology, Refining Method, Edible Oil, Operation, and Region |
|
Geographies covered |
North America, Europe, Asia Pacific, South America, and Middle East & Africa |
|
Companies covered |
Alfa Laval AB (Sweden), Desmet Ballestra (Belgium), Crown Iron Works (US), Compro International (Canada), Zhengzhou Sunshine Machinery Co. Inc. (China), Luohe Zhonzhiyuan Grains & Oil Machinery Co. Inc (China), Myande Group (China), Goyum Screw Press Pvt. Ltd. (India), HUM Oil and Fat Technologies (Turkey), Andreotti Impianti S.p.A (Italy), DVC Process Technologists Pvt. Ltd. (India), and Gianazza International S.p.A. (Italy) |
This research report categorizes the market based on component, technology, refining method, seed oil, operation, and region.
On the basis of component, the deodorization systems market has been segmented as follows:
- Pumps
- Towers
- Coolers
- Oil and water management systems
- Tanks
- Others include polishing filters, vacuum deaerator, steam distribution cylinder, expansion joint, and PHV platelet exchanger
On the basis of technology, the deodorization systems market has been segmented as follows:
- Thin film
- Packed column
On the basis of refining method, the deodorization systems market has been segmented as follows:
- Physical refining
- Chemical refining
On the basis of edible oil, the deodorization systems market has been segmented as follows:
- Soybean oil
- Olive oil
- Peanut oil
- Rapeseed/ Canola oil
- Sunflower oil
- Palm kernel oil
- Cottonseed oil
- Coconut oil
- Palm oil
- Others include linseed, corn, and sesame oils
On the basis of operation, the deodorization systems market has been segmented as follows:
- Batch deodorization systems
- Semi-continuous systems
- Continuous deodorization systems
On the basis of region, the deodorization systems market has been segmented as follows:
- North America
- Europe
- Asia Pacific
- South America
- Middle East & Africa
Available Customizations
With the given market data, MarketsandMarkets offers customizations according to the company�s specific scientific needs.
The following customization options are available for the report:
Product Analysis
- Product matrix, which gives a detailed comparison of the product portfolio of each company
Segmental Analysis
- Further breakdown of deodorization systems techniques by applications
- Further breakdown of deodorization systems processes by applications
Geographic Analysis
- Further breakdown of the Rest of Asia Pacific deodorization systems market by countries
- Further breakdown of South American and African regions in the deodorization systems market, by their key countries
Company Information
- � Detailed analyses and profiling of additional market players (up to five)


Growth opportunities and latent adjacency in Deodorization Systems Market