
Distributed Control System Market

Distributed Control System Market by Component (Hardware, Software, Services), Application (Continuous, Batch-oriented), End-use industry (O&G, Power Generation, Chemical, F&B, Pharmaceuticals, Metal & Mining, Pulp & Paper), Region - Global Forecast to 2030


OVERVIEW
Source: Secondary Research, Interviews with Experts, MarketsandMarkets Analysis
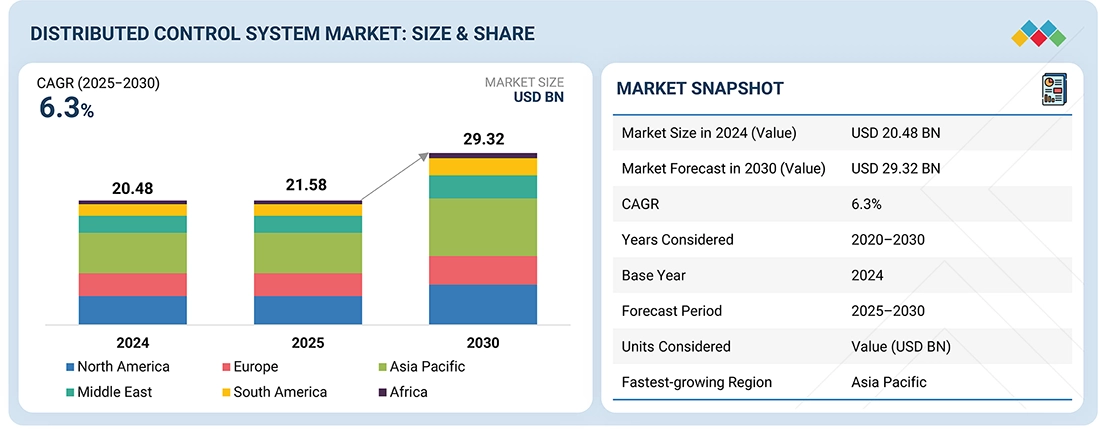
The global distributed control system market is expected to reach USD 29.32 billion by 2030 from USD 21.58 billion in 2025, with a CAGR of 6.3% during the forecast period. Rising worldwide demand for automation will lead to DCS technology becoming a more integral part of current and future industrial infrastructure and strategy.
Distributed Control System Market Size and Forecast:
- Market Size Value in 2024: USD 20.48 Billion
- Market Size Value in 2025: USD 21.58 Billion
- Revenue Forecast in 2030: USD 29.32 Billion
- Growth Rate: CAGR of 6.3% from 2025 to 2030
- Data available from 2020 to 2030
- The software segment holds the largest market share due to its cost-effectiveness, seamless upgradability, and increasing integration of AI and predictive analytics capabilities.
Key Market Trends and Insights
- Market Growth: Driven by rising demand for industrial automation, increasing focus on operational efficiency, and the growing need for real-time process monitoring across industries.
- Growing Trends: Integration of AI, Industrial IoT (IIoT), edge computing, cloud-based monitoring, and predictive maintenance capabilities is transforming traditional DCS platforms into intelligent control systems.
- Growth Opportunities: Expansion of digital transformation initiatives, modernization of legacy industrial infrastructure, and increasing investments in energy, chemicals, and water treatment facilities are creating significant market opportunities.
- Market Share Analysis: The software segment accounts for the largest market share in 2025 owing to its flexibility and ease of upgrades, while the oil & gas industry remains the leading end-user segment due to its complex, safety-critical, and continuous process operations.
KEY TAKEAWAYS
-
BY SHIPMENT SCALEDistributed control systems vary in scale depending on the plant's scale and complexity. Large-scale DCS systems are typical in oil and gas refineries, chemical plants, and power plants that manage multiple processes and thousands of I/O points. Medium-scale systems are used in industries like pharmaceuticals, food processing, and pulp and paper, while smaller setups are increasingly found in water treatment plants and compact industrial facilities where operational efficiency and reliability are essential.
-
BY COMPONENTThe software segment dominates the DCS market because of its cost-effectiveness, easy replacement, and seamless upgradability. Software components are quickly advancing with the integration of AI, predictive analytics, and cloud-based monitoring. Service offerings like maintenance, upgrades, and system integration are becoming more important as industries modernize legacy DCS platforms for improved connectivity and performance.
-
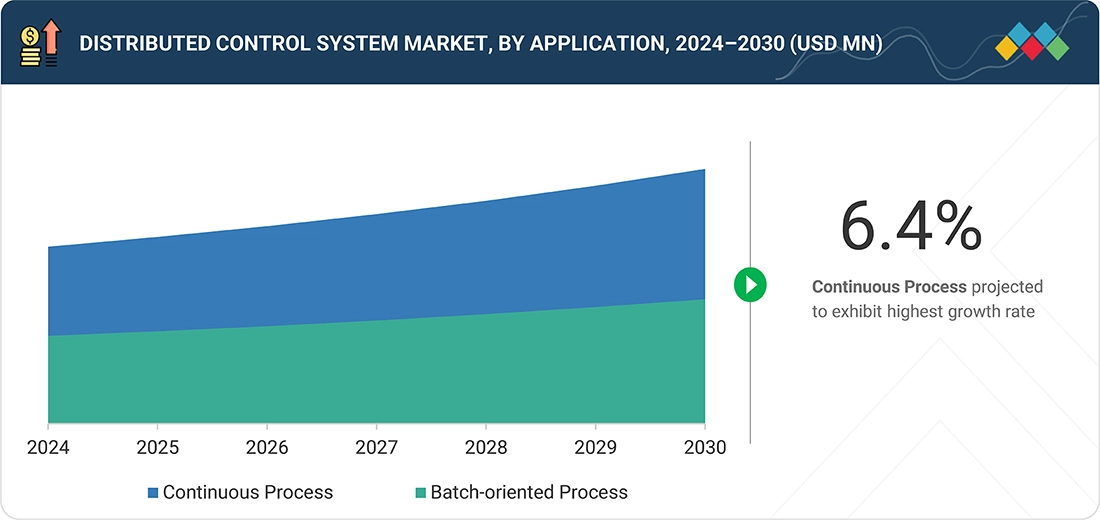
BY APPLICATIONMajor application areas include continuous and batch processes in oil & gas, power generation, chemicals, water treatment, and others. The increasing shift toward digital plants and predictive maintenance has accelerated DCS adoption, allowing operators to optimize performance, increase uptime, and improve process visibility across distributed assets.
-
BY END-USE INDUSTRYDCS solutions are increasingly adopted across industries seeking operational efficiency, reliability, and digital transformation. Oil & gas remain the primary end-user segment due to its complex, safety-critical operations. Power generation and chemical industries are also key users, utilizing DCS to manage large-scale continuous processes. Other sectors, such as pharmaceuticals, pulp & paper, and food processing, are adopting DCS to ensure quality control, sustainability, and energy efficiency.
-
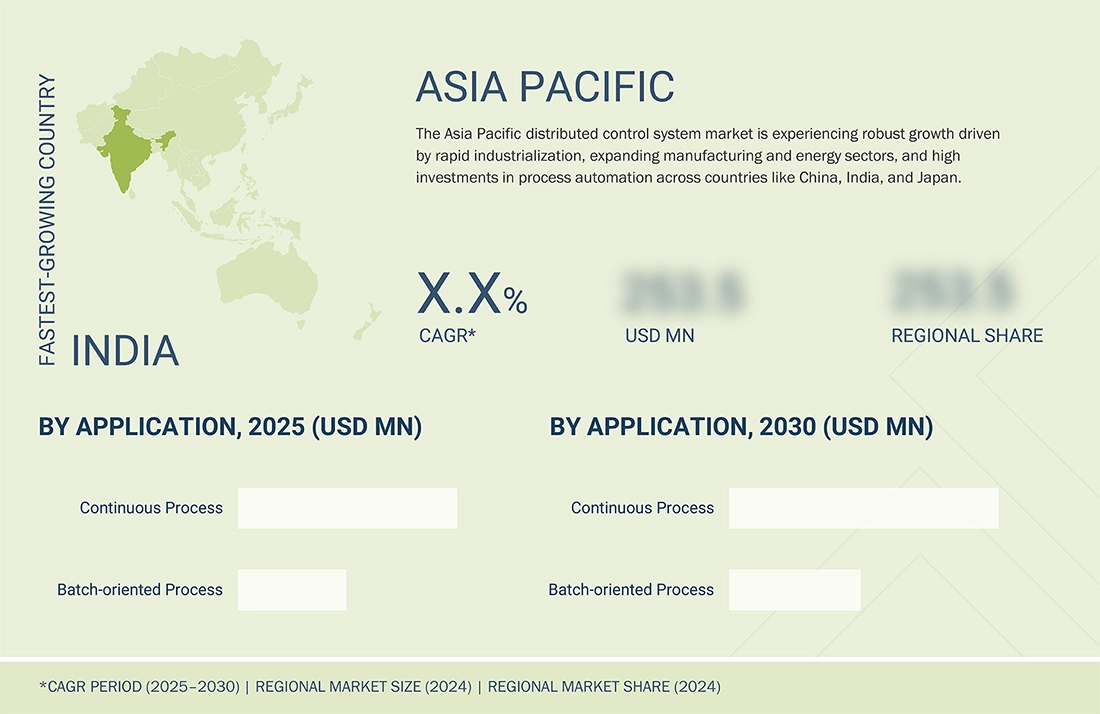
BY REGIONAsia Pacific is the fastest-growing region, driven by rapid industrialization, expansion of refineries, and growth in the power sector in countries such as China and India. North America and Europe are also markets that are growing due to strong industrial bases and high adoption of automation technologies. The Middle East focuses on DCS deployment in oil and gas, and petrochemical facilities, while Latin America is witnessing steady adoption through modernization of legacy plants and infrastructure projects.
-
COMPETITIVE LANDSCAPEMajor market players have utilized both organic and inorganic strategies, including forming partnerships and making investments. For example, ABB and Energy Control Technologies (ECT) collaborated to create an integrated turbomachinery control solution within the ABB Ability System 800xA Distributed Control System (DCS).
As the power and industrial sectors modernize, the potential for advanced distributed control systems (DCS) to be integrated into automation, process optimization, and digital transformation initiatives grows. DCS solutions that enable real-time monitoring, control, and data-driven decision-making offer higher operational value by improving process efficiency, enhancing safety, reducing downtime, and supporting sustainable industrial operations.
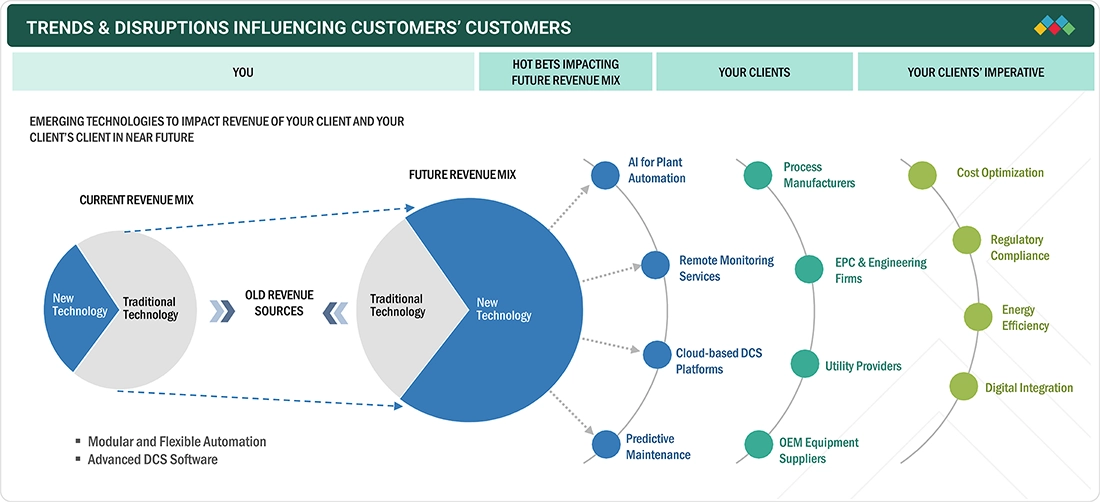
TRENDS & DISRUPTIONS IMPACTING CUSTOMERS' CUSTOMERS
The impact on consumers' business emerges from customer trends or disruptions. Process industries, manufacturing plants, and utilities are clients of DCS manufacturers, and industrial operators, EPCs, and end-user plants are clients of DCS manufacturers. Shifts such as the demand for real-time process control, scalability, interoperability, AI-driven fleet optimization, energy efficiency, and predictive maintenance will impact the revenues of end users. The revenue impact on end users will affect the revenue of process industries, manufacturing plants, and utilities, which will further affect the revenue of DCS manufacturers, software & analytics platforms, controllers, I/O modules, and continuous process DCS solution providers.
Source: Secondary Research, Interviews with Experts, MarketsandMarkets Analysis
MARKET DYNAMICS
Level
-
Mounting investments to expand power generation capacity

-
Increasing electricity generation using renewable energy sources

Level
-
Cyber risks and high degree of redundancy

-
Availability of low-cost alternatives

Level
-
Rising development of integrated grid networks

-
Mounting demand for distributed energy systems

Level
-
Reliance on outdated, legacy equipment vulnerable to cyber threats

-
Reduced oil production due to presence of alternative energy sources

Source: Secondary Research, Interviews with Experts, MarketsandMarkets Analysis
Driver: Increasing investments to expand power generation capacity
The increased investment in power generation capacity across different regions is a key factor driving the adoption of distributed control systems (DCS), according to the IEA Global Energy Review 2025. Regions like China, the US, and the European Union, which are leading in clean energy investment, are therefore seeing faster adoption of advanced automation and control technologies. By expanding power generation capacity, these regions address the need for operational efficiency and process control that support the use of distributed control systems (DCS). Solar power investments are growing, while spending on fossil fuels, especially oil, is decreasing. Investments related to electricity far exceed those in fossil fuels, indicating a major shift, but grid development is falling behind due to supply and permitting issues. China is the largest investor, while Africa receives only 2% of clean energy funding despite significant needs. Overall, momentum for clean energy remains strong, but regional and infrastructure gaps still exist.
Restraint: Cyber risks and high degree of redundancy
The integration of DCS with Internet-based IT and IIoT infrastructure has increased exposure to cyber risks. Historically, control systems were isolated and proprietary. Still, modern connectivity introduces potential entry points for attackers, posing dangers to critical infrastructure such as energy, water, and chemicals, especially due to limited use of encryption and segmentation. A distributed control system is a computerized system with many control loops, where autonomous controllers are distributed throughout the system. However, there is no central operator supervisory control, and the failure of one controller affects all interconnected loops in critical sectors like energy, water, and chemicals, leading to a high mean time between failures (MTBF) and a high degree of redundancy.
Opportunity: Rising development of integrated grid networks
The power grid market is undergoing rapid changes, creating opportunities for both established energy infrastructure vendors and new entrants. Emerging players—ranging from IT hardware providers and software developers to telecom, networking, semiconductor companies, and system integrators—are now entering the distributed control system (DCS) market, driving growth. Their presence is increasing competition for traditional suppliers. To compete effectively, these new entrants must adopt a service-oriented business model that combines products and services aligned with the core operational needs of end users. Offering value beyond standard solutions is crucial to standing out. By focusing on advanced features like scalable automation systems, real-time data analytics, and remote monitoring tools, newcomers can deliver compelling solutions that support the evolving demands of modern power infrastructure. These integrated, intelligent offerings not only improve operational efficiency but also attract customers looking for flexible, future-ready systems. As the market evolves, success will depend on the ability to deliver comprehensive solutions that merge technological innovation with reliable service, positioning new entrants as serious contenders in the competitive distributed control system landscape.
Challenge: Reliance on outdated, legacy equipment vulnerable to cyber threats
A major challenge for DCS is reliance on outdated, legacy equipment not designed with modern cybersecurity in mind. According to Schneider Electric, many plants still operate older DCS infrastructure with weak or nonexistent security protocols. These systems are highly vulnerable to cyber threats like malware, ransomware, or unauthorized access, as they lack built-in defenses and often run on unsupported platforms. This challenge requires costly retrofits, including adding firewalls, network segmentation, and updated authentication measures. However, even these security devices can cause communication latency or reliability issues. In some cases, the only truly effective solution may be to fully replace the legacy system, which is often financially or technically unfeasible. For example, the Iberian Peninsula blackout of May 2025 highlighted the vulnerability of outdated grids poorly equipped to handle renewable integration. A sudden loss of 2.2 GW of power in southern Spain caused a major frequency drop, leading to a full blackout across Spain and Portugal.
Distributed Control System: COMMERCIAL USE CASES ACROSS INDUSTRIES
| COMPANY | USE CASE DESCRIPTION | BENEFITS |
|---|---|---|
 |
Colombian oil and gas company adopts ABB’s modern freelance DCS platform to reduce downtime and boost cybersecurity | The company transitioned to ABB’s modern Freelance DCS platform, which delivered enhanced cyber protection, reduced downtime, and simplified maintenance procedures. The system supported remote diagnostics, lifecycle management, and seamless integration with existing infrastructure. The upgrade helped cut operational costs while aligning the facility with current security and regulatory standards and gave the flexibility to scale and integrate future digital tools with minimal disruption. |
 |
Food and beverage plant uses Rockwell Automation’s integrated control solutions to reduce waste and enhance production visibility | The plant implemented Rockwell Automation’s FactoryTalk Analytics and other integrated control solutions. This enabled real-time data collection, visualization, and actionable insights. As a result, the facility reduced waste by over USD 500,000, improved process efficiency, and enhanced production visibility. |
Logos and trademarks shown above are the property of their respective owners. Their use here is for informational and illustrative purposes only.
MARKET ECOSYSTEM
The distributed control system market ecosystem analysis shows the interconnections/adjacencies that affect the distributed control system market by showcasing MnM coverage of the market under study. It involves key players operating across different levels. Major Distributed control system manufacturers are Siemens (Germany), Schneider Electric (France), Honeywell International Inc. (US), Hitachi, Ltd. (Japan), and GE Vernova (US). Other ecosystem participants include component suppliers such as Bosch Rexroth (Germany), SR Systems (India), AMI (AmiTech India Pvt. Ltd.) (India), and Koyo Electronics Industries (Japan), along with system integrators and end users across industries like power, oil & gas, chemicals, and manufacturing.
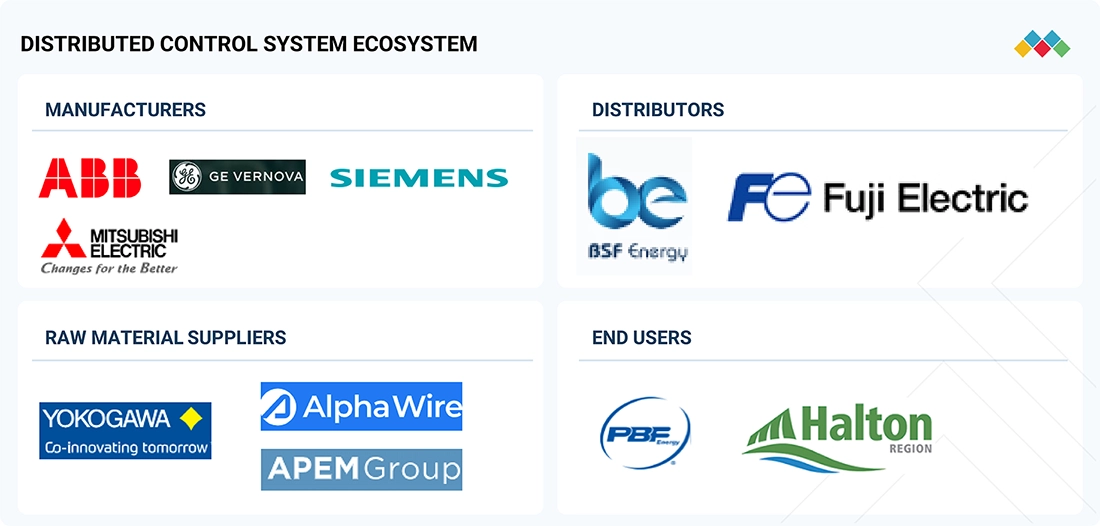
Logos and trademarks shown above are the property of their respective owners. Their use here is for informational and illustrative purposes only.
MARKET SEGMENTS
Source: Secondary Research, Interviews with Experts, MarketsandMarkets Analysis
Distributed Control System Market, By Component
The shift toward Industry 4.0 and widespread digital transformation is reshaping the services segment within industrial automation, especially for Distributed Control Systems (DCS). As plants become more connected and intelligent, the demand for expert services—including consulting, integration, maintenance, remote monitoring, and lifecycle management—is increasing rapidly. These services are essential for supporting the deployment, optimization, and ongoing development of complex automation systems. With the integration of IIoT, cloud computing, and cyber-physical infrastructure, service providers play a crucial role in ensuring seamless connectivity, secure data exchange, and operational stability. Advanced DCS services allow organizations to harness data more effectively, adopt predictive maintenance strategies, and maintain uptime through proactive diagnostics and real-time support. Additionally, service offerings are becoming more customized and responsive, enabling quick adaptation to changing production needs and market conditions. By partnering with specialized DCS service providers, companies gain access to industry expertise, operational insights, and continuous support that extend beyond initial implementation. This service-oriented approach empowers industries to improve performance, maximize returns on automation investments, and stay agile in a rapidly changing industrial landscape
Distributed Control System Market, By End-use Industry
Oil & gas remains the largest segment in the distributed control system (DCS) market because its operations—such as exploration, refining, and pipeline management—are highly complex, continuous, and safety-critical. These processes demand reliable, automated systems to monitor and control multiple units in real time, ensure safety, and reduce downtime. DCS offers centralized control, high reliability, and compliance with strict safety and environmental standards, making it vital for the oil and gas industry’s large-scale and continuous production. Additionally, the industry’s significant investments in automation, focus on operational efficiency, and push toward digitalization further promote DCS adoption. Advanced DCS solutions help optimize production, conserve energy, and forecast maintenance needs. As demand for oil and gas grows and refineries modernize, reliance on DCS continues to increase, cementing its dominance in this market.
REGION
Asia Pacific to be the largest market of Distributed control system market
Strong government regulations across the Asia Pacific region, particularly in China, India, and Japan, are boosting clean energy deployment and carbon reduction strategies. These policies include various tools like subsidies, tax incentives, renewable energy mandates, and ambitious national targets. For example, China has committed to carbon neutrality by 2060, while India aims for 500 GW of non-fossil fuel capacity by 2030. These efforts are driving large investments in solar farms, wind parks, hydroelectric projects, and other low-carbon energy assets. In this changing energy landscape, distributed control systems enable precise automation, real-time data monitoring, predictive diagnostics, and optimized process control. This improves the efficiency and reliability of renewable energy operations. From balancing variable loads to managing decentralized assets and integrating energy storage systems, DCS solutions form the essential technology backbone needed to meet operational and environmental goals. As countries across Asia Pacific work to achieve their sustainability targets, adopting DCS becomes increasingly vital for smarter grid management, better system resilience, and greater carbon reductions.
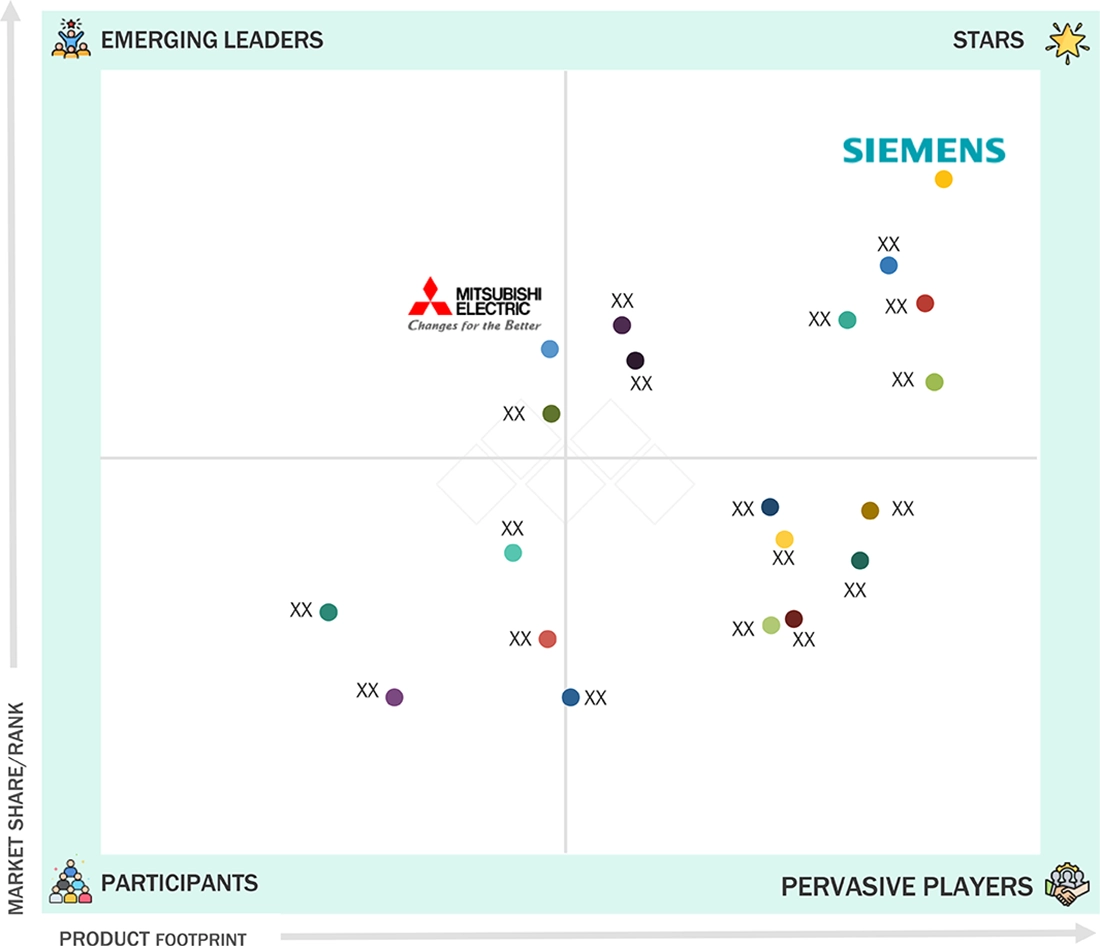
Distributed Control System: COMPANY EVALUATION MATRIX
In the distributed control system market matrix, Siemens leads with a strong market presence and wide product portfolio, driving adoption across industries like grid management and power generation.
Source: Secondary Research, Interviews with Experts, MarketsandMarkets Analysis
KEY MARKET PLAYERS
MARKET SCOPE
| REPORT METRIC | DETAILS |
|---|---|
| Market Size, 2024 (Value) | USD 20.48 BN |
| Market Forecast, 2030 (Value) | USD 29.32 BN |
| Growth Rate | CAGR of 6.3% from 2025-2030 |
| Years Considered | 2020-2030 |
| Base Year | 2024 |
| Forecast Period | 2030 |
| Units Considered | Value (USD Billion/Million) |
| Report Coverage | Revenue forecast, company ranking, competitive landscape, growth factors, and trends |
| Segments Covered |
|
| Regional Scope | Europe, Asia Pacific, North America, South America, Middle East, and Africa |
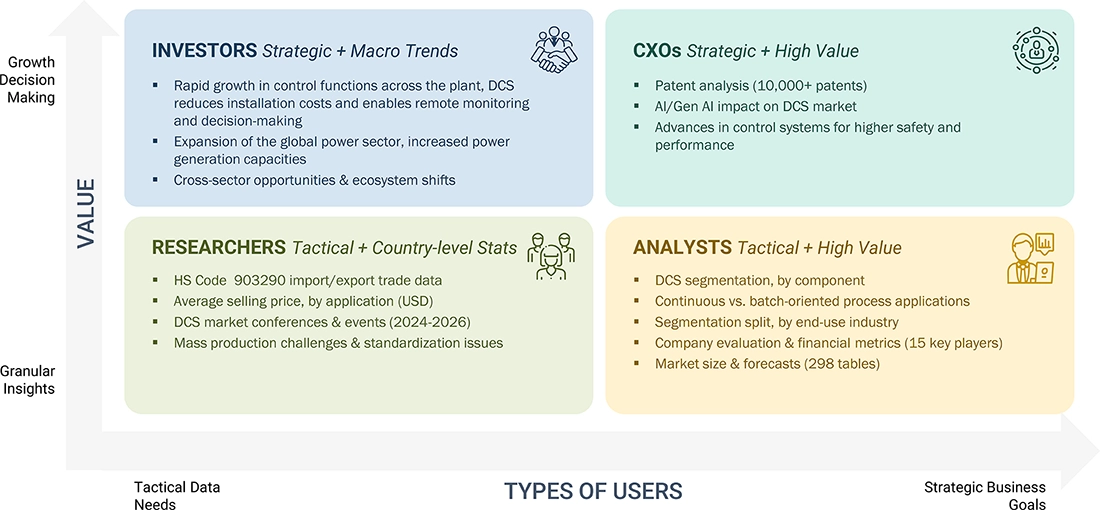
WHAT IS IN IT FOR YOU: Distributed Control System REPORT CONTENT GUIDE
DELIVERED CUSTOMIZATIONS
We have successfully delivered the following deep-dive customizations:
| CLIENT REQUEST | CUSTOMIZATION DELIVERED | VALUE ADDS |
|---|---|---|
| Distributed Control System Market Competitors | Competitor analysis of a total of 25 companies in the distributed control system market | Provided few more companies for distributed control system market |
RECENT DEVELOPMENTS
- April 2025 : Emerson introduced a new edge device called DeltaV SaaS SCADA with Edge Connect that simplifies connecting field devices to the cloud. It enables users to quickly and securely monitor and control equipment without requiring complex setup or additional hardware.
- February 2025 : Valmet secured a contract to supply its DNAe Distributed Control System (DCS), along with mill-wide automation infrastructure and pulp dryer control, for Mercer International Inc.’s Peace River pulp mill in Alberta as part of an ongoing digital modernization effort.
- October 2024 : Honeywell International Inc. partnered with Chevron Corporation to incorporate AI into refining processes. Chevron’s operators will also be able to integrate AI into Honeywell’s Experion distributed control system (DCS).
- September 2024 : ABB and Energy Control Technologies (ECT) partnered to develop an integrated turbomachinery control solution within the ABB Ability System 800xA Distributed Control System (DCS). It combines ECT’s compressor control with ABB’s platform, removing the need for separate controllers and making wiring, engineering, and operations simpler.
- June 2024 : Rockwell Automation secured a contract from Multicom Resources to supply its PlantPAx Distributed Control System for a critical minerals research plant in Queensland. The contract includes system delivery, engineering, and commissioning support.
Table of Contents
 Exclusive indicates content/data unique to MarketsandMarkets and not available with any competitors.
Methodology
The study involved major activities in estimating the current size of the distributed control system market. Exhaustive secondary research was done to collect information on the peer and parent markets. The next step was to validate these findings, assumptions, and sizing with industry experts across the value chain through primary research. Both top-down and bottom-up approaches were employed to estimate the complete market size. Thereafter, market breakdown and data triangulation were used to estimate the market size of the segments and subsegments.
Secondary Research
This research study on the distributed control system market involved the use of extensive secondary sources, directories, and databases, such as Hoovers, Bloomberg, Businessweek, Factiva, International Energy Agency, and BP Statistical Review of World Energy, to identify and collect information useful for a technical, market-oriented, and commercial study of the global distributed control system market. The other secondary sources included annual reports, press releases, investor presentations of companies, white papers, certified publications, articles by recognized authors, manufacturer associations, trade directories, and databases.
Primary Research
The distributed control system market comprises stakeholders such as distributed control system manufacturers, technology providers, and support providers in the supply chain. The demand side of this market is characterized by the rising demand for enhanced automation, real-time monitoring, and improved operational efficiency across process industries, including power, chemicals, and oil & gas. The supply side is characterized by the rising demand for integrated systems supporting sustainability goals, energy efficiency, advanced control infrastructure, and mergers & acquisitions among big players. Various primary sources from the supply and demand sides of the market were interviewed to obtain qualitative and quantitative information. The following is the breakdown of primary respondents:

Note: “Others” include sales managers, engineers, and regional managers
The tiers of the companies are defined based on their total revenue as of 2024: Tier 1: >USD 1 billion, Tier 2: USD 500 million–1 billion, and Tier 3:
To know about the assumptions considered for the study, download the pdf brochure
Market Size Estimation
Both the top-down and bottom-up approaches were used to estimate and validate the size of the distributed control system market. These methods were also used extensively to estimate the size of various subsegments in the market. The research methodology used to estimate the market size includes the following.
Distributed Control System Market : Top-Down and Bottom-Up Approach

Data Triangulation
The total market was split into several segments and subsegments after arriving at the overall market size from the above estimation process. Data triangulation and market breakdown processes were employed to complete the overall market engineering process and arrive at the exact statistics for all the segments and subsegments, wherever applicable. The data was triangulated by studying various factors and trends from the demand and supply sides. In addition, the market size was validated using the top-down and bottom-up approaches.
Market Definition
A distributed control system (DCS) is an industrial automation solution widely utilized in process industries to enable plant-wide control via a decentralized network of supervisory and control units. It is commonly applied in sectors such as food & beverages, pharmaceuticals, and petrochemicals, where production involves continuous or complex batch-based processes. The market for distributed control systems is defined as the sum of revenues that the global companies generate through the sales of their distributed control systems. The scope of the current study includes the bifurcation of the distributed control system market by component, application, end-use industry, and region.
Stakeholders
- DCS manufacturers and suppliers
- Solution vendors
- Original equipment manufacturers (OEMs)
- Government agencies
- Managed service providers (MSPs)
- System integrators
- Consultancy firms/advisory firms
- Investors and venture capitalists
- Independent software vendors
- Existing and prospective end-use industries
- Government and research organizations
Report Objectives
- To define, describe, segment, and forecast the distributed control system market, by component, application, end-use industry, and region, in terms of value
- To forecast the market sizes for six major regions, namely North America, Europe, Asia Pacific, South America, the Middle East, and Africa, along with their key countries, in terms of value
- To provide detailed information regarding key drivers, restraints, opportunities, and challenges influencing the growth of the distributed control system market
- To provide the supply chain analysis, trends/disruptions impacting customer business, ecosystem analysis, regulatory landscape, patent analysis, case study analysis, technology analysis, key conferences & events, the impact of AI/Gen AI, macroeconomic outlook, pricing analysis, porter’s five forces analysis, and regulatory analysis, the impact of 2025 US tariff on the market
- To analyze opportunities for stakeholders in the distributed control system market and draw a competitive landscape of the market
- To benchmark market players using the company evaluation matrix, which analyzes market players on broad categories of business and product strategies adopted by them
- To compare key market players for the market share, product specifications, and applications
- To strategically profile key players and comprehensively analyze their market ranking and core competencies.
- To analyze competitive developments, such as contracts, agreements, partnerships, and product launches, in the distributed control system market
Available Customizations
MarketsandMarkets offers customizations according to the specific needs of the companies using the given market data.
The following customization options are available for the report:
Product Analysis
- Product matrix, which gives a detailed comparison of the product portfolio of each company
Geographic Analysis as per Feasibility
- Further breakdown of the distributed control system, by country
Company Information
- Detailed analysis and profiling of additional market players (up to five)
Key Questions Addressed by the Report
What was the size of the distributed control system market in 2024?
The distributed control system market was worth USD 20.48 billion in 2024.
What are the major drivers for the distributed control system market?
Increasing global energy consumption and the need for efficient power generation are expected to drive the market.
What will be the biggest market for distributed control systems during the forecast period?
Asia Pacific is estimated to dominate the distributed control system market during the forecast period.
Which will be the largest segment, by component, in the distributed control system market during the forecast period?
The software segment is likely to account for the largest market share during the forecast period.
What will be the fastest-growing segment, by application, in the distributed control system market during the forecast period?
The continuous process segment is projected to register the highest CAGR during the forecast period.
Need a Tailored Report?
Customize this report to your needs
Get 10% FREE Customization
Customize This ReportPersonalize This Research
- Triangulate with your Own Data
- Get Data as per your Format and Definition
- Gain a Deeper Dive on a Specific Application, Geography, Customer or Competitor
- Any level of Personalization
Let Us Help You
- What are the Known and Unknown Adjacencies Impacting the Distributed Control System Market
- What will your New Revenue Sources be?
- Who will be your Top Customer; what will make them switch?
- Defend your Market Share or Win Competitors
- Get a Scorecard for Target Partners

Custom Market Research Services
We Will Customise The Research For You, In Case The Report Listed Above Does Not Meet With Your Requirements
Get 10% Free CustomisationTESTIMONIALS

Kimberly Murphy
GLOBAL MARKETING DIRECTOR
Bently Nevada,
Leading Condition Monitoring & Asset Protectionwww.bakerhughesds.com/bently-nevada

MarketsandMarkets™ showed consistent rigor for success and relentlessly worked with Bently Nevada stakeholders to positively impact go-to-market strategy. Their proactiveness and flexibility has been instrumental in achieving the objectives to grow our sales pipeline in key industrial markets.

DARRICK HUEBER
Business Development Leader
Nexus Controls LLC,
Leading Manufacturer of Automation System & Electrical Panelswww.bakerhughesds.com/nexus-controls

We partnered with MarketsandMarkets to expand our business further by tapping into new industrial segments. It was critical for us to gather crucial business insights about specific markets to achieve this goal. MarketsandMarkets engagement model and client services helped us provide those insights, it was really impressive and valuable for my business. The team was extremely flexible and helpful.

Mike Schoff
Global Industrial Commercial Strategy Leader
Nexus Controls LLC
Leading Manufacturer of Automation System & Electrical Panelswww.bakerhughesds.com/nexus-controls
We consulted MarketsandMarkets for potential Partner Identification. Overall, it was a good experience. The insights provided through interviews conducted by the team helped us put together the questionnaire required for discussion with the selected partners. Their ability to provide insights through interviews with customers in a timely manner was quite impressive.


Growth opportunities and latent adjacency in Distributed Control System Market