
Industrial Services Market Size, Share & Trends

Industrial Services Market Size, Share, Growth & Trends by SCADA, DCS, MES, Robotics, PLC, Safety System, Industrial PC, 3D Printing, Motor & Drive, PLC, HMI, Service Type (Engineering & Consulting, Installation & Commissioning, Improvement & Maintenance) - Global Forecast to 2030


Industrial Services Market Size, Share &Trends
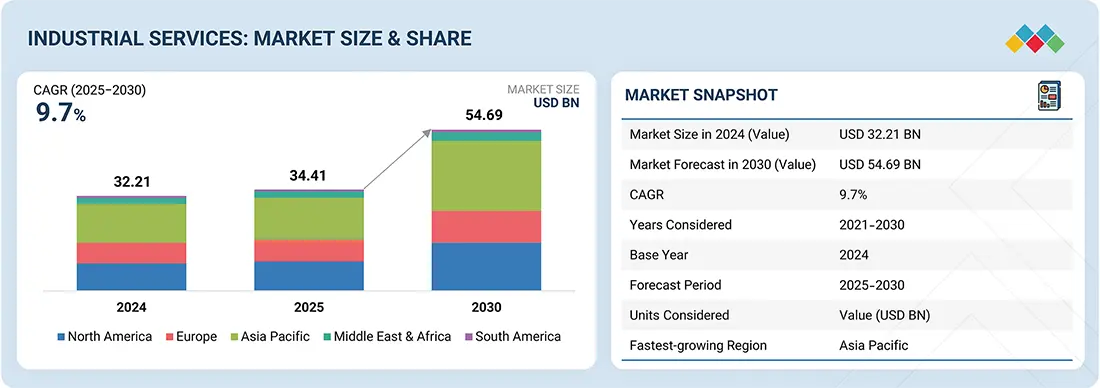
According to Marketsandmarkets, the global industrial services market size was valued at USD 34.41 billion in 2025 and is projected to reach USD 54.69 billion by 2030, growing at a 9.7% from 2025 to 2030. Industrial services cover engineering and consulting, installation and commissioning, and operational improvement and maintenance. These services support industries in setting up systems, ensuring smooth operation, and enhancing efficiency. They help businesses reduce downtime, optimize resources, and maintain long-term performance, enabling sustainable industrial growth and reliable operations across sectors.
MARKET SNAPSHOT TABLE
| REPORT METRIC | DETAILS |
|---|---|
| Market Size in 2025 (Value) | USD 34.41 Billion |
| Market Forecast in 2030 (Value) | USD 54.69 Billion |
| Growth Rate | CAGR of 9.7% from 2025–2030 |
| Years Considered | 2021–2030 |
| Base Year | 2024 |
| Forecast Period | 2025–2030 |
| Units Considered | Value (USD Million) |
| Report Coverage | Revenue forecast, company ranking, competitive landscape, growth factors, and trends |
| Segments Covered |
|
| Regions Covered | North America, Europe, Asia Pacific, the Middle East & Africa, and South America |
| Top Companies |
|
| Growth Drivers |
|
Market Size & Forecast
KEY TAKEAWAYS
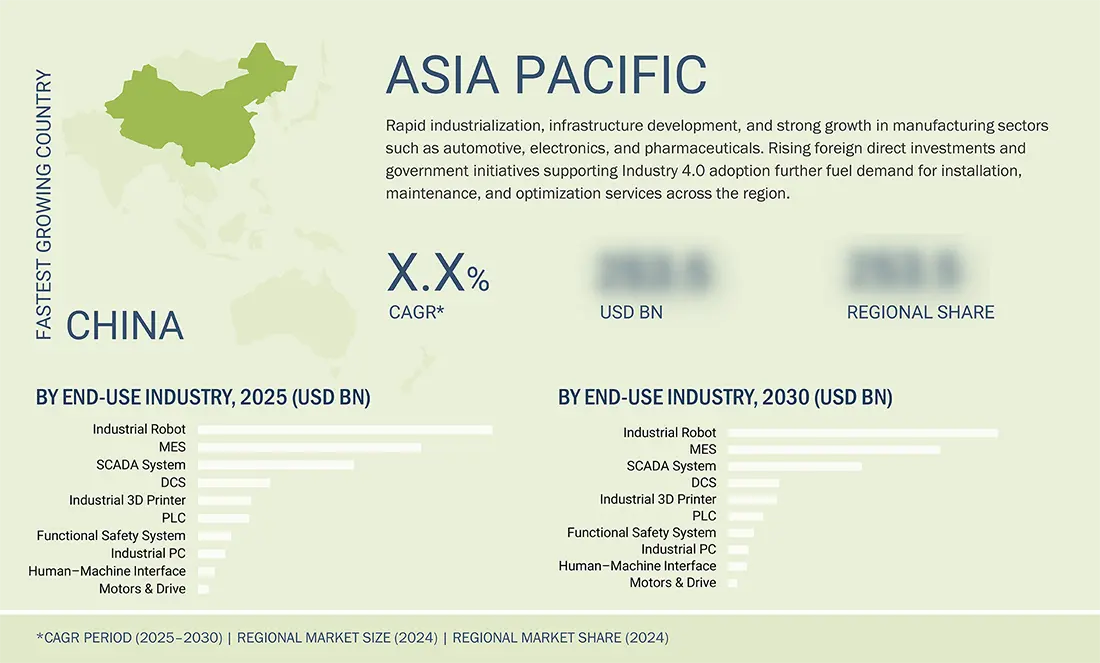
- Asia Pacific is expected to grow fastest, with a CAGR of 10.6% during the forecast period.
- By service type, the operational improvement & maintenance segment held the highest market share in 2024.
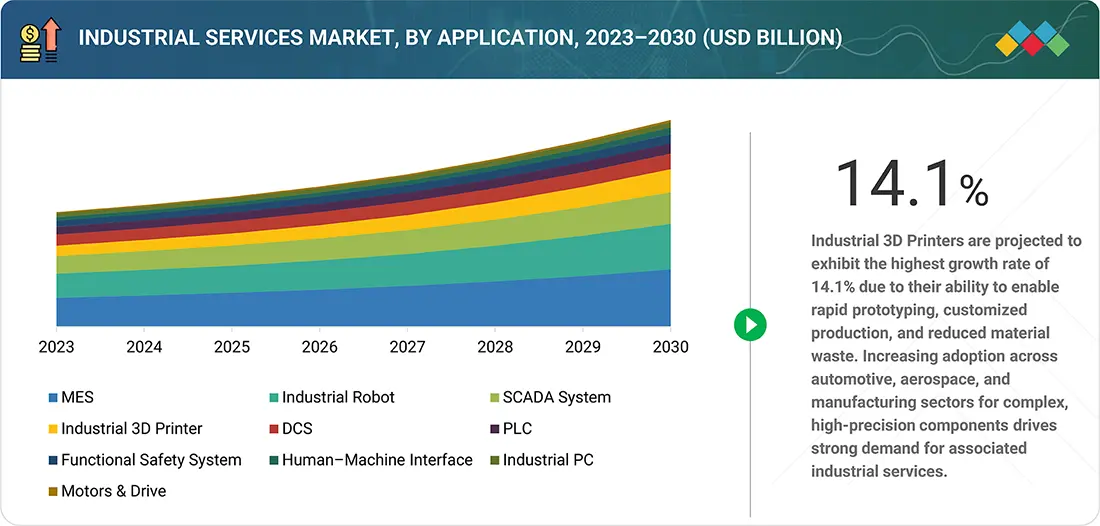
- By application, the industrial 3D printer segment is expected to grow at the highest CAGR of 14.1%, during the forecast period.
- By the end-use Industry, the automotive industry accounted for the largest share of 17.4% in 2024.
- ABB, Schneider Electric, and Siemens were identified as some of the Star players in the exoskeleton market owing to their strong service portfolio, a wide market presence, and effective business strategies.
- Industrial Analytics, Bright Machines, and Uptake Technologies have distinguished themselves among startups and SMEs due to their strong product portfolio and business strategies.
The industrial services market size is projected to grow rapidly over the next decade, driven by rising demand for operational efficiency, sustainability, and advanced automation across industries. Industrial facilities rely on engineering, installation, and maintenance services to ensure reliability, optimize performance, and meet evolving regulatory standards. Digitalization and smart technologies are further shaping this growth
Source: Secondary Research, Interviews with Experts, MarketsandMarkets Analysis
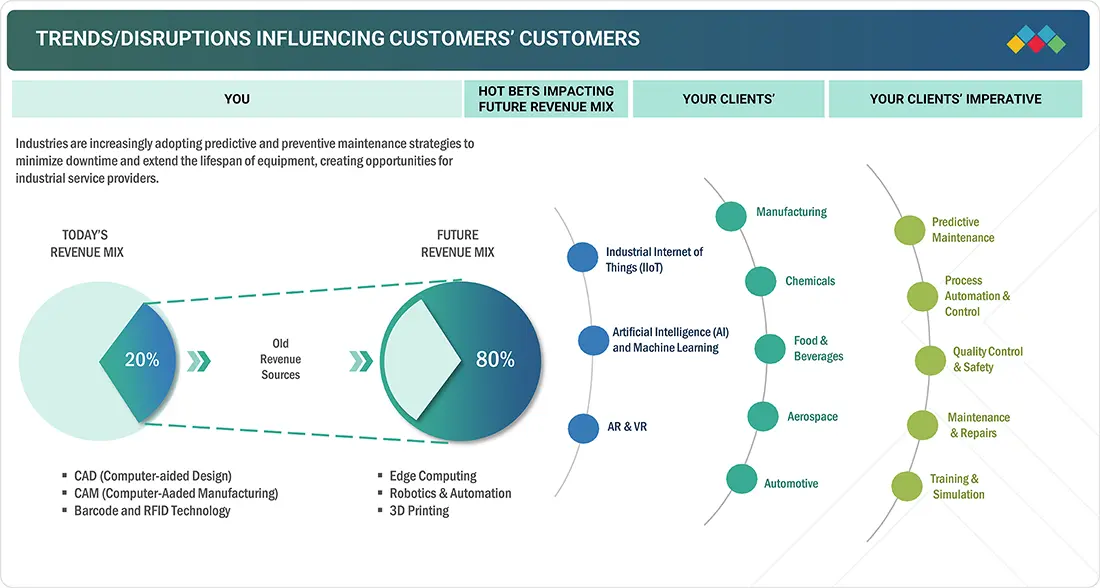
TRENDS & DISRUPTIONS IMPACTING CUSTOMERS' CUSTOMERS
Customer trends and disruptions are reshaping industrial services. The Industrial Internet of Things (IIoT) is transforming service delivery, enabling cloud connectivity, predictive maintenance, and remote monitoring. Service providers can use real-time data to improve diagnostics, reduce downtime, and enhance asset performance, helping industries achieve higher efficiency and cost savings
Source: Secondary Research, Interviews with Experts, MarketsandMarkets Analysis
MARKET DYNAMICS
Level
-
Increasing adoption of Industry 4.0 technology

-
Booming manufacturing sector worldwide

Level
-
High capital barriers and delayed returns

-
Shortage of skilled workforce

Level
-
Global shift toward sustainability, energy efficiency, and emission reduction

-
Rising focus on strengthening digital security frameworks

Level
-
Obsolescence risks stemming from rapid technological advancements

-
Intensely competitive market landscape

Source: Secondary Research, Interviews with Experts, MarketsandMarkets Analysis
Driver: Increasing Adoption of Industry 4.0 Technology
The industrial services market trends is growing with the adoption of Industry 4.0, integrating IoT, AI, big data, and automation to enhance efficiency and productivity. Real-time monitoring enables predictive maintenance, reducing downtime and costs. Service providers deliver consulting, maintenance, data analytics, and cybersecurity to support interconnected systems. Recent investments, such as Siemens’ smart factory in the US and Tata Group’s Industry 4.0 training initiatives in India, highlight rising demand for advanced industrial services
Restraint: High Capital Barriers and Delayed Returns
The adoption of advanced automation and Industry 4.0 technologies requires high upfront capital, creating barriers for many businesses and new entrants. Significant costs for equipment, software, and skilled personnel, combined with long payback periods, discourage investment. Firms risk financial strain if returns are delayed or lower than expected. Businesses unable to absorb these expenses face competitive disadvantages, missing efficiency gains and innovation opportunities available to better-capitalized competitors.
Opportunity: Global Shift Toward Sustainability, Energy Efficiency, and Emission Reduction
The global shift toward sustainability is driving demand for industrial services that enhance energy efficiency and reduce emissions. Rising energy costs, regulatory pressures, and investor expectations push businesses to adopt efficient technologies. Industrial service providers support this transition through energy audits, IoT-enabled monitoring, and solutions like LED lighting and advanced HVAC. Incentives and rapid ROI strengthen adoption, positioning providers as key partners in helping organizations achieve cost savings, compliance, and environmental goals.
Challenge: Obsolescence Risks Stemming from Rapid Technological Advancements
Rapid advancements in automation, IoT, and data analytics shorten the lifecycle of industrial technologies, creating obsolescence risks. Businesses must frequently upgrade systems to remain competitive, driving higher operational costs and integration challenges. Outdated technologies often cause interoperability issues, inefficiencies, and downtime, disrupting processes. For firms with heavy past investments, replacing obsolete equipment can be financially burdensome, leading to hesitancy in adoption and potential competitive disadvantages in efficiency and innovation.
Industrial Services Market Share: COMMERCIAL USE CASES ACROSS INDUSTRIES
| COMPANY | USE CASE DESCRIPTION | BENEFITS |
|---|---|---|
|
|
ABB provided comprehensive digital transformation services to an India-based cement manufacturer, implementing ABB Ability Advanced Digital Services suite. | ABB's digital services enabled the operator to reduce standard quality deviation by 15% and reduce operating costs by 3-5% across deployed sites. |
|
|
Schneider Electric partnered with Nestlé to implement EcoStruxure Clean-in-Place Advisor, providing an all-in-one sustainable solution to reduce downtime for cleaning processes. | The implementation resulted in 20% decrease in production downtime during CIP cycles and 340 tons of CO2 reduction in the first year. |
|
|
General Electric provided comprehensive industrial services including condition-based monitoring and predictive maintenance to BP for their vast array of critical equipment and machinery in exploration, production, and refining processes. | BP achieved proactive maintenance scheduling, prevention of unexpected equipment failures, and improved equipment reliability. |
|
|
Rockwell Automation designed and implemented customized automation solutions for Procter & Gamble's diverse consumer goods production requirements. The comprehensive solution included programmable logic controllers (PLCs), HMI solutions, advanced quality control systems, and predictive maintenance services utilizing data-driven insights to anticipate equipment issues. | P&G realized significantly reduced unplanned downtime, streamlined and cost-effective production processes, and enhanced production efficiency and flexibility. The predictive maintenance approach enabled proactive equipment management, consistent product quality, and improved adaptability to changing consumer demands. |
|
|
Siemens provided integrated building automation and HVAC optimization services for commercial and industrial facilities, implementing IoT-enabled systems for temperature control, air quality management, and energy efficiency optimization. | Clients achieved 15-30% energy cost reduction, improved indoor air quality and comfort, automated facility management, and predictive maintenance for HVAC systems. |
Logos and trademarks shown above are the property of their respective owners. Their use here is for informational and illustrative purposes only.
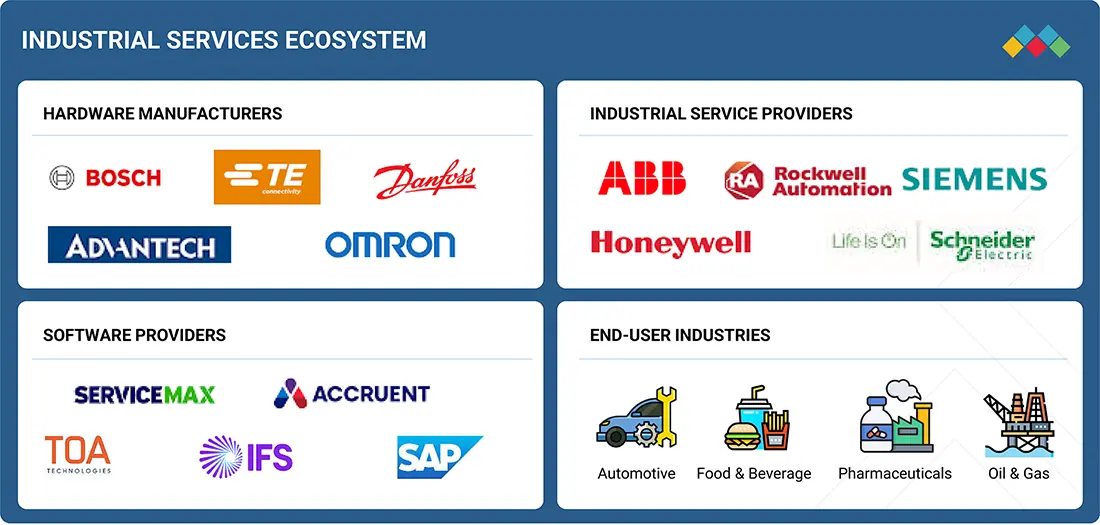
MARKET ECOSYSTEM
The industrial services ecosystem comprises hardware manufacturers, software providers, industrial service providers, and end-use industries. This integrated network supports diverse sectors, including automotive, food and beverages, pharmaceuticals, and oil and gas, delivering comprehensive solutions from equipment manufacturing and software development to system integration and maintenance services across industrial applications.
Logos and trademarks shown above are the property of their respective owners. Their use here is for informational and illustrative purposes only.
MARKET SEGMENTS
Source: Secondary Research, Interviews with Experts, MarketsandMarkets Analysis
Industrial Services Market, By Application
MES is set to lead the market, given its vital role in smart manufacturing and digital transformation. MES bridges enterprise planning with shop-floor execution, delivering real-time visibility, traceability, and control. By enhancing productivity, reducing downtime, and ensuring compliance, MES drives efficiency. The adoption of Industry 4.0 and demand for data-driven decision-making further accelerate MES deployment, creating strong demand for industrial services that support integration, optimization, and long-term operational agility.
Industrial Services Market, By End-user Industry
By 2030, the automotive industry is projected to lead the industrial services market, driven by the increasing complexity of vehicles with advanced electronics, sensors, and software. This growth boosts demand for specialized diagnostics, maintenance, and system upgrades. Additionally, the expanding global automotive aftermarket, aging fleets, and repair needs fuel demand for efficient services. Industrial services enhance production efficiency, support regulatory compliance, and enable ongoing optimization of manufacturing and maintenance processes across automotive facilities.
Industrial Services Market, By Service Type
Operational improvement and maintenance services are projected to dominate the industrial services market, driven by their role in sustaining efficiency, reliability, and productivity. With the rising adoption of IoT, AI, and automation, industries require continuous monitoring, timely maintenance, and optimization. These services minimize downtime, extend equipment life, and support seamless technology integration. Additionally, the push for standardized practices across global facilities enhances demand, making them vital for long-term operational excellence and proactive risk management.
REGION
Asia Pacific is expected to be the fastest-growing region in the global Industrial Services market during the forecast period.
The Asia Pacific region held the largest share of the industrial services market in 2024 and is expected to remain the fastest-growing region during the forecast period. Rapid industrialization, urbanization, and infrastructure expansion across emerging economies drive this growth, with countries like China, India, Vietnam, and Indonesia experiencing significant developments in manufacturing sectors such as automotive, electronics, and pharmaceuticals. Rising foreign direct investment further fuels demand for specialized industrial services, including installation, maintenance, process optimization, and facility management. The focus on operational efficiency, regulatory compliance, and support for large-scale industrial projects positions the Asia Pacific as a strategic hub for industrial services growth.
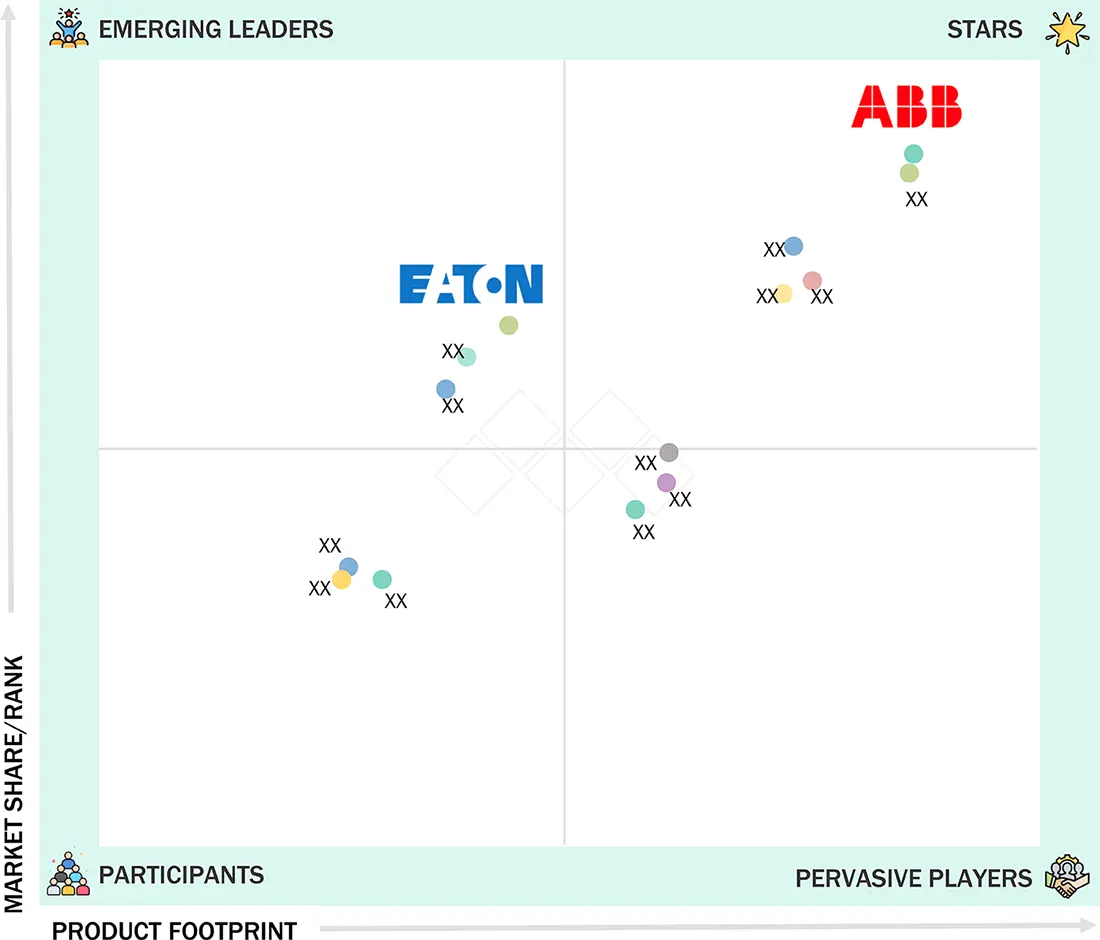
Industrial Services Market Growth: COMPANY EVALUATION MATRIX
In the industrial services market matrix, ABB (Star) leads with a strong market presence and a comprehensive service portfolio, enabling widespread adoption across industries such as automotive, manufacturing, and energy. Eaton (Emerging Leader) is gaining momentum by expanding its offers in operational improvement, maintenance, and automation services, positioning itself as a growing player in the industrial services landscape
Source: Secondary Research, Interviews with Experts, MarketsandMarkets Analysis
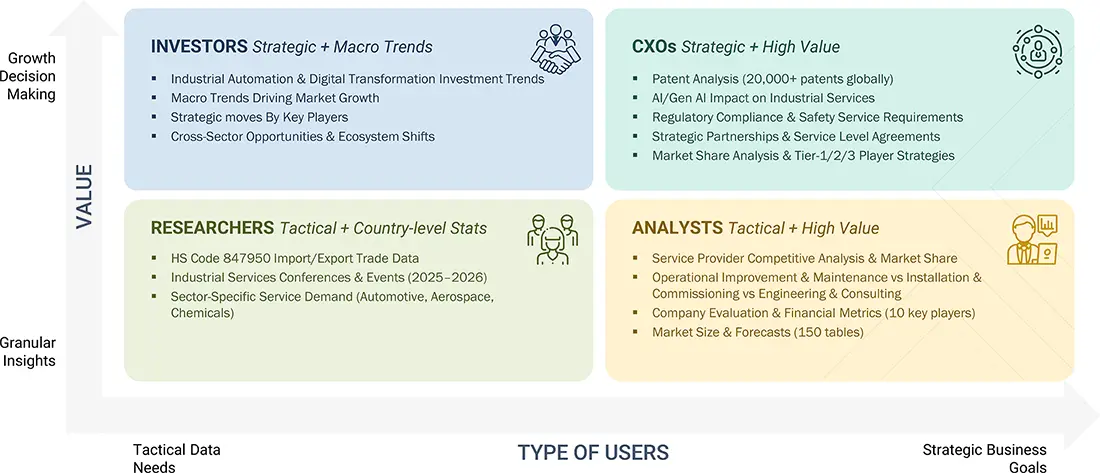
WHAT IS IN IT FOR YOU: Industrial Services Market Share REPORT CONTENT GUIDE
DELIVERED CUSTOMIZATIONS
We have successfully delivered the following deep-dive customizations:
| CLIENT REQUEST | CUSTOMIZATION DELIVERED | VALUE ADDS |
|---|---|---|
| US-based Manufacturing Services Provider |
|
|
| Cybersecurity Services Startup |
|
|
| APAC-based Industrial Service Providers |
|
|
RECENT DEVELOPMENTS
- July 2025 : ABB signed a 15-year fleet service agreement with the Royal Caribbean Group to provide preventive maintenance and digital solutions for 33 ships equipped with Azipod propulsion. The agreement aims to enhance vessel efficiency, safety, and availability and support long-term collaboration on maritime decarbonization.
- June 2025 : GE Vernova signed an agreement with Çalik Renewables to supply, service, and commission 12 of its 6.1 MW-158 m onshore wind turbines for the Zatriq I & II Wind Farms in Kosovo. Scheduled for delivery starting late 2025, the project supports Kosovo's renewable energy goals and is expected to power around 32,000 households upon completion.
- May 2025 : ABB introduced Battery Energy Storage Systems-as-a-Service (BESS-as-a-Service), a zero-CapEx solution that enables businesses to adopt energy storage without upfront investment. This includes full hardware, software, and lifecycle support, helping companies improve energy efficiency, resilience, and sustainability with guaranteed performance and returns.
- April 2024 : Rockwell Automation launched Security Monitoring and Response, a 24/7 managed service that delivers real-time threat detection, expert incident response, and continuous monitoring for operational technology (OT) environments. Enabled by Rockwell's OT Security Operations Center, the service helps manufacturers mitigate cyber risks, bridge skills gaps, and enhance operational resilience.
- March 2025 : Siemens launched its Industrial Copilot with new generative AI-powered capabilities for Senseye Predictive Maintenance, enhancing support across the entire maintenance cycle. The solution enables repair, prevention, prediction, and optimization through AI-driven insights.
- February 2025 : Schneider Electric launched EcoConsult in India to offer expert electrical and automation systems consulting services. The solution helps businesses improve asset performance, minimize downtime, and enhance energy efficiency, achieving up to 30% savings in operational expenses and a 35% reduction in energy losses.
Table of Contents
 Exclusive indicates content/data unique to MarketsandMarkets and not available with any competitors.
Methodology
The study used four major activities to estimate the market size of industrial services. Exhaustive secondary research was conducted to gather information on the market and its peer and parent markets. The next step was to validate these findings, assumptions, and sizing with industry experts across the value chain through primary research. Both top-down and bottom-up approaches were employed to estimate the total market size. Finally, market breakdown and data triangulation methods were utilized to estimate the market size for different segments and subsegments.
Secondary Research
The research methodology used to estimate and forecast the size of the industrial services market began with the acquisition of data related to the revenues of key vendors in the market through secondary research. Various secondary sources have been referred to in the secondary research process to identify and collect information for this study. Secondary sources include annual reports, press releases, and investor presentations of companies; white papers, journals, certified publications, and articles by recognized authors; websites; directories; and databases. Secondary research was mainly used to obtain key information about the value chain of the industrial services market, key players, market classification, and segmentation according to the industry trends to the bottom-most level, geographic markets, and key developments from both market and technology-oriented perspectives. The secondary research referred to for this research study involves various white papers, cybersecurity for industry at a glance, decarbonizing practices in the global chemicals industry, industrial manufacturing in the era of Industry 4.0 and beyond, and various other sources. Moreover, the study involved extensive secondary sources, directories, and databases, such as Hoovers, Bloomberg Businessweek, and Factiva, to identify and collect valuable information for a technical, market-oriented, and commercial study of the industrial services market.
Primary Research
Various primary sources from the supply and demand sides were interviewed in the primary research process to obtain the qualitative and quantitative information relevant to this report. Primary sources from the supply side include key industry participants, subject-matter experts (SMEs), and C-level executives and consultants from various key companies and organizations in the industrial services ecosystem. After the complete market engineering (including calculations for the market statistics, the market breakdown, the market size estimations, the market forecasting, and the data triangulation), extensive primary research was conducted to verify and validate the critical market numbers obtained. Several primary interviews were conducted with market experts from the demand- and supply-side players across key regions: North America, Europe, Asia Pacific, and the Rest of the World (Middle East, Africa, and South America).
Primary data was collected through questionnaires, emails, and telephone interviews. Various departments within organizations, such as sales, operations, and administration, were covered in the canvassing of primaries to provide a holistic viewpoint in our report. This and the opinions of in-house subject-matter experts led us to the findings described in the remainder of this report.

Note: The three tiers of the companies are defined based on their total revenue in 2024: Tier 1 - revenue greater than or equal to USD 1 billion; Tier 2 - revenue between USD 100 million and USD 1 billion; and Tier 3 revenue less than or equal to USD 100 million. Other designations include sales managers, marketing managers, and product managers.
To know about the assumptions considered for the study, download the pdf brochure
Market Size Estimation
Both top-down and bottom-up approaches were utilized to estimate and validate the size of the industrial services market and its submarkets. Secondary research was conducted to identify the key players in the market, and primary and secondary research was used to determine their market share in specific regions. The process involved studying top players' annual and financial reports and conducting extensive interviews with industry leaders such as CEOs, VPs, directors, and marketing executives. Secondary sources were used to determine all percentage shares and breakdowns, which were verified through primary sources. All parameters that could impact the markets covered in this research study were accounted for, analyzed in detail, verified through primary research, and consolidated to obtain the final quantitative and qualitative data.
Industrial Services Market : Top-Down and Bottom-Up Approach

Data Triangulation
Once the overall size of the industrial services market was determined using the methods described above, it was divided into multiple segments and subsegments. Market engineering was performed for each segment and subsegment using market breakdown and data triangulation methods, as applicable, to obtain accurate statistics. Various factors and trends from the demand and supply sides were studied to triangulate the data. The market was validated using both the top-down and bottom-up approaches.
Market Definition
The industrial services market comprises a broad set of offerings that support the performance, efficiency, and reliability of operations across various sectors. These services are designed to optimize the lifecycle of industrial systems and are segmented by service type into engineering and consulting, installation & commissioning, and operational improvement & maintenance. Each service type plays a role in enhancing system performance, ensuring regulatory compliance, and minimizing downtime.
By application, industrial services support key systems such as manufacturing execution systems (MES), distributed control systems (DCS), programmable logic controllers (PLCs), SCADA systems, motors & drives, industrial robotics, 3D printing, safety systems, industrial PCs, and human—machine interfaces (HMIs). These applications are critical for automation, monitoring, and control across diverse industrial environments. Industries benefiting from industrial services include automotive, aerospace, chemicals, food & beverages, metals & mining, oil & gas, pharmaceuticals, energy & power, water & wastewater, semiconductors, paper & pulp, and other end-use industries such as marine and telecommunications. Industrial services ensure that these industries maintain high productivity, reliability, and safety standards through advanced service delivery, tailored support, and the integration of modern technologies.
Key Stakeholders
- Manufacturers and suppliers
- Service providers
- End-use industries
- Government regulatory bodies
- Investors and financial institutions
- Trade associations and industry groups
- Research and development centers
- Technology providers
- Logistics and transportation companies
- Environmental and sustainability organizations
- Workers and labor unions
Report Objectives
- To estimate and forecast the size of the industrial services market, in terms of value, based on service type, application, end-use industry, and region
- To describe and forecast the market size, in terms of value, for four major regions: North America, Europe, Asia Pacific, and Rest of World (RoW)
- To provide detailed information regarding major factors such as drivers, restraints, opportunities, and challenges influencing market growth
- To provide a detailed overview of the industrial services value chain
- To strategically analyze micromarkets regarding individual market trends, growth prospects, and contributions to the total market
- To strategically profile key players and comprehensively analyze their market position in terms of ranking and core competencies, along with a detailed competitive landscape for the market leaders
- To analyze major growth strategies such as product launches/developments and acquisitions adopted by the key market players to enhance their market position
- To analyze the impact of the macroeconomic factors impacting the industrial services market
- To assess the impact of AI on the growth and adoption of the industrial services market
Customization Options
With the given market data, MarketsandMarkets offers customizations according to the specific requirements of companies. The following customization options are available for the report:
- Detailed analysis and profiling of additional market players (up to 5)
- Additional country-level analysis of the industrial services market
Product Analysis
- The product matrix provides a detailed comparison of the product portfolio of each company in the industrial services market.
Key Questions Addressed by the Report
What is the current size of the global Industrial Services market?
The global Industrial Services market is estimated at USD 34.41 billion in 2025 and is projected to reach USD 54.69 billion by 2030. (MarketsandMarkets)
What is the expected growth rate of the Industrial Services market?
The market is expected to grow at a CAGR of 9.7% from 2025 to 2030, driven by increasing industrial automation and digital transformation initiatives. (MarketsandMarkets)
What are the key growth drivers for the Industrial Services market?
Major growth drivers include the increasing adoption of Industry 4.0 technologies, integration of IoT, AI, big data analytics, predictive maintenance solutions, and the expansion of global manufacturing activities. (MarketsandMarkets)
Which service type holds the largest share of the Industrial Services market?
Operational Improvement & Maintenance Services held the largest market share in 2024 due to growing demand for asset reliability, reduced downtime, and optimized industrial performance. (MarketsandMarkets)
Which application segment is expected to grow the fastest?
The Industrial 3D Printer segment is projected to register the highest CAGR of 14.1% during the forecast period, driven by increased adoption of additive manufacturing technologies. (MarketsandMarkets)
Which end-use industry dominates the Industrial Services market?
The Automotive industry accounted for the largest market share of 17.4% in 2024, supported by increasing use of automation, digital twins, predictive maintenance, and smart manufacturing technologies. (MarketsandMarkets)
Which region is expected to lead market growth?
Asia Pacific is the fastest-growing regional market and is projected to grow at a CAGR of 10.6% through 2030, driven by industrialization, smart factory investments, and manufacturing expansion in countries such as China and India. (MarketsandMarkets)
What are the key trends shaping the Industrial Services industry?
Key trends include Industry 4.0 adoption, predictive maintenance, digital twins, AI-powered analytics, cybersecurity services, smart manufacturing, sustainable operations, and cloud-based industrial monitoring solutions. (MarketsandMarkets)
Who are the leading companies in the Industrial Services market?
Major market participants include ABB, Siemens, Schneider Electric, Honeywell International, and Rockwell Automation. (MarketsandMarkets)
What is the future outlook for the Industrial Services market?
The market outlook remains positive through 2030 due to increasing demand for operational efficiency, sustainability initiatives, industrial automation, smart manufacturing infrastructure, and advanced maintenance services across industries. (MarketsandMa
Need a Tailored Report?
Customize this report to your needs
Get 10% FREE Customization
Customize This ReportPersonalize This Research
- Triangulate with your Own Data
- Get Data as per your Format and Definition
- Gain a Deeper Dive on a Specific Application, Geography, Customer or Competitor
- Any level of Personalization
Let Us Help You
- What are the Known and Unknown Adjacencies Impacting the Industrial Services Market
- What will your New Revenue Sources be?
- Who will be your Top Customer; what will make them switch?
- Defend your Market Share or Win Competitors
- Get a Scorecard for Target Partners

Custom Market Research Services
We Will Customise The Research For You, In Case The Report Listed Above Does Not Meet With Your Requirements
Get 10% Free CustomisationTESTIMONIALS

Tetsuya Ohhira
Business Development Manager-Technology Business
Nikon Corporation,
Leading Japanese MNC specializing in optics and imaging productswww.nikon.com
MarketsandMarkets™ response
is quick. Their attitude is flexible and positive. Analyst Insights are globally considered and
significant. Client Services quickly respond to our inquiry and demand. Their wide range of global
surveys help us make our strategic plan.
We hope Knowledge Store will be easier to search
for a report.
VP - Marketing & Business Development
Leading Provider of Process Control Solutions
We engaged with MarketsandMarkets on a study to perform an analysis and recommend a Go-To-Market strategy for metrology and process control in the semiconductor market. The study was tailored to our targets and needs with well-defined milestones. Our overall experience with the MarketsandMarkets team was very good throughout the project in all aspects including the analysis methodologies used, the quality and depth of primary and secondary data sets, the professionalism and flexibility of the team and the ability to meet the target schedule and milestones. We want to thank MarketsandMarkets team for a job well done.
Growth opportunities and latent adjacency in Industrial Services Market


Nathan
Nov, 2017
How is this report segmented by service (engineering and consulting, installation and commissioning, and operational improvement and maintenance)? Are services further segmented into industries or vice versa? .
Takafumi
Aug, 2017
There are two things we want to know; We want to know what "6.4 Operational Improvement & Maintenance" includes. And can we buy that segment by page (not whole report), and if we can, how much does it cost?.
Divya
Feb, 2018
How detailed does this report get as far as service segmentation is concerned? What service markets are particularly sized?.
Bruno
Nov, 2019
I am a scientific journalist working and currently I am writing an article about the industrial services and maintenance industry, mainly in North America, but I am interested to have a worldwide perspective. To resume, my hypothesis is that this sector (about 80%) is still informal in North America and we are loosing a great opportunity to grow the market. My intention is to show that we can do better to grow this sector. I would consider this study as a very important tool to my research..