Dry Construction Market by Type (Supporting Framework & Boarding), Material (Metal, Wood, Plasterboard, Plastic, & Others), System (Wall, Ceiling, Flooring, & Others), Application (Residential & Non- Residential) & Region - Trends and Forecast to 2020


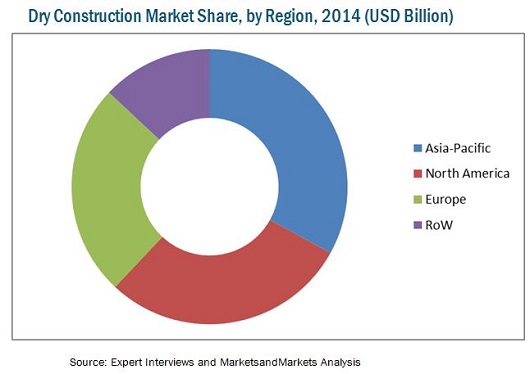
[213 Pages Report] The market for the global dry construction industry has seen an extensive upward surge since 2009. The global dry construction market is projected to reach USD 79.08 Billion by 2020, with a CAGR of 5.3% during the forecast period, (2015 to 2020). After the economic slowdown, new constructions have come up in large numbers, the high requirements for fast implementation of construction site, and the inexpensive nature. The Asia-Pacific region accounted for around 33% of the total market share in terms of value, followed by the North American and European regions. However, as the dry construction market in developed countries is getting matured, the markets in developing countries such as China, Indonesia, and India are estimated to grow at a higher rate from 2015 to 2020. China is estimated to grow faster than any other country because of its high population along with new constructions coming up in the next five years.
The dry construction market has been growing in accordance with the construction industry. With growing awareness about global warming and concerns about the environment, people are opting for eco-friendly techniques of constructions, which have had an impact on the market for dry construction products.
This report estimates the market size of the global dry construction market in terms of value (USD billion). In this report, the market is broadly segmented based on type, material, system, application, and region. Market drivers, restraints, challenges, raw material, and product price trends are discussed in detail. Market share, by participant, for the overall market is discussed in detail. The global dry construction market has grown exponentially in the last few years and this trend is expected to continue. Increasing disposable incomes of people in developing countries, regulations to incorporate dry construction, and changing preferences of people towards sustainable building techniques drive the growth of the dry construction market.
Scope of the Report
This research study categorizes the global dry construction market based on type, material, system, application, and region:
Based on Type:
- Supporting framework
- Boarding
Based on Material:
- Plasterboard
- Wood
- Metal
- Plastic
- Others (glass and carpet)
Based on System:
- Wall
- Ceiling
- Flooring
- Others (window, partition, and door system)
Based on Application:
- Residential
- Non-residential (commercial, healthcare, hospitality, and others)
Based on Region:
- North America
- Europe
- Asia-Pacific
- Rest of the World (RoW)
The global dry construction market is estimated to reach USD 78.09 Billion by 2020, with a projected CAGR of 5.3%, signifying a steady increase in the demand for construction industry.
The dry construction market has been growing in accordance with the construction industry. The growth of the dry construction market is primarily driven by the following factors:
- Increasing population
- Higher GDP growth rate in developing economies like Brazil, India, China and Indonesia
- Increasing purchasing power in developing countries
Increase in the usage of recycled material in the manufacturing process, and significant increase in urbanization are the other factors which are driving the dry construction market.
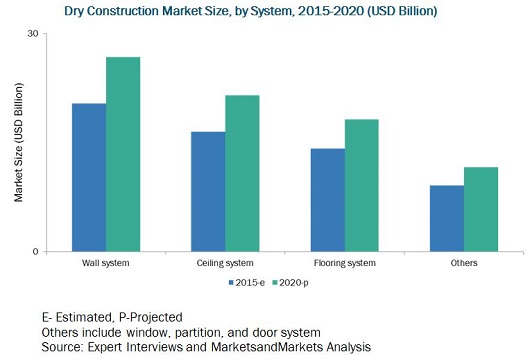
The wall system segment is projected to grow at the highest CAGR of 5.7% from 2015 to 2020.
The global dry construction market is marked with intense competition due to the presence of a large number of both big and small firms. New product launches, mergers & acquisitions, and partnerships and expansions are the key strategies adopted by market players to ensure their growth in the market. The key players in the market are the key players in the dry construction market are Saint Gobain (France), Xella Group (Germany), Armstrong World Industries (U.S.), Etex Group (Belgium), Fletcher Building (New Zealand), USG Boral (Malaysia), CSR (Australia), Knauf (Germany), Panel Rey (Mexico), and Pabco Gypsum (U.S).
 Exclusive indicates content/data unique to MarketsandMarkets and not available with any competitors.
Table of Contents
1 Introduction (Page No. - 22)
1.1 Objectives of the Study
1.2 Market Definition
1.3 Study Scope
1.3.1 Years Considered for the Dry Construction Market
1.4 Currency Considered for the Dry Construction Market
1.5 Package Size
1.6 Limitation
1.7 Stakeholders
2 Research Methodoloy (Page No. - 26)
2.1 Research Data
2.1.1 Secondary Data
2.1.1.1 Key Data From Secondary Sources
2.1.2 Primary Data
2.1.2.1 Key Data From Primary Sources
2.1.2.2 Breakdown of Primaries, By Company Type , Designation & Region
2.1.2.3 Key Industry Insights
2.2 Factor Analysis
2.2.1 Introduction
2.2.2 Demand-Side Analysis
2.2.2.1 Increasing Population
2.2.2.2 Increasing Income and Spending Capacity
2.2.3 Supply-Side Analysis
2.2.3.1 Research & Development
2.3 Market Size Estimation
2.4 Market Breakdown and Data Triangulation
2.5 Market Share Estimation
2.6 Research Assumptions & Limitations
2.6.1 Asssumptions of the Research Study
2.6.2 Limitations of the Research Study
3 Executive Summary (Page No. - 37)
4 Premium Insights (Page No. - 41)
4.1 Attractive Opportunities in the Dry Construction Market
4.2 U.S. & China are the Fastest Growing Markets
4.3 Boarding Segment Led the Dry Construction in 2015
4.4 Asia�Pacific Region Accounted for the Largest Share in the Dry Construction Market in 2015
4.5 Apac & Na to Be the Largest Revenue Generators By 2020
4.6 Dry Construction Market: Top Ten Nations
4.7 Dry Construction Market Share, By Applcation, 2020
4.8 Dry Construction Life Cycle Analysis, By Region
5 Market Overview (Page No. - 46)
5.1 Introduction
5.2 Market Evolution
5.3 Market Segmentation
5.3.1 Dry Construction Market, By Type
5.3.2 Dry Construction Market, By Material
5.3.3 Dry Construction Market, By System
5.3.4 Dry Construction Market, By Application
5.4 Market Dynamics
5.4.1 Drivers
5.4.1.1 Increasing Urbanized Population
5.4.1.2 Increasing Industrialization
5.4.1.3 Growing Investments in Construction Industry
5.4.2 Restraints
5.4.2.1 Increase in Raw Material Cost
5.4.3 Opportunities
5.4.3.1 Rising Demand for Dry Construction Techniques at the Expense of Wet Construction Methods
5.4.3.2 Replacement of Floors
5.4.4 Challenges
5.4.4.1 Environmental and Government Regulations May Restrict the New Entrants
5.4.4.2 Unawareness About Recycled Material Among End Users is Affecting the Plasterboard Market
5.4.4.3 Disposal of Flooring Waste
6 Industry Trends (Page No. - 57)
6.1 Value Chain Analysis
6.2 Supply Chain Analysis
6.2.1 Prominent Companies
6.2.2 Small & Medium Enterprises
6.3 Industry Trends
6.4 Porter�s Five Forces Analysis
6.4.1 Threat of New Entrants
6.4.1.1 Low Capital Requirement and Easy Material Availability
6.4.1.2 High Product Differentiation
6.4.2 Threat of Substitutes
6.4.2.1 High Availability of Substitutes
6.4.3 Bargaining Power of Suppliers
6.4.3.1 Low Cost of Switching Suppliers
6.4.3.2 Non-Concentration of Suppliers
6.4.4 Bargaining Power of Buyers
6.4.4.1 Purchases in Large Volumes
6.4.5 Intensity of Rivalry
6.4.5.1 Many Same Sized Competitors
6.4.5.2 Substantial Exit Barriers
7 Dry Construction Market, By Type (Page No. - 64)
7.1 Introduction
7.2 Supporting Framework
7.2.1 Supporting Framework Market, By Application
7.2.1.1 Residential Application is Increasingly Adopting Supporting Framework as Dry Construction Solutions
7.2.2 Supporting Framework Market, By Region
7.2.2.1 Asia-Pacific is Projected to Grow at the Highest CAGR in the Supporting Framework Segment
7.3 Boarding
7.3.1 Boarding Market, By Application
7.3.1.1 Non-Residential Application has the Largest Market for the Boarding Application
7.3.2 Boarding Market, By Region
7.3.2.1 North America Dominated the Boarding Segment in the Dry Construction Market
8 Dry Construction Market, By Material (Page No. - 72)
8.1 Introduction
8.2 Plasterboard
8.2.1 Plasterboard Market, By Application
8.2.1.1 Residential Market is Projected to Grow at A Steady CAGR
8.2.2 Plasterboard Market, By Region
8.2.2.1 Asia-Pacific is Projected to Grow at the Highest CAGR in the Plasterboard Segment
8.3 Wood
8.3.1.1 Growing Demand of Plywood is Driving the Growth of the Wood Market
8.3.2 Wood Market, By Application
8.3.2.1 Non-Residential Application is Driving the Growth of the Wood Market
8.3.3 Wood Market, By Region
8.3.3.1 North America Dominated the Wood Segment in the Dry Construction Market
8.4 Metal
8.4.1 Metal Market, By Application
8.4.1.1 Residential Application to Grow at A Fastest CAGR in the Dry Construction Material Market
8.4.2 Metal Market, By Region
8.4.2.1 Asia-Pacific Dominates the Metal Market
8.5 Plastic
8.5.1 Plastic Market, By Application
8.5.1.1 Plastic is Increasingly Adopting as Dry Construction Solutions Material in Residential Application
8.5.2 Plastic Market, By Region
8.5.2.1 Asia-Pacific is Projected to Grow at the Highest CAGR in the Plastic Segment
8.6 Others
8.6.1 Others Market, By Application
8.6.1.1 Carpets are Increasingly Adopting Material in Non-Residential Application
8.6.2 Others Market, By Region
8.6.2.1 Asia-Pacific is Projected to Grow at the Highest CAGR in the Others Segment
9 Dry Construction Market, By System (Page No. - 87)
9.1 Introduction
9.2 Ceiling System
9.2.1 Ceiling System, By Application
9.2.1.1 Residential Segment is Projected to Grow at A Highest CAGR By 2020
9.2.2 Ceiling System, By Region
9.2.2.1 Asia-Pacific is Projected to Grow at A Highest CAGR By 2020
9.3 Wall System
9.3.1 Wall System, By Application
9.3.1.1 Increased Investment in Housing Schemes Will Boost Residential Application
9.3.2 Wall System, By Region
9.3.2.1 North America is the Second Largest Region in Wall System Market
9.4 Flooring System
9.4.1 Flooring System, By Application
9.4.1.1 the Increased Industrialization Will Drive the Non-Residential Segment
9.4.2 Flooring System, By Region
9.5 Others
9.5.1 Others System, By Application
9.5.1.1 Increased Commercialization and Growing Investment in Construction Segment Will Drive the Non-Residential Application
9.5.2 Others System, By Region
9.5.2.1 Asia-Pacific is Growing at the Highest CAGR
10 Dry Construction Market, By Application (Page No. - 101)
10.1 Introduction
10.2 Residential Application
10.2.1 Residential Application Market, By System
10.2.1.1 Ceiling System is Expected to Have Largest Market Share in 2020
10.2.2 Residential Application Market, By Type
10.2.2.1 Supporting Framework in Residential Application is Growing at Highest CAGR
10.2.3 Residential Application Market, By Material
10.2.3.1 Plasterboard has the Largest Share in the Residential Application Market
10.2.4 Residential Application Market, By Region
10.2.4.1 Asia-Pacific Region Experiences the Higher Growth as Compared to Other Regions
10.3 Non-Residential Application
10.3.1 Non-Residential Held the Top Position of the Total Market Share in Terms of Value in 2014
10.3.2 Non-Residential Application Market, By System
10.3.2.1 Ceiling System to Grow at the Highest Rate
10.3.3 Non-Residential Application, By Type
10.3.3.1 Supporting Framework an Attractive Market of Dry Construction Industry
10.3.4 Non-Residential Application Market, By Material
10.3.4.1 Plasterboard is the Fastest Growing Material in Non-Residential Application Market
10.3.5 Non-Residential Application Market, By Region
10.3.5.1 Rising Demand for Easy and Fast Construction is Driving the Market in North America
11 Dry Construction Market, By Region (Page No. - 115)
11.1 Introduction
11.1.1 Dry Construction Market is Projected to Grow at A Fastest CAGR
11.2 Asia-Pacific
11.2.1 China
11.2.1.1 China Dry Construction Market, By System
11.2.1.1.1 Ceiling is the Dominating Dry Construction System in China
11.2.1.2 China Dry Construction Market, By Application
11.2.1.2.1 Extensive Growth in Industrialization is Driving the Non-Residential Application
11.2.2 India
11.2.2.1 India Dry Construction Market, By System
11.2.2.1.1 Ceiling is Projected to Grow at the Highest CAGR By 2020
11.2.2.2 India Dry Construction Market, By Application
11.2.2.2.1 New Infrastructure Projects are Driving Non-Residential Application
11.2.3 Japan
11.2.3.1 Japan Dry Construction Market, By System
11.2.3.1.1 Diverse Product Templates are Driving the Ceiling System
11.2.3.2 Japan Dry Construction Market, By Application
11.2.3.2.1 New Housing Schemes are Increasing at A Healthy Pace
11.2.4 Australia
11.2.4.1 Australia Dry Construction Market, By System
11.2.4.1.1 the Demand for Ceiling System is Growing at the Highest CAGR By 2020
11.2.4.2 Australian Dry Construction Market, By System
11.2.4.2.1 the Easy and Time-Less Installation Techniques are Driving the Residential Application
11.2.5 Rest of Asia-Pacific
11.2.5.1 Rest of Asia-Pacific Dry Construction Market, By System
11.2.5.1.1 Wall System is Accounted for the Second Largest Share in Rest of Asia-Pacific
11.2.5.2 Rest of Asia-Pacific Dry Construction Market, By System
11.2.5.2.1 Ceiling is Projected to Grow at the Highest CAGR By 2020
11.3 Europe
11.3.1 Spain
11.3.1.1 Spain Dry Construction Market, By System
11.3.1.1.1 Ceiling System is the Largest Market in Spain
11.3.1.2 Spain Dry Construction Market, By Application
11.3.1.2.1 Growing Industrialization is Driving the Non-Residential Application
11.3.2 U.K.
11.3.2.1 U.K. Dry Construction Market, By System
11.3.2.1.1 the Ceiling System is Growing at A Steady CAGR By 2020
11.3.2.2 U.K. Dry Construction Market, By Application
11.3.2.2.1 Increasing Nuclear Families Will Drive the Residential Application Market
11.3.3 Russia
11.3.3.1 Russia Dry Construction Market, By System
11.3.3.1.1 Fifa 2018 World Cup Will Boost the Construction Industry in Russia
11.3.3.2 Russia Dry Construction Market, By Application
11.3.3.2.1 Residential Application Will Grow at A Steady CAGR By 2020
11.3.4 the Netherlands
11.3.4.1 the Netherlands Dry Construction Market, By System
11.3.4.1.1 Ceiling System is the Largest Market and Projected to Grow at the Highest CAGR By 2020
11.3.4.2 The Netherlands Dry Construction Market, By Application
11.3.4.2.1 Increased Investment in Industrialization in Will Grow Non-Residential Application
11.3.5 RoE
11.3.5.1 RoE Dry Construction Market, By System
11.3.5.1.1 Increasing Financial Conditions Will Drive the Construction Industry
11.3.5.2 RoE Dry Construction Market, By Application
11.3.5.2.1 Residential Application is Projected to Grow at the Highest CAGR By 2020
11.4 North America
11.4.1 U.S.
11.4.1.1 U.S. Dry Construction Market, By System
11.4.1.1.1 Ceiling System is Projected to Grow at the High CAGR During the Review Period
11.4.1.2 U.S. Dry Construction Market, By Application
11.4.1.2.1 High Investment in Industrialization Will Drive the Non-Residential Application
11.4.2 Canada
11.4.2.1 Canada Dry Construction, By System
11.4.2.1.1 Ceiling is the Most Preferred System in Canada
11.4.2.2 Canada Dry Construction, By Application
11.4.2.2.1 Grow in Commercialization Will Drive the Non-Residential Application
11.4.3 Mexico
11.4.3.1 Mexico Dry Construction, By System
11.4.3.1.1 Ceiling System is Projected to Be the Fastest By 2020
11.4.3.2 Mexico Dry Construction, By Application
11.4.3.2.1 Growth in Industrialization and Sport Facilities Will Drive the Non-Residential Segment.
11.5 Rest of the World (RoW)
11.5.1 Brazil
11.5.1.1 Brazil Dry Construction, By System
11.5.1.1.1 the Ceiling System is Projected to the Highest CAGR in Brazil
11.5.1.2 Brazil Dry Construction, By Application
11.5.1.2.1 the Growth Sports Industries Will Drive the Non-Residential Segment
11.5.2 South Africa
11.5.2.1 South Africa Dry Construction, By System
11.5.2.1.1 Wall System is the Second-Largest Market in South Africa
11.5.2.2 South Africa Dry Construction, By Application
11.5.2.2.1 the Tremendous Growth in the Industrialization Will Drive the Non-Residential Application
11.5.3 Peru
11.5.3.1 Peru Dry Construction, By System
11.5.3.1.1 Ceiling System is Estimated to Be the Largest Dry Construction Market
11.5.3.2 Peru Dry Construction, By System
11.5.3.2.1 Residential Application is the Largest Market Due to the Increased Spending Capacity
11.5.4 Other RoW Countries
11.5.4.1 Others Dry Construction, By System
11.5.4.1.1 Ceiling System is the Largest Market
11.5.4.2 Others Dry Construction, By Application
11.5.4.2.1 the Growing Construction Industry Will Drive the Non-Residential Market
12 Competitive Landscape (Page No. - 175)
12.1 Overview
12.2 Market Share Analysis
12.3 Competitive Situation & Trends
12.4 Investments
12.5 Mergers & Acquisitions
12.6 New Product Launches
12.7 Agreements, Joint Ventures & Divestments
13 Company Profiles (Page No. - 182)
(Company at A Glance, Recent Financials, Products & Services, Strategies & Insights, & Recent Developments)*
13.1 Introduction
13.2 Armstrong World Industries, Inc.
13.3 Etex Group
13.4 Fletcher Building Limited
13.5 Saint Gobain
13.6 Xella Group
13.7 CSR Limited
13.8 Knauf
13.9 Pabco Gypsum
13.10 Panel Rey
13.11 USG Boral Limited
*Details on Company at A Glance, Recent Financials, Products & Services, Strategies & Insights, & Recent Developments Might Not Be Captured in Case of Unlisted Companies.
14 Appendix (Page No. - 206)
14.1 Insights From Industry Experts
14.2 Discussion Guide
14.3 Introducing RT: Real Time Market Intelligence
14.4 Available Customizations
14.5 Related Reports
List of Tables (196 Tables)
Table 1 Dry Construction Types & Their Description
Table 2 Dry Construction Materials & Their Description
Table 3 Dry Construction System & Their Description
Table 4 Dry Construction Application & Their Description
Table 5 Regional Urbanization Trend From 1990 to 2050
Table 6 Industry Value Addition, By Country, 2010 - 2013 (%GDP)
Table 7 Summary of the U.K. Flooring Sector & Its Disposal Mechanism in 2010
Table 8 Dry Construction Market Size, By Type, 2013-2020 (Billion Square Meter)
Table 9 Dry Construction Market Size, By Type, 2013-2020 (USD Billion)
Table 10 Supporting Framework Market Size, By Application,2013-2020 (Billion Square Meter)
Table 11 Supporting Framework Market Size, By Application,2013-2020 (USD Billion)
Table 12 Supporting Framework Market Size, By Region,2013-2020 (Billion Square Meter)
Table 13 Supporting Framework Market Size, By Region, 2013-2020 (USD Billion)
Table 14 Boarding Market Size, By Application, 2013-2020 (Billion Square Meter)
Table 15 Boarding Market Size, By Application, 2013-2020 (USD Billion)
Table 16 Boarding Market Size, By Region, 2013-2020 (Billion Square Meter)
Table 17 Boarding Market Size, By Region, 2013-2020 (USD Billion)
Table 18 Dry Construction Market Size, By Material,2013-2020 (Billion Square Meter)
Table 19 Dry Construction Market Size, By Material, 2013-2020 (USD Billion)
Table 20 Plasterboard Market Size, By Application,2013-2020 (Billion Square Meter)
Table 21 Plasterboard Market, By Application, 2013-2020 (USD Billion)
Table 22 Plasterboard Market Size, By Region, 2013-2020 (Billion Square Meter)
Table 23 Plasterboard Market Size, By Region, 2013-2020 (USD Billion)
Table 24 Wood Market Size, By Material, 2013-2020 (Billion Square Meter)
Table 25 Wood Market Size, By Material, 2013-2020 (USD Billion)
Table 26 Wood Market Size, By Application, 2013-2020 (Billion Square Meter)
Table 27 Wood Market Size, By Application, 2013-2020 (USD Billion)
Table 28 Wood Market Size, By Region, 2013-2020 (Billion Square Meter)
Table 29 Wood Market Size, By Region, 2013-2020 (USD Billion)
Table 30 Metal Market Size, By Type, 2013-2020 (Billion Square Meter)
Table 31 Metal Market Size, By Type, 2013-2020 (USD Billion)
Table 32 Metal Market Size, By Application, 2013-2020 (Billion Square Meter)
Table 33 Metal Market Size, By Application, 2013-2020 (USD Billion)
Table 34 Metal Market Size, By Region, 2013-2020 (Billion Square Meter)
Table 35 Metal Market Size, By Region, 2013-2020 (USD Billion)
Table 36 Plastic Market Size, By Application, 2013-2020 (Billion Square Meter)
Table 37 Plastic Market, By Application, 2013-2020 (USD Billion)
Table 38 Plastic Market Size, By Region, 2013-2020 (Billion Square Meter)
Table 39 Plastic Market Size, By Region, 2013-2020 (USD Billion)
Table 40 Others Market Size, By Application, 2013-2020 (Billion Square Meter)
Table 41 Others Market, By Application, 2013-2020 (USD Billion)
Table 42 Others Market Size, By Region, 2013-2020 (Billion Square Meter)
Table 43 Others Market Size, By Region, 2013-2020 (USD Billion)
Table 44 Systems of Dry Construction & Their Description
Table 45 Dry Construction Market, By System, 2013-2020 (Billion Square Meter)
Table 46 Dry Construction Market, By System, 2013-2020 (USD Billion)
Table 47 Ceiling System Size, By Application, 2013-2020 (Billion Square Meter )
Table 48 Ceiling System Size, By Application, 2013-2020 (USD Billion )
Table 49 Ceiling System Size, By Region, 2013-2020 (Billion Square Meter)
Table 50 Ceiling System Size, By Region, 2013-2020 (USD Billion)
Table 51 Wall System Size, By Application, 2013-2020 (Billion Square Meter)
Table 52 Wall System Size, By Application, 2013-2020 (USD Billion)
Table 53 Wall System Size, By Region, 2013-2020 (Billion Square Meter)
Table 54 Wall System Size, By Region, 2013-2020 (USD Billion)
Table 55 Flooring System Size, By Application, 2013-2020 (Billion Square Meter)
Table 56 Flooring System Size, By Application, 2013-2020 (USD Billion)
Table 57 Flooring System Size, By Region, 2013-2020 (Billion Square Meter)
Table 58 Flooring System Size, By Region, 2013-2020 (USD Billion)
Table 59 Others System Size, By Application, 2013-2020 (Billion Square Meter)
Table 60 Others System Size, By Application, 2013-2020 (USD Billion)
Table 61 Others System Size, By Region, 2013-2020 (Billion Square Meter)
Table 62 Others System Size, By Region, 2013-2020 (USD Billion)
Table 63 Dry Construction Market Size, By Application,2013-2020 (Billion Square Meter)
Table 64 Dry Construction Market Size, By Application, 2013-2020 (USD Billion)
Table 65 Residential Application Market Size, By System,2013-2020 (Billion Square Meter)
Table 66 Residential Application Market Size, By System, 2013-2020 (USD Billion)
Table 67 Residential Application Market Size, By Type,2013-2020 (Billion Square Meter)
Table 68 Residential Application Market Size, By Type, 2013-2020 (USD Billion)
Table 69 Residential Application Market Size, By Material,2013-2020 (Billion Square Meter)
Table 70 Residential Application Market Size, By Material, 2013-2020 (USD Billion)
Table 71 Residential Application Market Size, By Region,2013-2020 (Billion Square Meter)
Table 72 Residential Application Market Size, By Region, 2013-2020 (USD Billion)
Table 73 Non-Residential Application Market Size, By Segment,2013-2020 (Billion Square Meter)
Table 74 Non-Residential Application Market Size, By Segment,2013-2020 (USD Billion)
Table 75 Non-Residential Application Market Size, By System,2013-2020 (Billion Square Meter)
Table 76 Non-Residential Application Market Size, By System,2013-2020 (USD Billion)
Table 77 Non-Residential Application Market Size, By Type,2013-2020 (Billion Square Meter )
Table 78 Non-Residential Application Market Size, By Type, 2013-2020 (USD Billion)
Table 79 Non-Residential Application Market Size, By Material,2013-2020 (Billion Square Meter)
Table 80 Non-Residential Application Market Size, By Material,2013-2020 (USD Billion)
Table 81 Non-Residential Application Market Size, By Region,2013-2020 (Billion Square Meter)
Table 82 Non-Residential Application Market Size, By Region,2013-2020 (USD Billion)
Table 83 Dry Construction Size, By Region, 2013-2020 (Billion Square Meter)
Table 84 Dry Construction Size, By Region, 2013-2020 (USD Billion)
Table 85 Asia-Pacific: Dry Construction Market Size, By Country,2013-2020 (Billion Square Meter)
Table 86 Asia-Pacific: Dry Construction Market Size, By Country,2013-2020 (USD Billion)
Table 87 Asia-Pacific: Dry Construction Market Size, By System,2013-2020 (Billion Square Meter)
Table 88 Asia-Pacific: Dry Construction Market Size, By System,2013-2020 (USD Billion)
Table 89 Asia-Pacific: Dry Construction Market Size, By Application,2013-2020 (Billion Square Meter)
Table 90 Asia-Pacific: Dry Construction Market Size, By Application2013-2020 (USD Billion)
Table 91 Asia-Pacific: Dry Construction Market Size, By Material,2013-2020 (Billion Square Meter)
Table 92 Asia-Pacific: Dry Construction Market Size, By Material,2013-2020 (USD Billion)
Table 93 Asia-Pacific: Dry Construction Market Size, By Type,2013-2020 (Billion Square Meter)
Table 94 Asia-Pacific: Dry Construction Market Size, By Type,2013-2020 (USD Billion)
Table 95 China: Dry Construction Market Size, By System2013-2020 (Billion Square Meter)
Table 96 China: Dry Construction Market Size, By System 2013-2020 (USD Billion)
Table 97 China: Dry Construction Market Size, By Application,2013-2020 (Billion Square Meter)
Table 98 China: Dry Construction Market Size, By Application, 2013-2020 (USD Billion)
Table 99 India: Dry Construction Market Size, By System,2013-2020 (Billion Square Meter)
Table 100 India: Dry Construction Market Size, By System, 2013-2020 (USD Billion)
Table 101 India: Dry Construction Market Size, By Application,2013-2020 (Billion Square Meter)
Table 102 India: Dry Construction Market Size, By Application,2013-2020 (USD Billion)
Table 103 Japan: Dry Construction Market Size, By Type,2013-2020 (Billion Square Meter)
Table 104 Japan: Dry Construction Market Size, By System, 2013-2020 (USD Billion)
Table 105 Japan: Dry Construction Market Size, By Application,2013-2020 (Billion Square Meter)
Table 106 Japan: Dry Construction Market Size, By Application,2013-2020 (USD Billion)
Table 107 Australia: Dry Construction Market Size, By System,2013-2020 (Billion Square Meter)
Table 108 Australia: Market Size, By Region, By System,2013-2020 (USD Billion)
Table 109 Australia: Dry Construction Market Size, By Application,2013-2020 (Billion Square Meter)
Table 110 Australia: Market Size, By Application,2013-2020 (USD Billion)
Table 111 Rest of Asia-Pacific: Dry Construction Market Size, By System,2013-2020 (Billion Square Meter)
Table 112 Rest of Asia-Pacific: Market Size, By System2013-2020 (USD Billion)
Table 113 Rest of Asia-Pacific: Dry Construction Market, By Application,2013-2020 (Billion Square Meter)
Table 114 Rest of Asia-Pacific: Market, By Application,2013-2020 (USD Billion)
Table 115 Europe: Dry Construction Market Size, By Country,2013-2020 (Billion Square Meter)
Table 116 Europe: Dry Construction Market Size, By Country, 2013-2020 (USD Billion)
Table 117 Europe: Dry Construction Market Size, By System,2013-2020 (Billion Square Meter)
Table 118 Europe: Dry Construction Market Size, By System,2013-2020 (USD Billion)
Table 119 Europe: Dry Construction Market Size, By Application,2013-2020 (Billion Square Meter)
Table 120 Europe: Dry Construction Market Size, By Application,2013-2020 (USD Billion)
Table 121 Europe: Dry Construction Market Size, By Material,2013-2020 (Billion Square Meter)
Table 122 Europe: Dry Construction Market Size, By Material,2013-2020 (USD Billion)
Table 123 Europe: Dry Construction Market Size, By Type,2013-2020 (Billion Square Meter)
Table 124 Europe: Market Size, By Type, 2013-2020 (USD Billion)
Table 125 Spain: Dry Construction Market Size, By System,2013-2020 (Billion Square Meter)
Table 126 Spain: Market Size, By System, 2013-2020 (USD Billion)
Table 127 Spain: Dry Construction Market Size, By Application,2013-2020 (Billion Square Meter)
Table 128 Spain: Dry Construction Market, By Application, 2013-2020 (USD Billion)
Table 129 U.K. : Dry Construction Market Size, By System,2013-2020 (Billion Square Meter)
Table 130 U.K.: Dry Construction Market Size, By System, 2013-2020 (USD Billion)
Table 131 U.K.: Dry Construction Market Size, By Application,2013-2020 (Billion Square Meter)
Table 132 U.K.: Dry Construction Market Size, By Application,2013-2020 (USD Billion)
Table 133 Russia: Dry Construction Market Size, By System,2013-2020 (Billion Square Meter)
Table 134 Russia: Dry Construction Market Size, By System, 2013-2020 (USD Billion)
Table 135 Russia: Dry Construction Market Size, By Application,2013-2020 (Billion Square Meter)
Table 136 Russia: Market Size, By Application,2013-2020 (USD Billion)
Table 137 The Netherlands: Dry Construction Market Size, By Type,2013-2020 (Billion Square Meter)
Table 138 The Netherlands: Dry Construction Market Size, By Type,2013-2020 (USD Billion)
Table 139 The Netherlands: Dry Construction Market Size, By Application,2013-2020 (Billion Square Meter)
Table 140 The Netherlands: Market Size, By Application,2013-2020 (USD Billion)
Table 141 RoE: Dry Construction Market Size, By System,2013-2020 (Billion Square Meter)
Table 142 RoE: Market Size, By System, 2013-2020 (USD Billion)
Table 143 RoE: Dry Construction Market Size, By Application,2013-2020 (Billion Square Meter)
Table 144 RoE: Market Size, By Application,2013-2020 (USD Billion)
Table 145 North America: Dry Construction Market Size, By Country,2013�2020 (Billion Square Meters)
Table 146 North America: Dry Construction Market Size, By Country,2013�2020 (USD Billion)
Table 147 North America: Dry Construction Market Size, By System,2013�2020 (Billion Square Meters)
Table 148 North America: Dry Construction Market Size, By System,2013�2020 (USD Billion)
Table 149 North America: Dry Construction Market Size, By Application2013�2020 (Billion Square Meters)
Table 150 North America: Dry Construction Market Size, By Application2013�2020 (USD Billion)
Table 151 North America: Dry Construction Market Size, By Material2013�2020 (Billion Square Meters)
Table 152 North America: Dry Construction Market Size, By Material2013�2020 (USD Billion)
Table 153 North America: Dry Construction Market Size, By Type,2013�2020 (Billion Square Meters)
Table 154 North America: Market Size, By Type,2013�2020 (USD Billion)
Table 155 U.S.: Dry Construction Market Size, By System,2013�2020 (Billion Square Meters)
Table 156 U.S.: Market Size, By System, 2013�2020 (USD Billion)
Table 157 U.S.: Dry Construction Market Size, By Application2013�2020 (Billion Square Meters)
Table 158 U.S.: Market Size, By Application,2013�2020 (USD Billion)
Table 159 Canada: Dry Construction Market Size, By System,2013�2020 (Billion Square Meters)
Table 160 Canada: Market Size, By System,2013�2020 (USD Billion)
Table 161 Canada: Dry Construction Market Size, By Application2013�2020 (Billion Square Meters)
Table 162 Canada: Market Size, By Application2013�2020 (USD Billion)
Table 163 Mexico: Dry Construction Market Size, By System,2013�2020 (Billion Square Meters)
Table 164 Mexico: Market Size, By System,2013�2020 (USD Billion)
Table 165 Mexico: Dry Construction Market Size, By Application,2013�2020 (Billion Square Meters)
Table 166 Mexico: Market Size, By Application,2013�2020 (USD Billion)
Table 167 RoW: Dry Construction Market Size, By Country,2013�2020 (Billion Square Meters)
Table 168 RoW: Market Size, By Country, 2013�2020 (USD Billion)
Table 169 RoW: Dry Construction Market Size, By System,2013�2020 (Billion Square Meters)
Table 170 RoW: Market Size, By System, 2013�2020 (USD Billion)
Table 171 RoW: Dry Construction Market Size, By Application,2013�2020 (Billion Square Meters)
Table 172 RoW: Market Size, By Application,2013�2020 (USD Billion)
Table 173 RoW: Dry Construction Market Size, By Material,2013�2020 (Billion Square Meters)
Table 174 RoW: Market Size, By Material, 2013�2020 (USD Billion)
Table 175 RoW: Dry Construction Market Size, By Type,2013�2020 (Billion Square Meters)
Table 176 RoW: Market Size, By Type, 2013�2020 (USD Billion)
Table 177 Brazil: Dry Construction Market Size, By System,2013�2020 (Billion Square Meters)
Table 178 Brazil: Market Size, By System, 2013�2020 (USD Billion)
Table 179 Brazil: Dry Construction Market Size, By Application,2013�2020 (Billion Square Meters)
Table 180 Brazil: Market Size, By Application,2013�2020 (USD Billion)
Table 181 South Africa: Dry Construction Market Size, By System,2013�2020 (Billion Square Meters)
Table 182 South Africa: Market Size, By System,2013�2020 (USD Billion)
Table 183 South Africa: Dry Construction Market Size, By Application2013�2020 (Billion Square Meters)
Table 184 South Africa: Market Size, By Application,2013�2020 (USD Billion)
Table 185 Peru: Dry Construction Market Size, By System,2013�2020 (Billion Square Meters)
Table 186 Peru: Market Size, By System, 2013�2020 (USD Billion)
Table 187 Peru: Dry Construction Market Size, By Application,2013�2020 (Billion Square Meters)
Table 188 Peru: Market Size, By Application,2013�2020 (USD Billion)
Table 189 Other RoW Countries: Dry Construction Market Size, By System,2013�2020 (Billion Square Meters)
Table 190 Other RoW Countries: Market Size, By System,2013�2020 (USD Billion)
Table 191 Other RoW Countries: Dry Construction Market Size, By Application, 2013�2020 (Billion Square Meters)
Table 192 Other RoW Countries: Market Size, By Application, 2013�2020 (USD Billion)
Table 193 Investments, 2011�2015
Table 194 Mergers & Acquisitions, 2011-2014
Table 195 New Product Launches, 2012-2014
Table 196 Agreements, Joint Ventures & Divestments, 2012-2015
List of Figures (65 Figures)
Figure 1 Dry Construction Market, By Type
Figure 2 Dry Construction Market, By Material
Figure 3 Dry Construction Market, By System
Figure 4 Dry Construction Market, By Application
Figure 5 Dry Construction Market, By Region
Figure 6 Dry Construction Market: Research Design
Figure 7 Population Growth has Increased By 3 Billion in Three Decades
Figure 8 Total Expenditure of Middle Class Families
Figure 9 Market Size Estimation Methodology: Bottom-Up Approach
Figure 10 Market Size Estimation Methodology: Top-Down Approach
Figure 11 Data Triangulation Methodology
Figure 12 Dry Construction Market Snapshot (2015 vs. 2020): Market for Wall System is Projected to Grow at the Highest CAGR
Figure 13 Asia-Pacific is the Fastest Growing Region for the Dry Construction Market in 2014
Figure 14 Leading Market Players Adopted Investments as Their Key Stratergy During 2011-2015
Figure 15 Emerging Economies Offer Attractive Opportunities in the Dry Construction Market
Figure 16 CAGR% of Top 10 Countries in Dry Construction Market 2015
Figure 17 Boarding Segment Dominated the Dry Construction Market in 2015
Figure 18 Dry Construction Market Size (Value), By Region, 2015-2020
Figure 19 Dry Construction Market Size, By Major Country,2015 - 2020 (USD Billion)
Figure 20 Dry Construction Market Share (Value), By Application, 2020
Figure 21 Dry Construction Market in Asia-Pacific is Experiencing High Growth
Figure 22 Evolution of Dry Construction Market
Figure 23 Dry Construction Market Segmentation
Figure 24 Increased Urbanized Population & Industrialization are the Key Drivers of the Dry Construction Market
Figure 25 Share of Construction Spending, By Region, 2015 - 2020
Figure 26 Total Waste Generated in the U.K. Flooring Market in 2010
Figure 27 Value Chain Analysis: Major Value is Added During Operation & After-Sales Phase
Figure 28 Product Development & Distribution are Integral Parts of the Supply Chain
Figure 29 Acquisition of Small Players is the Most Prevailing Strategic Trend in the Dry Construction Industry
Figure 30 Porter�s Five Forces Analysis: Intensity of Rivalry is High in the Dry Construction Market
Figure 31 Dry Construction Market, By Region, 2015 - 2020 (USD Billion)
Figure 32 Supporting Framework Market Share (Value), By Region, 2014
Figure 33 Boarding Market Size, By Application, 2015-2020 (USD Billion)
Figure 34 Plasterboard Segment is Expected to Hold the Largest Market By 2020
Figure 35 Rise in Urban Population Leads to the Growth of Dry Construction Market
Figure 36 Dry Construction Market, By System, 2013�2020 (USD Billion )
Figure 37 Dry Construction Market Share (Value), By System, 2014
Figure 38 Asia-Pacific is Projected to Acquire Largest Share in Ceiling System in 2015 & 2020
Figure 39 Wall System in Asia-Pacific to Grow at Highest Pace During 2015 -2020
Figure 40 Flooring System in Asia-Pacific to Grow at the Fastest Pace (2015�2020)
Figure 41 Asia-Pacific & RoW to Dominate the Others Dry Construction System During 2015 - 2020
Figure 42 Dry Construction Market Size, By Application, 2013�2020 (USD Billion )
Figure 43 Asia-Pacific to Capture the Largest Share in Residential Application Market in 2015-2020
Figure 44 North America Growing at A Highest CAGR in Non-Residential Application Market From 2015 to 2020
Figure 45 Geographic Snapshot (2015-2020): the Markets in Asia-Pacific are Emerging as New Hot Spots in Terms of Value
Figure 46 Dry Construction Market Size, By Region, 2013�2020 (USD Billion)
Figure 47 Dry Construction Market Share ( Value), By Region, 2014
Figure 48 Asia-Pacific Dry Construction Market Snapshot: China is the Most Lucrative Market
Figure 49 Asia-Pacific Dry Construction Market Share, By Country,2014 (USD Billion)
Figure 50 European Dry Construction Market Share, By Country,2014 (USD Billion)
Figure 51 North America Snapshot: U.S. is the Largest Dry Construction Market
Figure 52 North America: Dry Construction Market Share (Value),By Country, 2014
Figure 53 RoW: Dry Construction Market Size (Value), By Country, 2014
Figure 54 Companies Adopted Various Growth Strategies in the Past Four Years
Figure 55 Etex Group Grew at the Highest Rate During 2011�2014
Figure 56 Investments: the Key Growth Strategy
Figure 57 Dry Construction Share, By Key Player, 2014
Figure 58 Market Evolution Framework
Figure 59 Armstrong World Industries: Company Snapshot
Figure 60 Etex Group: Company Snapshot
Figure 61 Fletcher Building: Company Snapshot
Figure 62 Saint Gobain: Company Snapshot
Figure 63 Xella Group: Company Snapshot
Figure 64 CSR Limited: Company Snapshot
Figure 65 USG Boral Limited: Company Snapshot


Growth opportunities and latent adjacency in Dry Construction Market