E-Compass Market by Technology (Fluxgate, Hall Effect, Magnetoresistive), Type (1&2 Axis, 3 Axis, 6 Axis, 9 Axis), Application (Consumer Electronics, Aerospace & Defense, Automotive, Surveying, Marine) and Geography - Global Forecast to 2022


The e-compass market is estimated to grow from USD 808.6 Million in 2015 to USD 2187.1 Million by 2022, at a CAGR of 14.57% between 2016 and 2022. The demand for e-compass sensors is expected to increase due to the requirement of the consumer electronics industry, especially in wearable devices market. The adoption of e-compass sensors in consumer electronics and growth of the wearable devices market is expected to drive the market. The base year considered for the study is 2015 and the e-compass market size forecast has been given for the period between 2016 and 2022.
The prime objectives of this report can be summarized in the following points.
- To define, describe, and forecast the global e-compass market on the basis of technology adopted, applications and type of sensor (degree of freedom).
- To provide market statistics with detailed classification and split in terms of value.
- To forecast the size of market segments with respect to four major regions, namely, North America, Europe, Asia-Pacific (APAC), and Rest of the World (RoW).
- To provide detailed information regarding the major factors influencing the growth of the e-compass market (drivers, restraints, opportunities, and challenges).
- To detail the industry trends, insights based on the value chain analysis, and strategic benchmarking of the e-compass market.
According to the MarketsandMarkets forecast, the e-compass market size, in terms of value, is expected to grow from USD 808.6 Million in 2015 to USD 2187.1 Million by 2022, at a CAGR of 14.57% between 2016 and 2022. The e-compass has applications across a number of verticals. The portable electronic devices deploy e-compass sensors, primarily as a navigational tool. The huge volume of sales of these devices such as smartphones, tablets, and wearables has driven the market. The development of newer compact and low-power e-compass sensors have more degree of freedom have also incentivized the adoption of these sensors. Some applications such as surveying and aerospace have relied on higher grade e-compass sensors for more reliability.
The scope of this report covers the on the basis of technology, application, sensor type, and geography. The consumer electronics application is expected to hold the largest e-compass market share during the forecast period, whereas the automotive application application is likely grow at the highest rate during the forecast period.
The Hall effect-based e-compass sensors accounted for the largest e-compass market share in 2015. The e-compass market for magnetoresistive e-compass sensors are expected to grow at the highest rate during the forecast period. The Hall effect sensors are much economical in terms of cost as well as have been “miniaturized” in the form of ICs for a long time, therefore are most widely used. Magnetoresistive e-compass sensors are extremely accurate but also much more costly as compared to Hall effect-based e-compass, as the need for high precision navigation in sectors such as automotive increases the magnetoresistive e-compass sensors will see a rapid growth in adoption.
The e-compass market for the 1- and 2-axis e-compass sensors are expected to grow at the highest rate during the forecast period. The critical sectors such as aviation, defense, and marine require high grade 1- and 2-axis sensors for their operation. Extensive investment in research and development in these sectors and constant need for upgradation to better equipment drives this segment.
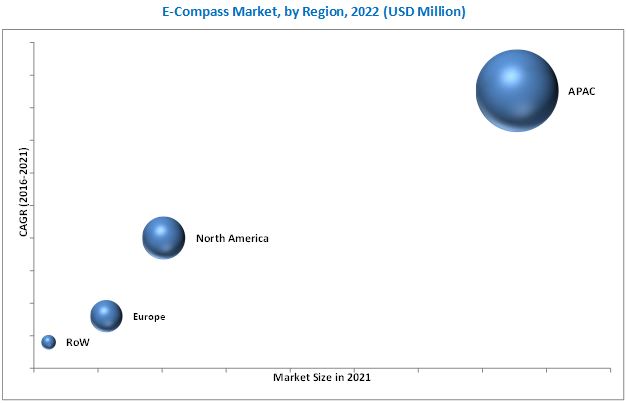
The APAC region is expected to hold the largest e-compass market share and dominate the between 2016 and 2022. The APAC region is also expected to grow at the highest rate. The large number of consumer electronics manufacturers which buy e-compass sensors are located in the region, and the demand for portable electronics products which deploy these sensors is also growing which has resulted in the domination of the APAC region in the e-compass market.
Major deterrent for the growth of usage of GPS technology, whose adoption is widespread. The advances in automated vehicles and augmented reality can prove to be a good revenue pockets for the market. The major vendors in the e-compass market include Asahi Kasei Microdevices Corporation (Japan), Aichi Steel Corporation (Japan), Bosch Sensortec GmbH (Germany), Honeywell International Inc. (U.S.), and NXP Semiconductors (Netherlands), among others. These players adopted various strategies such as new product launches & developments, partnerships, collaborations, business expansions and mergers to cater to the needs of the optical interconnect market.
To speak to our analyst for a discussion on the above findings, click Speak to Analyst
 Exclusive indicates content/data unique to MarketsandMarkets and not available with any competitors.
Table of Contents
1 Introduction (Page No. - 13)
1.1 Objectives of the Study
1.2 Market Definition
1.3 Scope of the Study
1.3.1 Markets Covered
1.3.2 Years Considered in the Study
1.4 Currency
1.5 Package Size
1.6 Limitations
1.7 Market Stakeholders
2 Research Methodology (Page No. - 17)
2.1 Research Data
2.1.1 Secondary Data
2.1.1.1 Key Data From Secondary Sources
2.1.2 Primary Data
2.1.2.1 Key Data From Primary Sources
2.1.2.2 Key Industry Insights
2.1.2.3 Breakdown of Primaries
2.2 Market Size Estimation
2.3 Market Breakdown & Data Triangulation
2.4 Research Assumption
3 Executive Summary (Page No. - 25)
4 Premium Insights (Page No. - 30)
4.1 Attractive Opportunities in the Global Market
4.2 Regional and Application Wise Snapshot of Market
4.3 Market, By Application
4.4 Market, By Technology
4.5 Market, By Sensor Type
4.6 Market, By Geography
5 Market Overview (Page No. - 33)
5.1 Introduction
5.2 Market Segmentation
5.2.1 Market Market, By Technology
5.2.2 Market, By Application
5.2.3 Market, By Sensor Type
5.2.4 Market Market By Geography
5.3 Recent Trends
5.4 Market Dynamics
5.4.1 Drivers
5.4.1.1 Adoption of E-Compass Sensors in Consumer Electronics
5.4.1.2 Growth of the Wearable Devices Market
5.4.1.3 Use of E-Compasses in Uavs and Auvs
5.4.2 Restraints
5.4.2.1 Widespread Usage of GPS Technology
5.4.2.2 Changing Geomagnetic Maps
5.4.3 Opportunities
5.4.3.1 Upcoming Autonomous Cars Market
5.4.3.2 Potential Use in Augmented Reality and Gaming Applications
5.4.4 Challenges
5.4.4.1 Data Accuracy and Calibration Issues
6 Industry Trends (Page No. - 40)
6.1 Introduction
6.2 Value Chain Analysis
6.3 Porter’s Five Forces Analysis
6.3.1 Bargaining Power of Suppliers
6.3.2 Bargaining Power of Buyers
6.3.3 Threat of New Entrants
6.3.4 Threat of Substitutes
6.3.5 Degree of Competition
7 Market, By Technology (Page No. - 48)
7.1 Introduction
7.2 Fluxgate
7.3 Hall Effect
7.4 Magnetoresistive
7.5 Others
8 Market, By Application (Page No. - 58)
8.1 Introduction
8.2 Consumer Electronics
8.3 Aerospace & Defense
8.4 Automotive
8.5 Marine
8.6 Surveying
8.7 Other Applications
9 Market, By Sensor Type (Page No. - 82)
9.1 Introduction
9.2 1-Axis and 2-Axis Sensors
9.3 3-Axis Sensors
9.4 6-Axis Sensors
9.5 9-Axis Sensors
10 Geographic Analysis (Page No. - 88)
10.1 Introduction
10.2 North America
10.2.1 U.S.
10.2.2 Canada
10.3 Europe
10.3.1 Germany
10.3.2 France
10.3.3 U.K.
10.3.4 Rest of Europe
10.4 Asia-Pacific
10.4.1 China
10.4.2 Japan
10.4.3 South Korea
10.4.4 Rest of APAC
10.5 Rest of the World
10.5.1 Middle East & Africa
10.5.2 Latin America
11 Competitive Landscape (Page No. - 102)
11.1 Introduction
11.2 Ranking of Market Players, 2015
11.3 Competitive Scenario & Trends
11.3.1 New Product Launches & Contracts
11.3.2 Alliances and Business Expansions
11.3.3 Mergers & Acquisitions
12 Company Profiles (Page No. - 108)
(Company at A Glance, Recent Financials, Products & Services, Strategies & Insights, & Recent Developments)*
12.1 Introduction
12.2 Aichi Steel Corporation
12.3 Honeywell International Inc.
12.4 NXP Semiconductors N.V.
12.5 Asahi Kasei Microdevices Corporation
12.6 Bosch Sensortec GmbH
12.7 ST Microelectronics N.V.
12.8 Magnachip Semiconductor
12.9 Invensense Inc.
12.10 Memsic Inc.
12.11 Oceanserver Technologies Inc.
12.12 PNI Sensors Corporation
12.13 Truenorth Technologies Ltd.
12.14 Mcube Inc.
*Details on Company at A Glance, Recent Financials, Products & Services, Strategies & Insights, & Recent Developments Might Not Be Captured in Case of Unlisted Companies.
13 Appendix (Page No. - 135)
13.1 Insights of Industry Experts
13.2 Discussion Guide
13.3 Knowledge Store: Marketsandmarkets’ Subscription Portal
13.4 Introducing RT: Real-Time Market Intelligence
13.5 Available Customizations
13.6 Related Reports
13.7 Author Details
List of Tables (67 Tables)
Table 1 E-Compass Market, By Technology, 2013–2022 (USD Million)
Table 2 Market, By Technology, 2013–2022 (Million Units)
Table 3 Market for Fluxgate Technology, By Application, 2013–2022 (USD Million)
Table 4 Market for Fluxgate Technology, By Application, 2013–2022 (Thousand Units)
Table 5 Market Market for Hall Effect Technology, By Application, 2013–2022 (USD Million)
Table 6 Market for Hall Effect Technology, By Application, 2013–2022 (Thousand Units)
Table 7 Market Market for Magnetoresistive Technology, By Application, 2013–2022 (USD Million)
Table 8 Market for Magnetoresistive Technology, By Application, 2013–2022 (Thousand Units)
Table 9 Market for Other Technologies, By Application, 2013–2022 (USD Million)
Table 10 Market for Other Technologies, By Application, 2013–2022 (Thousand Units)
Table 11 Market Market, By Application, 2013–2022 (USD Million)
Table 12 Market, By Application, 2013–2022 (Million Units)
Table 13 Market for Consumer Electronics Application, By Product Type, 2013–2022 (USD Million)
Table 14 Market for Consumer Electronics, By Product Type, 2013–2022 (Million Units)
Table 15 Market for Consumer Electronics Application, By Technology 2013–2022 (USD Million)
Table 16 Market for Consumer Electronics Application, By Technology 2013–2022 (Million Units)
Table 17 Market for Consumer Electronics Application, By Sensor Type, 2013–2022 (USD Million)
Table 18 Market for Consumer Electronics Application, By Region, 2013–2022 (USD Million)
Table 19 Market for Consumer Electronics Application, By Region, 2013–2022 (Million Units)
Table 20 Market for Aerospace & Defense Application, By Technology 2013–2022 (USD Million)
Table 21 Market for Aerospace & Defense Industry, By Technology 2013–2022 (Thousand Units)
Table 22 Market for Aerospace & Defense Application, By Sensor Type, 2013–2022 (USD Million)
Table 23 Market for Aerospace & Defense Application, By Region, 2013–2022 (USD Million)
Table 24 Market for Aerospace & Defense Application, By Region, 2013–2022 (Thousand Units)
Table 25 Market Market for Automotive Application, By Technology 2013–2022 (USD Million)
Table 26 Market for Automotive Application, By Technology 2013–2022 (Million Units)
Table 27 Market for Automotive Application, By Sensor Type, 2013–2022 (USD Million)
Table 28 Market for Automotive Application, By Region, 2013–2022 (USD Million)
Table 29 Market for Automotive Application, By Region, 2013–2022 (Million Units)
Table 30 Market for Marine Application, By Technology, 2013–2022 (USD Million)
Table 31 Market for Marine Application, By Technology, 2013–2022 (Thousand Units)
Table 32 Market for Marine Application, By Sensor Type, 2013–2022 (USD Million)
Table 33 Market for Marine Application, By Region, 2013–2022 (USD Million)
Table 34 Market for Marine Application, By Region, 2013–2022 (Thousand Units)
Table 35 Market Market for Surveying Application, By Technology, 2013–2022 (USD Million)
Table 36 Market for Surveying Application, By Technology, 2013–2022 (Thousand Units)
Table 37 Market for Surveying Application, By Sensor Type, 2013–2022 (USD Million)
Table 38 Market for Surveying Application, By Region, 2013–2022 (USD Million)
Table 39 Market for Surveying Application, By Region, 2013–2022 (Thousand Units)
Table 40 Market for Other Applications, By Technology, 2013–2022 (USD Thousand)
Table 41 Market for Other Application, By Technology, 2013–2022 (Thousand Units)
Table 42 Market for Other Applications, By Sensor Type, 2013–2022 (USD Thousand)
Table 43 Market for Other Applications, By Region, 2013–2022 (USD Thousand)
Table 44 Market for Other Applications, By Region, 2013–2022 (Thousand Units)
Table 45 Market, By Sensor Type, 2013–2022 (USD Million)
Table 46 Market for 1-& 2-Axis Sensor, By Application, 2013–2022, (USD Million)
Table 47 Market for 3-Axis Sensors, By Application, 2013–2022, (USD Million)
Table 48 Market for 6-Axis Sensors, By Application, 2013–2022, (USD Million)
Table 49 Market for 9-Axis Sensors, By Application, 2013–2022, (USD Million)
Table 50 Market, By Region, 2013–2022 (USD Million)
Table 51 Market, By Region, 2013–2022 (Million Units)
Table 52 Market in North America, By Application, 2013–2022 (USD Million)
Table 53 Market in North America, By Application, 2013–2022 (Thousand Units)
Table 54 Market in North America, By Country, 2013–2022 (USD Million)
Table 55 Market in Europe, By Application, 2013–2022 (USD Million)
Table 56 Market in Europe, By Application, 2013–2022 (Thousand Units)
Table 57 Market in Europe, By Country, 2013–2022 (USD Million)
Table 58 Market in APAC, By Application, 2013–2022 (USD Million)
Table 59 Market in APAC, By Application, 2013–2022 (Thousand Units)
Table 60 Market in APAC, By Country, 2013–2022 (USD Million)
Table 61 Market in RoW, By Application, 2013–2022 (USD Million)
Table 62 Market in RoW, By Application, 2013–2022 (Thousand Units)
Table 63 Market in RoW, By Region, 2013–2022 (USD Million)
Table 64 Ranking in the Market, 2015
Table 65 New Product Launches & Contracts in Market, 2016
Table 66 Alliances and Business Expansions in the Market 2016
Table 67 Merger & Acquisition in the Market 2015
List of Figures (58 Figures)
Figure 1 Market Segmentation
Figure 2 Market: Research Design
Figure 3 Market Size Estimation Methodology: Bottom-Up Approach
Figure 4 Market Size Estimation Methodology: Top-Down Approach
Figure 5 Data Triangulation
Figure 6 Market By, Value and Volume, 2016–2022
Figure 7 Automotive Application Expected to Grow at the Highest Rate in the Market During the Forecast Period
Figure 8 Hall Effect-Based Market, in Terms of Value and Volume, 2016 vs 2022
Figure 9 6-Axis Market Expected to Hold the Largest Size By 2022
Figure 10 Asia-Pacific Held the Largest Market Share of Market in 2015
Figure 11 Lucrative Opportunities in the Global Market Owing to the Applications in Consumer Electronics and Automotive Sector During the Forecast Period
Figure 12 APAC Region is the Dominant Market in 2015 and Expected to Grow at the Fastest Rate During the Forecast Period
Figure 13 Consumer Electronics to Remain the Largest Market During the Forecast Period
Figure 14 Magnetoresistive Technology Expected to Exhibit the Highest Growth During the Forecast Period
Figure 15 6-Axis E-Compass to Hold the Largest Size of the Market During the Forecast Period
Figure 16 Asia-Pacific to Dominate the Market During the Forecast Period
Figure 17 Drivers, Restraints, Opportunities, and Challenges of the Market
Figure 18 Expected Growth in the Number of Wearable Units Shipments
Figure 19 Value Chain Analysis of Market : Major Value Added By Component Manufacturers and System Integrators
Figure 20 Porter’s Five Forces Analysis for Market (2015)
Figure 21 Porter’s Five Forces Impact Analysis for Market (2015)
Figure 22 Bargaining Power of Suppliers Impact on Market (2015)
Figure 23 Bargaining Power of Buyers, Impact on Market (2015)
Figure 24 Threat of New Entrants Impact on Market (2015)
Figure 25 Threat of Substitutes Impact on Market (2015)
Figure 26 Degree of Competition, Impact on Market (2015)
Figure 27 Market, By Technology
Figure 28 Magnetoresistive Technology Based E-Compass Shipments Expected to Grow at the Highest Rate During the Forecast Period
Figure 29 Aerospace & Defense Application Expected to Grow at the Highest Rate in the E-Compass Sensors Market for Hall Effect Technology During the Forecast Period
Figure 30 Automotive Application to Grow at the Highest Rate in the Market for Magnetoresistive Technology During the Forecast Period
Figure 31 Market By Industry Verticals
Figure 32 Automotive Application to Grow at the Highest Rate in the Market During the Forecast Period
Figure 33 Wearable Devices Segment of Consumer Electronics Application Expected to Grow at the Highest Rate During the Forecast Period
Figure 34 APAC Region to Dominate the Market for Consumer Electronics in 2016
Figure 35 9-Axis Sensor Market for Aerospace & Defense Application to Grow at the Highest Rate During the Forecast Period
Figure 36 Fluxgate Technology Expected to Grow at the Highest Rate in the Market for Automotive Application Between 2016 and 2022
Figure 37 Magnetoresistive Technology to Grow at the Highest Rate in the Market for Marine Applications During the Forecast Period
Figure 38 APAC to Grow at the Highest Rate in the Market for Marine Application During the Forecast Period
Figure 39 9-Axis Sensors Market for Surveying Application Expected to Grow at the Highest Rate During the Forecast Period
Figure 40 Magnetoresistive Technology of the Market for Other Applications to Grow at the Highest Rate During the Forecast Period
Figure 41 Market, By Sensor Type
Figure 42 1-& 2-Axis Sensors to Grow at the Highest Rate in the Market for Sensor Type During the Forecast Period
Figure 43 Asia-Pacific Region Expected to Dominate the Market Between 2016 and 2022.
Figure 44 APAC to Dominate the Market During the Forecast Period
Figure 45 North America: Geographic Snapshot
Figure 46 Europe: Geographic Snapshot
Figure 47 APAC; Geographic Snapshot
Figure 48 Rest of the World: Geographic Snapshot
Figure 49 Companies Adopted Product Innovation as the Key Growth Strategy
Figure 50 Market Evolution Framework : New Product Launches Dominated the Growth Between 2013 and 2015
Figure 51 Battle for Market Share: New Product Launch Was the Key Strategy Adopted Between 2013 and 2015
Figure 52 Geographic Revenue Mix of Major Market Players
Figure 53 Aichi Steel Corporation: Company Snapshot
Figure 54 Honeywell International Inc: Company Snapshot
Figure 55 NXP Semiconductors: Company Snapshot
Figure 56 ST Microelectronics: Company Snapshot
Figure 57 Magnachip Semiconductors: Company Snapshot
Figure 58 Invensense Inc: Company Snapshot
This research study involves the extensive use of secondary sources, directories, and databases (such as Hoovers, Bloomberg Business, Factiva, and OneSource) to identify and collect information useful for this study. The research methodology followed in this report is explained below.
- Analysis of all the applications of e-compass sensors worldwide
- Analysis of various e-compass sensors sold to various end users
- Analysis of the penetration of e-compass sensors in various applications
- Estimation of the market size in terms of volume
- Estimation of the market size of the e-compass sensors in terms of applications across various industry verticals
- Overall market size along with data triangulation with supply-side data including product developments, supply chain, and estimated sales of products using e-compass sensors
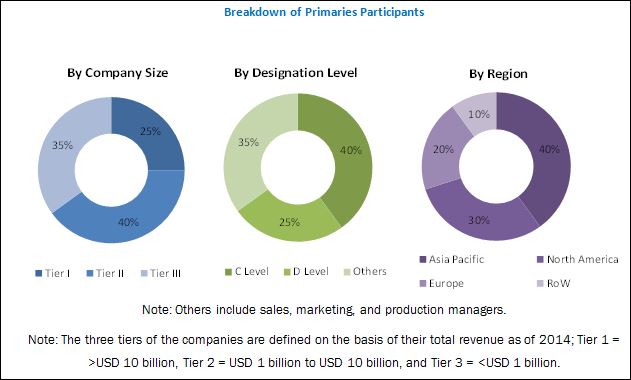
After arriving at the overall market size, the total e-compass market has been split into several segments and subsegments and confirmed with the key industry experts. The figure below shows the breakdown of primaries on the basis of company type, designation, and region.
To know about the assumptions considered for the study, download the pdf brochure
The e-compass ecosystem comprises of chip designers such as STMicroelectronics (France), mCube (U.S.), MEMSIC (U.S.) and MagnaChip (South Korea) among others; component manufacturers such as NXP Semiconductors N.V. (Netherlands), Bosch Sensortec (Germany), Asahi Kasei Microdevices (Japan), Honeywell (U.S.) among others; technology providers such as InvenSense, Inc. (U.S.), Honeywell (U.S.), and Bosch Sensortec (Germany), among others; and system integrators such as TrueNorth Technologies (U.S.), Aichi Steel (Japan), among others who integrate these e-compass sensors and sell them to end users to cater to their unique business requirements.
Key Target Audience:
- Sensor manufacturers
- Consumer electronics companies
- Aerial and marine navigators
- Surveying industry
- Distributers
- Research organizations
- Technology investors
- Organizations, alliances, and associations related to technology standards
Scope of the Report:
The research report segments the e-compass market into following submarkets:
By Technology
- Fluxgate
- Hall-Effect
- Magneto resistive
- Others
By Application
- Consumer Electronics
- Aerospace & Defense
- Automotive
- Marine
- Surveying
- Others
By Sensor Type
- 1 & 2-axis
- 3-axis
- 6-axis
- 9-axis
By Region
-
North America
- U.S.
- Canada
-
Europe
- Germany
- France
- U.K.
- Rest of Europe
-
Asia-Pacific
- China
- Japan
- South Korea
- Rest of APAC
-
Rest of the World
- Middle East & Africa
- Latin America
Available Customizations:
With the given market data, MarketsandMarkets offers customizations according to the company’s specific needs. The following customization options are available for the report:
- Company Information: Detailed analysis and profiling of additional market players (up to five)


Growth opportunities and latent adjacency in E-Compass Market
I am interested in the mobile application section for this report. And could you mention the price & cost depending on each market?