Electronic Article Surveillance Market by Component (Tags, Antennas & Detachers), Technology, End User (Apparel & Fashion Accessories Stores, Supermarket & Mass Merchandise Stores, Drug & Health Product Stores), and Geography - Global Forecast to 2036


The global electronic article surveillance market was valued at USD 1.18 billion in 2024 and is estimated to reach USD 1.99 billion by 2036, at a CAGR of 4.6% between 2025 and 2036.
The electronic article surveillance (EAS) market is driven by several key factors. Increasing incidents of retail theft and inventory shrinkage push retailers to adopt advanced loss prevention solutions. The modernization of the retail sector, with growing emphasis on digital operations, e-commerce integration, and automated inventory management, enhances the demand for EAS systems. Technological advancements, such as RF, AM, and RFID-enabled solutions, improve detection accuracy and operational efficiency. Additionally, the expansion of retail chains globally, rising consumer footfall, and heightened focus on protecting high-value merchandise in sectors like apparel, supermarkets, and pharmacies further propel the growth of the EAS market.

Electronic Article Surveillance (EAS) is a retail security technology designed to prevent theft and reduce inventory shrinkage by detecting unauthorized removal of merchandise. EAS systems use tags or labels attached to products, which trigger alarms at detection gates if not deactivated or removed at checkout. Key features include high detection accuracy, real-time alerts, integration with inventory management, compatibility with RF, AM, or RFID technologies, and scalability for various store sizes. End-users span multiple retail segments, including apparel and fashion stores, supermarkets and mass merchandise outlets, and drug and health product stores, where theft prevention and operational efficiency are critical.
Market by End-User
Apparel and Fashion Accessries Stores
The Apparel and Fashion Accessories segment is a major end-user in the Electronic Article Surveillance (EAS) market, driven by the high risk of theft and inventory shrinkage in clothing and accessory stores. Retailers increasingly deploy EAS systems, including RF and AM technologies, to protect high-value merchandise such as apparel, handbags, shoes, and jewelry. The adoption of EAS in this segment enhances loss prevention, inventory management, and customer experience, allowing staff to focus on service rather than constant monitoring. The growing demand for branded fashion, expansion of retail chains, and rising consumer footfall continue to propel the integration of EAS solutions in this sector globally.
Supermarket and Mass Merchandise Stores
The Supermarket and Mass Merchandise Stores segment represents a significant end-user market for Electronic Article Surveillance (EAS) systems, as these outlets face high-volume foot traffic and a greater risk of shoplifting. EAS technologies, including Radio-Frequency (RF) and Acousto-Magnetic (AM) systems, are widely implemented to protect a broad range of products, from packaged goods to household items. Adoption of EAS enhances inventory accuracy, loss prevention, and operational efficiency, enabling retailers to maintain profitability while ensuring a seamless shopping experience. The growing expansion of supermarkets and hypermarkets, coupled with increasing consumer awareness, continues to drive demand for EAS solutions in this sector globally.
Drug and Health Product Stores
The Drug and Health Product Stores segment is an important end-user in the Electronic Article Surveillance (EAS) market, given the high value and theft-prone nature of pharmaceutical and healthcare products. Retailers deploy EAS systems, including RF and AM technologies, to secure medicines, supplements, and personal care items, minimizing inventory shrinkage and ensuring compliance with regulatory requirements. These systems not only enhance loss prevention but also improve operational efficiency by integrating with inventory management solutions. Rising consumer spending on healthcare, the expansion of pharmacy chains, and the need to protect high-value products are driving the adoption of EAS solutions in drugstores and health product outlets globally.
Market by Sensor Type
Radio-Frequency (RF) technology
Radio-Frequency (RF) technology is a widely used method in the Electronic Article Surveillance (EAS) market, offering effective theft prevention and inventory management in retail environments. RF systems utilize electromagnetic fields to detect security tags attached to merchandise, triggering alarms when unauthorized removal occurs. This technology is favored for its reliability, cost-effectiveness, and ease of installation in both small and large retail stores. Recent advancements include integration with RFID and IoT, enabling real-time inventory tracking, analytics, and improved operational efficiency. The adoption of RF-based EAS continues to grow globally, driven by increasing retail modernization and the need to reduce shrinkage and losses.
Acousto-Magnetic (AM)
Acousto-Magnetic (AM) technology is a prominent solution in the Electronic Article Surveillance (EAS) market, widely used for loss prevention in retail settings. AM systems operate by attaching specialized tags to merchandise, which resonate at a specific frequency when exposed to a magnetic field at the detection gates, triggering an alarm if removed without deactivation. This technology is favored for its high detection accuracy, resistance to interference, and long read range, making it suitable for high-value or high-traffic retail environments. Increasing adoption of AM-based EAS, alongside integration with RFID and IoT systems, enhances inventory management and operational efficiency, supporting global retail security needs.
Market by Geography:
Geographically, the electronic article surveillance market is experiencing widespread adoption across North America, Europe, Asia Pacific, and the Middle East & Africa. The Electronic Article Surveillance (EAS) market shows varied growth across regions. North America leads due to advanced retail infrastructure, high adoption of technology-driven solutions, and stringent loss prevention requirements. Asia-Pacific is witnessing rapid growth, fueled by expanding retail chains, urbanization, and rising consumer awareness, with countries like China, Japan, and India emerging as key markets. Europe follows, driven by mature retail markets, strong DIY culture, and increasing integration of RFID and IoT-based EAS systems. The Rest of the World (RoW), including South America and the Middle East & Africa, shows moderate adoption due to cost constraints and developing retail infrastructure, but gradual modernization supports steady growth
Market Dynamics
Driver: Moderning retail sector
The Electronic Article Surveillance (EAS) market is experiencing significant growth, driven by the modernization of the retail sector. Retailers are increasingly adopting advanced EAS systems to enhance security, streamline inventory management, and improve customer experience. Technological advancements, such as the integration of RFID, AI, and IoT, are making EAS systems more efficient, accurate, and versatile, thereby driving their adoption across the retail sector. Additionally, the shift towards wireless and cloud-based EAS solutions is reducing installation and maintenance costs, offering greater flexibility and scalability for retailer. This modernization aligns with the increasing need for retailers to protect against inventory losses, shoplifting, and theft, which are significant concerns in the evolving retail landscapes.
Restraint: Additional investments required to implement EAS systems
Implementing Electronic Article Surveillance (EAS) systems presents a significant financial commitment for retailers, particularly for small to mid-sized businesses. The initial investment encompasses the purchase of hardware components such as detection gates, deactivation devices, and security tags. Additionally, there are ongoing costs associated with maintenance, software updates, and staff training. These expenses can strain budgets, especially for retailers operating on thin margins. Consequently, the substantial upfront and recurring costs serve as a barrier to the widespread adoption of EAS systems, despite their effectiveness in reducing theft and inventory loss
Opportunity: Growing Inclination towards digital operation
The growing inclination towards digital operations presents a significant opportunity for the Electronic Article Surveillance (EAS) market. As retailers increasingly adopt digital technologies, integrating EAS systems with Internet of Things (IoT) and Radio Frequency Identification (RFID) technologies has become more prevalent. This integration enables real-time tracking of inventory, enhances loss prevention measures, and improves overall operational efficiency. For instance, the implementation of advanced EAS systems has been shown to reduce theft-related losses by up to 30% to 60%, depending on the business type and solution effectiveness. Additionally, the expansion of the retail sector, particularly in emerging markets, further drives the demand for sophisticated EAS solutions. These developments underscore the growing importance of digital operations in enhancing the effectiveness and adoption of EAS systems
Challenge: Reluctance towards retailers
Retailers often hesitate to adopt Electronic Article Surveillance (EAS) systems due to concerns over the substantial initial investment and ongoing maintenance costs. The integration of advanced technologies, such as Radio Frequency Identification (RFID), adds complexity and expense, which can be particularly burdensome for small to mid-sized businesses. Moreover, the potential disruption to existing store layouts and operations during EAS system installation poses additional challenges. These factors contribute to a reluctance among retailers to implement EAS solutions, despite their effectiveness in reducing inventory shrinkage and enhancing security..
Future Outlook
The future of the Electronic Article Surveillance (EAS) market appears promising, with steady growth anticipated in the coming years. This growth is driven by the increasing need for effective loss prevention solutions in retail environments, particularly as incidents of retail theft continue to rise. Technological advancements, such as the integration of Radio Frequency Identification (RFID) and Internet of Things (IoT) technologies, are enhancing the capabilities of EAS systems, making them more efficient and appealing to retailers. Additionally, the expansion of retail infrastructure in emerging markets is contributing to the global demand for EAS solutions. Overall, the EAS market is poised for consistent growth, driven by technological innovations and the ongoing need for robust security measures in the retail sector.
Key Market Players
Key Electronic article surveillance companies Johnson Controls (US), Nedap N.V (Netherlands), Checkpoint Systems, Inc (US), Avery Dennison Corporation (US ) Ketec Inc. (South Korea), among others.
Key Questions addressed in this report:
- What are the global trends in demand for the market?
- What are the upcoming technologies/product areas that will have a significant impact on the market in the future?
- What will be the revenue pockets for the market players in the next 10 years?
- What are the prime strategies followed by key players in the market?
 Exclusive indicates content/data unique to MarketsandMarkets and not available with any competitors.
Table of Contents
1 Introduction (Page No. - 14)
1.1 Study Objectives
1.2 Definition
1.3 Study Scope
1.3.1 Geographic Coverage
1.3.2 Years Considered
1.4 Currency
1.5 Package Size
1.6 Stakeholders
2 Research Methodology (Page No. - 17)
2.1 Research Data
2.1.1 Secondary Data
2.1.1.1 Key Data From Secondary Sources
2.1.2 Primary Data
2.1.2.1 Key Data From Primary Sources
2.1.2.2 Breakdown of Primaries
2.2 Market Size Estimation
2.2.1 Bottom-Up Approach
2.2.2 Top-Down Approach
2.3 Market Breakdown and Data Triangulation
2.4 Research Assumptions
3 Executive Summary (Page No. - 26)
4 Premium Insights (Page No. - 29)
4.1 Attractive Opportunities in Overall Electronic Article Surveillance Market
4.2 Electronic Article Surveillance Market, By End User
4.3 Electronic Article Surveillance Market in APAC, By End User and Country
4.4 Electronic Article Surveillance Market, By Geography
5 Market Overview (Page No. - 32)
5.1 Introduction
5.2 Market Dynamics
5.2.1 Drivers
5.2.1.1 Protection Against Inventory Losses, Shoplifting, and Theft
5.2.1.2 Modernizing Retail Sector
5.2.2 Restraints
5.2.2.1 Additional Investment Required to Implement EAS Systems
5.2.2.2 High Adoption Rate of RFID Technology in Retail Sector
5.2.3 Opportunities
5.2.3.1 Growing Inclination Toward Digital Operations
5.2.3.2 High Growth Potential in Emerging Economies
5.2.4 Challenges
5.2.4.1 Reluctance of Retailers
6 Electronic Article Surveillance Market, By Component (Page No. - 36)
6.1 Introduction
6.2 Tags
6.2.1 Tags to Dominate EAS Market With Largest Share During Forecast Period
6.3 Antennas
6.3.1 Growing Adoption of EAS Systems for Protection Against Inventory Loss to Drive Growth of Market for Antennas During Forecast Period
6.4 Deactivators/Detachers
6.4.1 Increasing Number of Retail Stores to Drive Growth of Market for Detachers During Forecast Period
7 Electronic Article Surveillance Market, By Technology (Page No. - 40)
7.1 Introduction
7.2 Acoustomagnetic
7.2.1 Apparel and Fashion Accessories Stores to Be Major Users of EAS Systems for Acoustomagneric Technology During Forecast Period
7.3 Electromagnetic
7.3.1 Increasing Number of Retail Stores to Drive the Growth of EAS Market for EM Technology During Forecast Period
7.4 Radio Frequency
7.4.1 Rf Technology to Dominate EAS Market With Largest Market Share During Forecast Period
7.5 Microwave
7.5.1 Modernizing Retail Sector Driving the Growth of EAS Market for Microwave Technology
8 Electronic Article Surveillance Market, By End User (Page No. - 44)
8.1 Introduction
8.2 Apparel and Fashion Accessories Stores
8.2.1 Apparel and Fashion Accessories Stores to Hold Major Share of the EAS Market During Forecast Period
8.3 Supermarkets and Mass Merchandise Stores
8.3.1 Supermarkets and Mass Merchandise to Witness Highest Growth Rate for EAS Market During Forecast Period
8.4 Drug and Health Product Stores
8.4.1 North America to Hold Major Share of EAS Market for Drug and Health Product Stores During Forecast Period
8.5 Others
8.5.1 APAC to Witness Highest Growth Rate for EAS Market for Other End User During Forecast Period
9 Geographic Analysis (Page No. - 50)
9.1 Introduction
9.2 North America
9.2.1 US
9.2.1.1 US to Hold Major Share of EAS Market in North America During Forecast Period
9.2.2 Canada
9.2.2.1 Increasing Number of Global Retailers Drives Growth of EAS Market in Canada
9.2.3 Mexico
9.2.3.1 Apparels and Fashion Accessories Stores, and Supermarkets and Mass Merchandise Stores to Be Major Users of EAS Systems in Mexico
9.3 Europe
9.3.1 UK
9.3.1.1 UK to Witness Surge in Demand for EAS Systems During Forecast Period
9.3.2 Germany
9.3.2.1 Germany to Lead EAS Market in Europe With Largest Size During Forecast Period
9.3.3 France
9.3.3.1 High Number of Apparel and Fashion Accessories, and Supermarket Stores to Contribute to Market in France
9.3.4 Spain
9.3.4.1 Growing Investment in Retail Sector for Upgrading Stores Drives Growth of EAS Market in Spain
9.3.5 Italy
9.3.5.1 Growing Retail Space in Italy to Propel Growth of EAS Market During Forecast Period
9.3.6 Rest of Europe
9.3.6.1 Market in Rest of Europe to Grow on Back of Apparel and Fashion Accessories Stores, and Supermarkets and Mass Merchandise Stores
9.4 APAC
9.4.1 China
9.4.1.1 China to Dominate EAS Market in APAC With Largest Market Share During Forecast Period
9.4.2 Japan
9.4.2.1 Japan to Witness High Demand for EAS Systems for Apparel and Fashion Accessories and Supermarket Stores During Forecast Period
9.4.3 South Korea
9.4.3.1 Elevating Number of Shopping Malls and Retail Outlets Driving Growth of EAS Market in South Korea
9.4.4 India
9.4.4.1 India to Register High CAGR in EAS Market in APAC During Forecast Period
9.4.5 Rest of APAC
9.4.5.1 EAS Market to Grow Rapidly in Australia, Taiwan, Thailand, and Singapore During Forecast Period
9.5 RoW
9.5.1 Middle East and Africa
9.5.1.1 High Growth Opportunities are Expected in Middle East and Africa During Forecast Period
9.5.2 South America
9.5.2.1 Growing Urbanization and Increasing Number of Retail Stores Drives Growth of EAS Market in South America
10 Competitive Landscape (Page No. - 77)
10.1 Overview
10.2 Ranking Analysis of Key Players in EAS Market
10.3 Competitive Situations and Trends
10.3.1 Product Launches and Developments
10.3.2 Agreements, Partnerships, Collaborations, and Joint Developments
10.3.3 Expansions
11 Company Profiles (Page No. - 83)
(Business Overview, Products Offered, Recent Developments, SWOT Analysis, MnM View)*
11.1 Key Players
11.1.1 Checkpoint Systems
11.1.2 Johnson Controls
11.1.3 Nedap
11.1.4 Gunnebo Gateway
11.1.5 Hangzhou Century
11.1.6 Ketec
11.1.7 Agon Systems
11.1.8 All-Tag Corporation
11.1.9 Amersec
11.1.10 Tag Company
11.2 Other Key Players
11.2.1 WG Security Products
11.2.2 Shenzhen Emeno Technology
11.2.3 Cross Point
11.2.4 Takachiho Koheki Co
11.2.5 Stanley Security
11.2.6 Shopguard Systems
11.2.7 Dexilon Automation
11.2.8 Feltron Security Systems
11.2.9 Sentry Custom Security
11.2.10 Softdel
*Details on Business Overview, Products Offered, Recent Developments, SWOT Analysis, MnM View Might Not Be Captured in Case of Unlisted Companies.
12 Appendix (Page No. - 106)
12.1 Discussion Guide
12.2 Knowledge Store: Marketsandmarkets’ Subscription Portal
12.3 Available Customization
12.4 Related Reports
12.5 Author Details
List of Tables (32 Tables)
Table 1 Electronic Article Surveillance Market, By Component, 2016–2024 (USD Million)
Table 2 Electronic Article Surveillance Market, By Technology, 2016–2024 (USD Million)
Table 3 Electronic Article Surveillance Market, By End User, 2016–2024 (USD Million)
Table 4 Electronic Article Surveillance Market for Apparel and Fashion Accessories, By Region, 2016–2024 (USD Million)
Table 5 Electronic Article Surveillance Market for Supermarkets and Mass Merchandise, By Region, 2016–2024 (USD Million)
Table 6 Electronic Article Surveillance Market for Drug and Health Store, By Region, 2016–2024 (USD Million)
Table 7 Electronic Article Surveillance Market for Others, By Region, 2016–2024 (USD Million)
Table 8 Electronic Article Surveillance Market, By Region, 2016–2024 (USD Million)
Table 9 Electronic Article Surveillance Market in North America, By Country, 2016–2024 (USD Million)
Table 10 Electronic Article Surveillance Market in North America, By End User, 2016–2024 (USD Million)
Table 11 Electronic Article Surveillance Market in US, By End User, 2016–2024 (USD Million)
Table 12 Electronic Article Surveillance Market in Canada, By End User, 2016–2024 (USD Million)
Table 13 Electronic Article Surveillance Market in Mexico, By End User, 2016–2024 (USD Million)
Table 14 Electronic Article Surveillance Market in Europe, By Country, 2016–2024 (USD Million)
Table 15 Electronic Article Surveillance Market in Europe, By End User, 2016–2024 (USD Million)
Table 16 Electronic Article Surveillance Market in UK, By End User, 2016–2024 (USD Million)
Table 17 Electronic Article Surveillance Market in Germany, By End User, 2016–2024 (USD Million)
Table 18 Electronic Article Surveillance Market in France, By End User, 2016–2024 (USD Million)
Table 19 Electronic Article Surveillance Market in Spain, By End User, 2016–2024 (USD Million)
Table 20 Electronic Article Surveillance Market in Italy, By End User, 2016–2024 (USD Million)
Table 21 Electronic Article Surveillance Market in Rest of Europe, By End User, 2016–2024 (USD Million)
Table 22 Electronic Article Surveillance Market in APAC, By Country, 2016–2024 (USD Million)
Table 23 Electronic Article Surveillance Market in APAC, By End User, 2016–2024 (USD Million)
Table 24 Electronic Article Surveillance Market in China, By End User, 2016–2024 (USD Million)
Table 25 Electronic Article Surveillance Market in Japan, By End User, 2016–2024 (USD Million)
Table 26 Electronic Article Surveillance Market in South Korea, By End User, 2016–2024 (USD Million)
Table 27 Electronic Article Surveillance Market in India, By End User, 2016–2024 (USD Million)
Table 28 Electronic Article Surveillance Market in Rest of APAC, By End User, 2016–2024 (USD Million)
Table 29 Electronic Article Surveillance Market in RoW, By Country, 2016–2024 (USD Million)
Table 30 Electronic Article Surveillance Market in RoW, By End User, 2016–2024 (USD Million)
Table 31 Electronic Article Surveillance Market in Middle East and Africa, By End User, 2016–2024 (USD Million)
Table 32 Electronic Article Surveillance Market in South America, By End User, 2016–2024 (USD Million)
List of Figures (34 Figures)
Figure 1 Markets Covered
Figure 2 Electronic Article Surveillance Market: Process Flow of Market Size Estimation
Figure 3 Electronic Article Surveillance Market: Research Design
Figure 4 Market Size Estimation Methodology: Bottom-Up Approach
Figure 5 Market Size Estimation Methodology: Top-Down Approach
Figure 6 Data Triangulation
Figure 7 Assumptions for Research Study
Figure 8 Apparel and Fashion Accessories Stores to Dominate Electronic Article Surveillance Market During Forecast Period
Figure 9 Electronic Article Surveillance Market for Tags to Grow at Higher CAGR During Forecast Period
Figure 10 APAC to Be Register Highest CAGR in Electronic Article Surveillance Market During Forecast Period
Figure 11 Increasing Adoption of Electronic Article Surveillance Systems for Protection Against Inventory Losses, Shoplifting, and Theft and Modernizing Retail Sector is Major Market Drivers
Figure 12 Apparel and Fashion Accessories Stores to Account for Largest Size of Electronic Article Surveillance Market During Forecast Period
Figure 13 Apparel and Fashion Accessories Stores and China as Largest Shareholders in Electronic Article Surveillance Market in APAC in 2018
Figure 14 India and China to Witness High CAGR in Electronic Article Surveillance Market By 2024
Figure 15 Protection Against Inventory Losses, Shoplifting, and Theft Incidences Drives Electronic Article Surveillance Market
Figure 16 Tags to Register Higher CAGR in Electronic Article Surveillance Market During Forecast Period
Figure 17 Electronic Article Surveillance Market for Radio Frequency to Grow at Highest CAGR During Forecast Period
Figure 18 Electronic Article Surveillance Market for Supermarkets and Mass Merchandise to Grow at Highest CAGR During Forecast Period
Figure 19 Geographic Snapshot of Electronic Article Surveillance Market
Figure 20 North America to Hold Largest Size of Electronic Article Surveillance Market During Forecast Period
Figure 21 US to Dominate Electronic Article Surveillance Market in North America During Forecast Period
Figure 22 North America: Electronic Article Surveillance Market Snapshot
Figure 23 Germany to Register Highest CAGR in Electronic Article Surveillance Market During Forecast Period
Figure 24 Europe: Electronic Article Surveillance Market Snapshot
Figure 25 India to Register Highest CAGR in Electronic Article Surveillance Market in APAC During Forecast Period
Figure 26 APAC: Electronic Article Surveillance Market Snapshot
Figure 27 Middle East to Register Highest CAGR in Electronic Article Surveillance Market in RoW During Forecast Period
Figure 28 Key Developments By Leading Players in Market From 2016 to 2018
Figure 29 Ranking of Key Players in EAS Market (2018)
Figure 30 Product Launches and Developments Were Key Strategies Adopted By Major Players From 2016 to 2018
Figure 31 CCL Industries: Company Snapshot
Figure 32 Johnson Controls: Company Snapshot
Figure 33 Nedap: Company Snapshot
Figure 34 Gunnebo Group: Company Snapshot
The study involved four major activities for estimating the size of the electronic article surveillance market. Exhaustive secondary research was done to collect information on the market, including its peer markets. The next step was to validate these findings, assumptions, and sizing with industry experts across the value chain through primary research. Both top-down and bottom-up approaches were employed to estimate the complete market size. After that, market breakdown and data triangulation were used to estimate the market size of segments and subsegments.
Secondary Research
In the secondary research process, various secondary sources have been referred to for identifying and collecting information important for this study. Secondary sources include corporate filings (such as annual reports, press releases, investor presentations, and financial statements); trade, business, and professional associations; white papers, EAS-based marketing-related journals, certified publications, and articles from recognized authors; gold and silver standard websites; directories; and databases.
Secondary research has been conducted to obtain key information about the industry’s supply chain, market’s monetary chain, the total pool of key players, and market segmentation according to industry trends to the bottom-most level, geographic markets, and key developments from both market and technology-oriented perspectives. The secondary data has been collected and analyzed to arrive at the overall market size, which has further been validated by primary research.
Primary Research
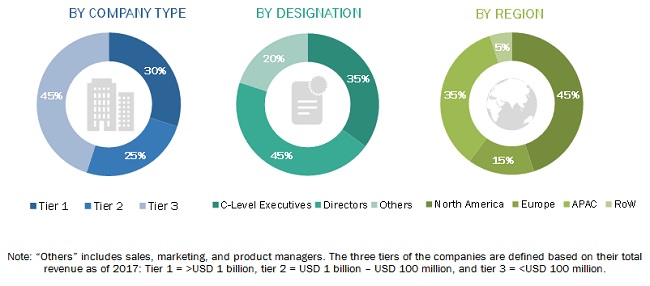
In the primary research process, various primary sources from the supply and demand sides have been interviewed to obtain the qualitative and quantitative information relevant to this report. Primary sources from the supply side include key industry participants, subject matter experts (SMEs), C-level executives of key companies, and consultants from various key companies and organizations operating in the electronic article surveillance market.
After the complete market engineering (including calculations for market statistics, market breakdown, market size estimations, market forecasting, and data triangulation), extensive primary research has been conducted to verify and validate critical market numbers.
Primary research has also been conducted to identify segmentation types and key players, as well as analyze the competitive landscape, key market dynamics (drivers, restraints, opportunities, and challenges), and major growth strategies adopted by market players. During market engineering, both top-down and bottom-up approaches have been extensively used, along with several data triangulation methods, to estimate and forecast the market, including the overall market segments and subsegments listed in this report. Extensive qualitative and quantitative analyses have been performed during the complete market engineering process to list the key information/insights throughout the report.
To know about the assumptions considered for the study, download the pdf brochure
Market Size Estimation
In the market engineering process, both top-down and bottom-up approaches, along with several data triangulation methods, have been used to estimate and validate the size of the overall market and other dependent submarkets listed in this report. Extensive qualitative and quantitative analyses have been performed during market engineering to list key information/insights.
Major players in the market have been identified through secondary research, and their market ranking has been determined through primary and secondary research. This involved studying the annual and financial reports of top market players, and interviews with industry experts (such as CEOs, vice presidents, directors, and marketing executives) for key insights—both quantitative and qualitative.
All percentage shares, splits, and breakdowns have been determined using secondary sources and verified through primary sources. All possible parameters that affect the markets covered in this research study have been accounted for, viewed in extensive detail, verified through primary research, and analyzed to obtain the final quantitative and qualitative data. This data has been consolidated and supplemented with detailed inputs and analysis from MarketsandMarkets and presented in this report.
Data Triangulation
After arriving at the overall market size through the process explained above, the total market has been split into several segments. To complete the overall market engineering process and arrive at the exact statistics for all the segments, the market breakdown and data triangulation procedures have been employed, wherever applicable. The data has been triangulated by studying various factors and trends from both the demand and supply sides. The market has also been validated using both top-down and bottom-up approaches.
Study Objectives
- To define and describe the electronic article surveillance market, in terms of value, by component, technology, end user, and Geography
- To forecast the electronic article surveillance market, in terms of value, by region—North America, Europe, Asia Pacific (APAC), and Rest of the World (RoW)
- To provide detailed information regarding major factors influencing market growth (drivers, restraints, opportunities, and challenges)
- To identify the opportunities for various stakeholders such as electronic article surveillance system manufacturers, component suppliers, and brand product manufacturers by identifying high-growth segments and emerging use cases of the electronic article surveillance market
- To strategically analyze micro-markets with regard to individual growth trends, prospects, and contributions to the total market
-
To strategically profile key players and comprehensively analyze their market position in
terms of ranking and core competencies, along with detailing competitive landscape for market leaders - To analyze strategic approaches such as product launches, acquisitions, contracts, agreements, and partnerships in the electronic article surveillance market
Available Customization
With the given market data, MarketsandMarkets offers customizations according to companies’ specific needs. The following customization options are available for the report.
- Detailed analysis and profiling of additional market players (up to 5)


Growth opportunities and latent adjacency in Electronic Article Surveillance Market