E-Waste Management Market by Material Recovery (Metals, Plastic, & Glass), Source type (Household Appliances, Entertainment & Consumer Electronics, & IT & Telecommunication), and by Geography - Forecast to 2020


The average lifespan of most electronic gadgets has been persistently sinking. Fast obsolescence of electronic gadgets has become one of the major factors leading to the generation of electronic waste. The electronic items which have reached end-of-life for the user are termed as e-waste. These items contain materials that have high value but at the same time, they can lead to environmental risks if they are land filled or incinerated.
Electronic Waste Recycling Market Insights and Growth Prospects:
The electronic waste recycling market is gaining momentum as the global demand for sustainable waste management solutions rises. Driven by the increasing consumption of electronic devices and the rapid pace of technological advancements, e-waste recycling helps recover valuable materials such as metals, plastics, and glass while reducing environmental harm. Factors like stringent environmental regulations, awareness of the hazards of improper e-waste disposal, and advancements in recycling technologies are fueling the market's growth. Additionally, the push toward a circular economy and initiatives to reduce raw material dependency further enhance its significance. Key players are focusing on innovative processes to improve recycling efficiency and cater to various industrial applications.
This report is based on an in-depth research study on the e-waste management market, on the bases of the material recovered after recycling and the source of these materials for e-waste. Among the total solid waste generated globally, e-waste has a good share which is required to be treated properly to avoid the ill effects on the environment and human health. The report has estimated that household appliances among all the sources of e-waste generation have the major share. The e-waste recyclers and institutions working for the e-waste management are also encouraged by the government rules and regulations to come up with the advanced technological advancements of the recycling methods in developing nations. The report targets these recycling companies in the market.
The report provides the profiles of the major active companies in the e-waste management market. The recent developments, adoption of technologies, and agreements to strengthen the growth of this market are also briefly discussed. The report provides the competitive landscape of the key players which indicates their growth strategies in terms of the market.
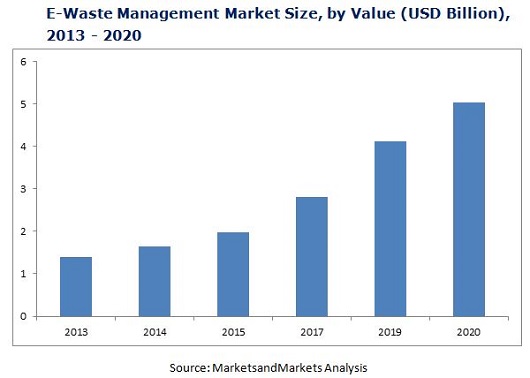
The report also presents e-waste management market dynamics such as the drivers, restraints, opportunities, and challenges. Apart from the in-depth view on the market segmentation, the report also includes the critical market data and qualitative information for each type, along with the qualitative analysis such as the Porter’s five forces analysis, value chain analysis, and market breakdown analysis. The electronic waste recycling market was worth USD 1.66 Billion in 2014 and is estimated to grow at a CAGR of 20.6% between 2015 and 2020. The largest source of e-waste generated is through household appliances and the largest material recycled is metal, followed by plastic.
The market covered under this report has been segmented as follows:
By Material Recovery:
The e-waste management market segmented on the basis of material recovery includes metals, plastic, glass, and others including material recovered from PCBs, wood, and ceramics.
By Source Type:
The e-waste management market segmented on the basis of source type is categorized into household appliances, IT & Telecommunications, entertainment and consumer electronics, and others including medical equipment, toys, and lighting equipment.
By Geography:
The electronic waste recycling market segmented on the basis of geography is divided into the Americas, Europe, Asia-Pacific, and the Rest of the World (RoW); the regional analysis is further carried out on the basis of countries.
The major players in this e-waste management market include Aurubis AG (Germany), Boliden AB (Sweden), MBA Polymers, Inc. (California), Electronic Recyclers International, Inc. (U.S.), Sims Metal Management Ltd. (Australia), Umicore S.A. (Belgium), Stena Technoworld AB (Sweden), Tetronics (International) Ltd. (U.K.), Enviro-Hub Holdings Ltd. (Singapore), and Global Electric Electronic Processing Inc. (Canada).
The available customizations for the report can offer further country-wise segmentation of the e-waste management in terms of value and volume, quantitative data of rules and regulations of governments for countries, and profiling of any additional companies in the report.
The typical life cycle of an electronic product goes through the phases like, introduction, growth, maturity, and disposal or recycling. An electronic product reaches to the recycle stage either because of end of its life cycle or technology advancements, or even owing to the changing requirements of consumers. The technology advancement is resulted in the new product development which is replacing the old technological products. People are following the trend of replacing old products with technically advanced products which leads to the generation of a huge e-waste market.
The global e-waste management market size is projected to reach USD 5.04 Billion till 2020 at an estimated CAGR of 20.6% between 2015 and 2020 from USD 1.66 Million in 2014.
The whole value chain in the e-waste management consists of source for e-waste, collection process , recycling, and recovered material for sales. In the recycling process of e-waste, the materials such as copper, aluminum, gold, silver, plastic, glass, and many others can be extracted. These recycled products/materials are again utilized for the manufacturing of electronic and non-electronic products.
The report summarizes the generation of e-waste across the world, in terms of volume, on basis of different types of sources of e-waste and the volume and value of the total e-waste recycled out of the total e-waste generated. The material recovered from e-waste by using different recycling techniques to make the e-waste management more effective and avoid the hazardous effects that may occur due to the improper treatment of waste like landfilling and incineration.
The e-waste management market size is expected to grow at a CAGR of 20.6% between 2015 and 2020, from the market size of USD 1.66 Billion in 2014. This report focuses on the detailed segmentation of the market, combined with the qualitative and quantitative analysis of each and every aspect of the classification on the basis of materials recovered, source types, and geographies. All the numbers, at every level of detail, are estimated till 2020 to give a glimpse of the potential market size in terms of value in this market.
The major players in this e-waste management market include Aurubis AG (Germany), Boliden AB (Sweden), MBA Polymers, Inc. (California), Electronic Recyclers International, Inc. (U.S.), Sims Metal Management Ltd. (Australia), Umicore S.A. (Belgium), Stena Technoworld AB (Sweden), Tetronics (International) Ltd. (U.K.), Enviro-Hub Holdings Ltd. (Singapore), and Global Electric Electronic Processing Inc. (Canada).
 Exclusive indicates content/data unique to MarketsandMarkets and not available with any competitors.
Table of Contents
1 Introduction (Page No. - 14)
1.1 Objective of Study
1.2 Market Definition
1.3 Market Scope
1.3.1 Markets Covered
1.3.2 Years Considered for the Study
1.4 Currency
1.5 Package Size
1.6 Limitations
1.7 Stakeholders
2 Research Methodology (Page No. - 18)
2.1 Research Data
2.1.1 Secondary Data
2.1.1.1 Key Data From Secondary Sources
2.1.2 Primary Data
2.1.2.1 Key Data From Primary Sources
2.1.2.2 Assumptions Considered for Products
2.1.2.3 Key Industry Insights
2.1.2.4 Breakdown of Primaries Interviews: By Company, Designation, and Region
2.2 Market Size Estimation
2.2.1 Bottom-Up Approach
2.2.2 Top-Down Approach
2.3 Market Breakdown and Data Triangulation
3 Executive Summary (Page No. - 28)
4 Premium Insights (Page No. - 32)
4.1 Attractive Opportunities in the Market
4.2 Market, By Source Type
4.3 Metal Recovery Market is Expected to Hold the Largest Share in APAC During the Forcast Period
4.4 APAC Countries are Expected to Account for the Largest Share of the Market
4.5 Life Cycle Analysis, By Region
5 Market Overview (Page No. - 37)
5.1 Introduction
5.2 Market Evolution
5.3 E-Waste Management Methods of E-Waste Disposal
5.3.1 Land Filling
5.3.2 Incineration
5.3.3 Reuse
5.3.4 Recycle
5.4 E-Waste Recycling Process
5.4.1 Collection of E-Waste
5.4.2 Dismantling
5.4.3 Preprocessing
5.4.4 End Processing
5.4.5 Reuse and Handling of Final E-Waste
5.5 Market Segmentation
5.5.1 By Material Recovery
5.5.2 By Source Type
5.5.3 By Region
5.6 Market Dynamics
5.6.1 Drivers
5.6.1.1 Shortened Electronic Product’s Life Cycle
5.6.1.2 Awareness About the Conservation of Environment and Health
5.6.1.3 Availability of Valuable Substances in E-Waste
5.6.1.4 Government Rules and Regulations for the E-Waste Management
5.6.1.4.1 U.S. Laws
5.6.1.4.2 European Laws
5.6.2 Restraints
5.6.2.1 High Cost for Recycling Incurred Due to Lack of Awareness
5.6.3 Opportunities
5.6.3.1 Companies Being Certified By Third-Party Auditors
5.6.4 Challenges
5.6.4.1 Illegal Dumping of E-Waste By Developing Countries
6 Industry Trends (Page No. - 54)
6.1 Introduction
6.2 Value Chain Analysis
6.3 Porter’s Five Forces Analysis
6.3.1 Intensity of Competitive Rivalry
6.3.2 Threat of Substitutes
6.3.3 Bargaining Power of Buyers
6.3.4 Bargaining Power of Suppliers
6.3.5 Threat of New Entrants
7 Market, By Recycler Type (Page No. - 62)
7.1 Introduction
7.2 Glass Recycler
7.3 Metal Recycler
7.4 Plastic Recycler
7.5 Printed Circuit Board Recycler
8 Market, By Material Recovery (Page No. - 67)
8.1 Introduction
8.2 Metal
8.3 Plastic
8.4 Glass
8.5 Others
9 Market, By Source Type (Page No. - 83)
9.1 Introduction
9.2 Household Appliances
9.2.1 Large Household Appliances
9.2.1.1 Washing Machines
9.2.1.2 Refrigerators
9.2.1.3 Air Conditioners
9.2.2 Small Household Appliances
9.3 Entertainment & Consumer Electronics
9.3.1 Televisions
9.3.2 Others
9.4 IT and Telecommunication
9.4.1 Computers
9.4.2 Phones
9.4.3 Others
9.5 Others
10 Market, By Region (Page No. - 109)
10.1 Introduction
10.2 Americas
10.2.1 North America
10.2.1.1 U.S.
10.2.1.2 Canada
10.2.1.3 Mexico
10.2.2 South America
10.3 Europe
10.3.1 U.K.
10.3.2 Germany
10.3.3 France
10.3.4 Rest of Europe
10.4 Asia-Pacific
10.4.1 China
10.4.2 Japan
10.4.3 India
10.4.4 Rest of APAC
10.5 RoW
10.5.1 Middle East
10.5.2 Africa
11 Competitive Landscape (Page No. - 128)
11.1 Overview
11.2 Market Share Analysis for the Market
11.3 Competitive Scenario
11.4 Recent Developments
11.4.1 Partnership, Contract, Agreement, & Investment
11.4.2 Merger and Acquisition
11.4.3 Expansion and New Project Launch
12 Company Profiles (Page No. - 135)
(Overview, Products and Services, Financials, Strategy & Development)*
12.1 Introduction
12.2 Aurubis AG
12.3 Electronic Recyclers International, Inc.
12.4 SIMS Metal Management, Ltd.
12.5 Umicore S.A.
12.6 Boliden AB
12.7 MBA Polymers, Inc.
12.8 Stena Metall AB
12.9 Enviro-Hub Holdings Ltd.
12.10 Global Electric Electronic Processing Inc.
12.11 Tetronics International Ltd.
*Details on Overview, Products and Services, Financials, Strategy & Development Might Not Be Captured in Case of Unlisted Companies.
13 Appendix (Page No. - 160)
13.1 Insights From Industry Experts
13.2 Discussion Guide
13.3 Introducing RT: Real-Time Market Intelligence
13.4 Available Customizations
13.5 Additional Report
List of Tables (78 Tables)
Table 1 Shrinking of Electronic Product Life Cycle is Leading to the Growth of E-Waste Management
Table 2 Hazardous Substances in E-Waste
Table 3 Effects of E-Waste on Health and Environment
Table 4 Composition of Valuable Substances in A Desktop Computer
Table 5 Laws of Recycling E-Waste in Different States in the U.S.
Table 6 Laws of Recycling E-Waste in Europe
Table 7 Improper Recycling Methods is Increasing the Cost of Recycling
Table 8 Opportunity for the Third Party Auditors is Highlighted By Growing Market
Table 9 Porter’s Five Forces Analysis: E-Waste Management
Table 10 Market Size, By Material Recovery, 2013–2020 (Million Tonnes)
Table 11 Market Size, By Material Recovery, 2013–2020 (USD Billion)
Table 12 Types of Metals, Sources, and Composition
Table 13 Metal Market Size, By Source Type, 2013–2020 (USD Million)
Table 14 Metal Market Size, By Household Appliance, 2013–2020 (Million Tonnes)
Table 15 Metal Market Size, By Large Household Appliance 2013–2020 (Million Tonnes)
Table 16 Metal Market Size, By Region, 2013–2020 (USD Million)
Table 17 Plastic Market Size, By Source Type, 2013–2020 (USD Million)
Table 18 Plastic Market Size, By Household Appliance, 2013–2020 (Million Tonnes)
Table 19 Plastic Market Size, By Large Household Appliance, 2013–2020 (Million Tonnes)
Table 20 Plastic Market Size, By Region, 2013–2020 (USD Million)
Table 21 Glass Market Size, By Source Type, 2013–2020 (USD Million)
Table 22 Glass Market Size, By Household Appliance, 2013–2020 (Million Tonnes)
Table 23 Glass Market Size, By Large Household Appliance, 2013–2020 (Million Tonnes)
Table 24 Glass Market Size, By Region, 2013–2020 (USD Million)
Table 25 Other Material Market Size, By Source Type, 2013–2020 (USD Million)
Table 26 Other Material Market Size, By Household Appliance, 2013–2020 (Million Tonnes)
Table 27 Other Material Market Size, By Large Household Appliance, 2013–2020 (Million Tonnes)
Table 28 Others Material Market Size, By Regions, 2013–2020 (USD Million)
Table 29 Market Size, By Source Type, 2013–2020 (Million Tonnes)
Table 30 Recycled: Market Size, By Source Type, 2013–2020 (Million Tonnes)
Table 31 Market Size, By Source Type, 2013–2020 (USD Billion)
Table 32 Market Size, By Region, 2013–2020 (Million Tonnes)
Table 33 Generated: Household Appliances Market Size, By Type, 2013–2020 (Million Tonnes)
Table 34 Recycled: Household Appliances Market Size, By Type, 2013–2020 (Million Tonnes)
Table 35 Recycled: Household Appliances Market Size, By Region, 2013–2020 (Million Tonnes)
Table 36 Household Appliances Market Size, By Material Recovery, 2013–2020 (USD Million)
Table 37 Recycled: Household Appliances Metal Market Size, By Region, 2013–2020 (USD Million)
Table 38 Recycled: Household Appliances Plastic Market Size, By Region, 2013–2020 (USD Million)
Table 39 Recycled: Household Appliances Glass Market Size, By Region, 2013–2020 (USD Million)
Table 40 Generated: Large Household Appliances Market Size, By Subtype, 2013–2020 (Million Tonnes)
Table 41 Recycled: Large Household Appliances Market Size, By Subtype, 2013–2020 (Million Tonnes)
Table 42 Recycled: Entertainment and Consumer Electronics Market Size, By Material Recovery, 2013–2020 (USD Million)
Table 43 Recycled: Entertainment and Consumer Electronics Market Size, By Region, 2013–2020 (Million Tonnes)
Table 44 Recycled: Entertainment and Consumer Electronics Metal Market Size, By Region, 2013–2020 (USD Million)
Table 45 Recycled: Entertainment and Consumer Electronics Plastic Market Size, By Region, 2013–2020 (USD Million)
Table 46 Recycled: Entertainment and Consumer Electronics Glass Market Size, By Region, 2013–2020 (USD Million)
Table 47 Generated: Entertainment & Consumer Electronic Market Size, By Product, 2013–2020 (Million Tonnes)
Table 48 Recycled: Entertainmnet & Consumer Electronic Market Size, By Product, 2013–2020 (Million Tonnes)
Table 49 Recycled: IT and Telecommunication Market Size, By Product, 2013–2020 (Million Tonnes)
Table 50 Recycled: IT and Telecommunication Market Size, By Material Recovery, 2013–2020 (USD Million)
Table 51 Recycled: IT and Telecommunication Market Size, By Region, 2013–2020 (Million Tonnes)
Table 52 Recycled: IT and Telecommunication Metal Market Size, By Region, 2013–2020 (USD Million)
Table 53 Recycled: IT and Telecommunication Plastic Market Size, By Region, 2013–2020 (USD Million)
Table 54 Recycled: IT and Telecommunication Glass Market Size, By Region, 2013–2020 (USD Million)
Table 55 Generated: IT and Telecommunication Market Size, By Type, 2013–2020 (Million Tonnes)
Table 56 Recycled: Other Sources Market Size, By Material Recovery, 2013–2020 (USD Million)
Table 57 Recycled: Other Sources Market Size, By Region, 2013–2020 (Million Tonnes)
Table 58 Recycled: Metal Market Size, By Region, 2013–2020 (USD Million)
Table 59 Recycled: Plastic Market Size, By Region, 2013-2020 (USD Million)
Table 60 Recycled: Glass Market Size, By Region, 2013–2020 (USD Million)
Table 61 E-Waste Management Market Size, By Region, 2013–2020 (Million Tonnes)
Table 62 Market Size, By Region, 2013–2020 (USD Billion)
Table 63 Americas Market Size, By Region, 2013–2020 (Million Tonnes)
Table 64 Americas Market Size, By Source Type, 2013–2020 (Million Tonnes)
Table 65 Americas Market Size, By Material Recovery, 2013–2020 (USD Million)
Table 66 North American Market Size, By Country, 2013–2020 (Million Tonnes)
Table 67 European Market Size, By Source Type, 2013–2020 (Million Tonnes)
Table 68 European Market Size, By Material Recovery, 2013–2020 (USD Million)
Table 69 European Market Size, By Country, 2013–2020 (Million Tonnes)
Table 70 APAC Market Size, By Source Type, 2013–2020 (Million Tonnes)
Table 71 APAC Market Size, By Material Recovery, 2013–2020 (USD Million)
Table 72 APAC Market Size, By Country, 2013–2020 (Million Tonnes)
Table 73 RoW Market Size, By Source Type, 2013–2020 (Million Tonnes)
Table 74 RoW Market Size, By Material Recovery, 2013–2020 (USD Million)
Table 75 Market Ranking for the Company in the E-Waste Management, 2014
Table 76 Partnership, Contract, Agreement, & Investment, 2012–2015
Table 77 Merger and Acquisition, 2012–2015
Table 78 Expansion and New Product Launch, 2012–2015
List of Figures (82 Figures)
Figure 1 E-Waste Management Market
Figure 2 Research Design
Figure 3 Research Methodology
Figure 4 Market Size Estimation Methodology: Bottom-Up Approach
Figure 5 Market Size Estimation Methodology: Top-Down Approach
Figure 6 Data Triangulation
Figure 7 E-Waste Recycled in 2014 Was Only One Fourth of the Total E-Waste Generated Annually
Figure 8 Volume of Household Appliances Witness Large Market Share in the Market During the Forecast Period
Figure 9 Household Appliances to Have Highest Market Share During the Forecast Period
Figure 10 APAC Accounted for the Largest Share of the Market in 2014
Figure 11 The Market in APAC is Expected to Grow at the Highest Rate During the Forecast Period
Figure 12 IT and Telecommunication is Estimated to Have the Highest Market Growth in E-Waste Generation During the Forecast Period
Figure 13 India is Expected to Have the Highest CAGR Between 2015 and 2020
Figure 14 China Was the Largest E-Waste Recycler Globally in 2014
Figure 15 APAC is Expected to Witness the Highest Growth Rate, Followed By Europe During the Forecast Period
Figure 16 E-Waste Management Evolution
Figure 17 Process of Recycling
Figure 18 Market: Segmentation
Figure 19 Market Segmentation: By Material Recovery
Figure 20 Market Segmentation: By Source Type
Figure 21 Market Segmentation: By Region
Figure 22 Government Regulations are Encouraging Organizations to Manage E-Waste
Figure 23 Expected Life Cycle of the Electronic Products in 2014
Figure 24 Global Export of E-Waste
Figure 25 Value Chain Analysis of the Market
Figure 26 Porter’s Five Forces Analysis (2015–2020)
Figure 27 Porter’s Five Forces Analysis: Bargaining Power of Buyers in the Market is Expected to Have A High-To-Medium Impact on the Market During the Forecast Period
Figure 28 Intensity of Competitive Rivalry: Moderate Competition in the Market Due to the Growth in the Number of Players
Figure 29 The Threat of Substitute is Expected to Be Low Due to the High Switching Cost for Buyers
Figure 30 The Bargaining Power of Buyers is Expected to Be High Due to Buyers’ High Adoption Rate for Recycled Products
Figure 31 The Bargaining Power of Suppliers is Expected to Be Moderate Due to Government Regulations
Figure 32 New Entrants are Likely to Enter the Market Due to A High Growth Rate of the market
Figure 33 Market, By Recycler Type
Figure 34 Types of Metal
Figure 35 Market, By Material Recovery
Figure 36 Market Size, By Material Recovery (Million Tonnes)
Figure 37 Market Size, By Material Recovery (USD Billion)
Figure 38 Metal Market Size, By Household Appliance (Million Tonnes)
Figure 39 Metal Market Size, By Region (USD Million)
Figure 40 Plastic Market Size, By Household Appliance (Million Tonnes)
Figure 41 Plastic Market Size, By Region (USD Million)
Figure 42 Glass Market Size, By Household Appliance (Million Tonnes)
Figure 43 Glass Market Size, By Region (USD Million)
Figure 44 Others Material Market Size, By Household Appliance (Million Tonnes)
Figure 45 Others Material Market Size, By Region
Figure 46 Market, By Source Type
Figure 47 Market Size, By Source Type, (USD Billion)
Figure 48 Household Appliances, By Type
Figure 49 Recycled: Household Appliances Market Size, By Region, (Million Tonnes)
Figure 50 Recycled: Household Appliances Market Size, By Material Recovery, (USD Million)
Figure 51 Generated: Large Household Appliances Market Size, By Subtype (Million Tonnes)
Figure 52 Market, By Entertainment and Consumer Electronics
Figure 53 Recycled: Entertainment and Consumer Electronics Market Size, By Region (Million Tonnes)
Figure 54 Generated: Entertainment & Consumer Electronic Market Size, By Product (Million Tonnes)
Figure 55 Market By IT & Telecommunication
Figure 56 Recycled: IT and Telecommunication Market Size, By Product (Million Tonnes)
Figure 57 Recycled: IT and Telecommunication Market Size, By Region (Million Tonnes)
Figure 58 Recycled: Other Sources Market Size, By Region, Million Tonnes
Figure 59 Market, By Region
Figure 60 Geographic Snapshot (2015–2020)
Figure 61 Americas Market, By Region
Figure 62 Americas: Market Snapshot
Figure 63 Europe Market, By Region
Figure 64 Europe: Market Snapshot
Figure 65 APAC Market, By Region
Figure 66 APAC: Market Snapshot
Figure 67 The Rest of the World Market, By Region
Figure 68 Key Growth Strategies Adopted By Top Companies Over the Last Three Years
Figure 69 Market Evaluation Framework – Partnership, Contract, Agreement, & Investment Fuelled the Growth of the Market Between 2013 to 2015
Figure 70 Battle for Market Share: Partnership, Contract, Agreement, & Investment Were the Key Strategies
Figure 71 Geographic Revenue Mix of Top 4 Market Players
Figure 72 Aurubis AG: Snapshot
Figure 73 Aurubis AG: SWOT Analysis
Figure 74 SWOT Analysis: Electronic Recyclers International, Inc.
Figure 75 SIMS Metal Management Ltd.: Company Snapshot
Figure 76 SIMS Metal Management Ltd.: SWOT Analysis
Figure 77 Umicore S.A.: Company Snapshot
Figure 78 SWOT Analysis: Umicore S.A.
Figure 79 Boliden AB: Company Snapshot
Figure 80 Boliden AB: SWOT Analysis
Figure 81 Stena Metall AB: Company Snapshot
Figure 82 Enviro-Hub Holdings Ltd.: Company Snapshot


Growth opportunities and latent adjacency in E-Waste Management Market
We are giving consultancy services to some African organizations and companies in waste management field. We would like to explore new opportunities available in this space, specially in Africa region. This is the reason of our interst.Thank you
Being as head of NPO CURE India working in field of environmental protection and damage to human and ecology due to E-waste I am interested to know how the business of e-waste will gear the recycling of e-waste rescuing the people from hazardous effect of it. Have you also provide major opportunities and challenges in this market ?
I am interested in research regarding recycling of end of life technology, and would like to reference data from this report. Would be interested in receiving sample copy for this study ?
The information and structure of this report is good, further it will be very useful to upgrade the knowledge in this field. Would like to know about pricing for procuring this copy.
We are a start up company in E-waste management in India , interested in end to end recycling using state-of-the-art technology currently prevailing in this market ?
We have a plant for e-waste recycling in Egypt so, we are interested to know further information about this sector worldwide and the main sources for e-waste , etc. these information would help me in decision making for expanding my business. thanks
My client would like to use a statistic from the above-referenced report in a customer-facing assest, and I am writing to inquire whether this is possible without purchasing the report.
I am currently enrolling for a masters degree (research) in Chemistry. My area of interest is in waste management particularly in e-waste and its impacts in Papua New Guinea. Would be interested in knowing regional market data for Latin America.
Would be interested in knowing major sources for e-wate. Main focus and area of interest is consumer mobile devices (e.g. smartphones). By asp, region, and as time-series. Thank you
Interested to know more about quantity/category and Platinum group metals content in different electronics devices from all countries globally (key countries/contents)
Hello, I spoke with a rep from your company yesterday, and he was going to send me information about this report but I never received anything. Can you resend that information to me? Thanks, Matt
I am particulary looking for material on computer recycling business. I need estimated start up cost and its break even and major market competitiors in the UK.
Could you please send me the free sample copy today? I am writing an article about e-waste for Swiss provate bank Pictet. Thank you very much, Kind regards, Robert Gloy
I am writing a report on the markets of recovered materials from E-Waste recycling. I would like to use this paper a reference in my paper. As a student I can only utilize some portion of this report. Can you provide me this report with discount offer. Thank you.
For the 10% free customization of this report, would it be possible to get any detailed information on the recovery and recycle of polycarbonate, ABS, aluminum, polylactic acid (PLA), and rare earth elements from E-waste? If so, how long would it take to obtain the report?