Wet Waste Management Market by Service & Equipment (Collection & Transportation, Processing, Disposal), Source (Industrial, Municipal, Commercial, Healthcare & Medical), Waste Type (Food Scrap, Meat & Bones, Agricultural Waste, Medical Waste) - Global Trends & Forecast to 2020


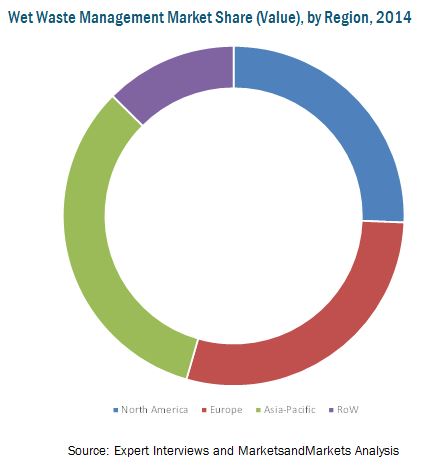
[230 Pages Report] The global wet waste management market witnessed a rapid growth from 2013, and is projected to grow at a CAGR of 5.09% during the forecast period from 2015 to reach USD 128.40 Billion by 2020. Asia-Pacific dominated the market, with a share of ~33% in 2014. This market is driven by an increasing competition, aggressive pricing, rising environmental sustainability, increasing waste regulations & safety, and various developments in the waste management technology. The Asia-Pacific region is estimated to become the fastest-growing market for wet waste management.
The wet waste management market in the Asia-Pacific region is projected to grow at the highest CAGR from 2015 to 2020, in terms of volume and value. The rising awareness for wet waste management of the region with upcoming new technologies such as waste-to-energy solutions, the growing usage of eco-friendly material and increasing environment sustainability, and the parent waste management industry are driving the growth of the wet waste management market. Another factor is the densely populated areas of this region that require wet waste management solutions.
This report estimates the market size of the global wet waste management market in terms of value (USD million). In this report, the market is broadly segmented on the basis of waste management service, waste source, waste type, and region. Market drivers, restraints, challenges, raw material, and product price trends are discussed in detail. The global wet waste management market has grown exponentially in the last few years and this trend is expected to continue. Strict government on environmental and waste regulations, reducing landfill, environmental pollution awareness, waste-to-energy solutions, and growing population make wet waste management an attractive market of the global waste management industry.
Scope of the Report
This research study categorizes the global wet waste management market based on waste management service, waste source, waste type, and region:
Based on service, the market has been segmented as follows:
- Collection & transportation
- Collection & transportation equipment
- Storage
- Storage equipment
- Sorting
- Sorting equipment
- Processing
- Processing equipment
- Disposal & landfill
- Disposal & landfill equipment
Based on source, the market has been segmented as follows:
- Industrial
- Municipal
- Commercial
- Healthcare & medical
- Others (solvents, glues, construction, and demolition wet wastes)
Based on waste type, the market has been segmented as follows:
- Food scrap
- Meat & bones
- Agricultural waste
- Medical waste
- Shredded paper
- Others
Based on region, the market has been segmented as follows:
- North America
- Europe
- Asia-Pacific
- Rest of the World (RoW)
Wet waste management is observed for multiple sectors such as food & beverages, industrial, pharmaceutical, agriculture, and others. Niche markets in which wet waste management is used are aerospace, nutraceuticals, and textile.
The growing demand for wet waste management in developing countries such as Japan, India, the U.K., and Brazil is due to the strict waste and environmental regulations and heavy waste generation. Key factors such as growth in the parent waste management market, increasing concern towards reducing pollution and increasing sustainability and safety, and development in the technology for waste management are contributing to the growth of the wet waste management market.
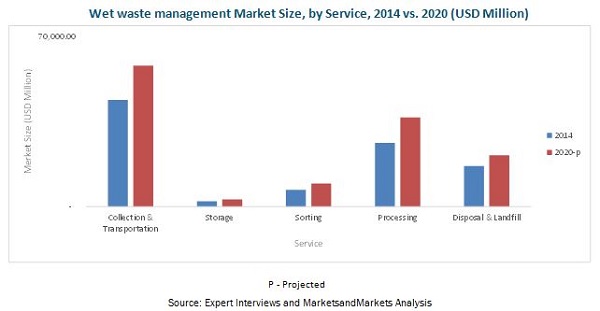
The Wet waste management market is projected to reach USD 128.40 Billion by 2020, at a CAGR of 5.09% during the forecast period from 2015. Waste processing is projected to be the fastest-growing wet waste management service, at a CAGR of ~5.89% during the period under review. Factors such as growing population, with growing waste generation and management services, make wet waste management an attractive market of the global packaging industry.
The market for wet waste management in the Asia-Pacific region is projected to grow at the highest CAGR from 2015 to 2020, in terms of volume and value, having accounted for market sizes of 210.6 MT and USD 31.67 Billion, respectively, in 2014. The rising awareness for wet waste management of the region with upcoming new technologies such as waste-to-energy solutions, the growing usage of eco-friendly material and increasing environment sustainability, improved economic conditions, and lifestyle, along with growing waste management industry are some of the reasons to trigger the higher demand for wet waste management market.
Europe is projected to be the second-largest region considering wet waste management in the world. The market for wet waste management is driven by the rapid growing industrial waste generation and the need to manage it in the region, growing at a CAGR of more than 4.93% from 2015 to 2020.
This market is driven by the growth in the parent waste management industry, along with rising awareness for wet waste management and upcoming new technologies such as waste-to-energy solutions. The rising population generates rapid waste, hence the need of waste management services, along with growing environmental concerns for landfills and waste disposal, increases. Stringent government regulations for waste management and disposal also facilitate the implementation of wet waste management services.
The global wet waste management market is characterized by intense competition due to the presence of a large number of big and small firms. Mergers & acquisitions and partnerships & expansions are the key strategies adopted by market players to ensure their growth in this market. Companies such as Waste Management Inc. (U.S.), Republic Services Inc. (U.S.), Veolia Environment S.A. (France), SUEZ Environment Co. SA (France), and Clean Harbors Inc. (U.S.) are some of the prominent companies in the wet waste management market.
 Exclusive indicates content/data unique to MarketsandMarkets and not available with any competitors.
Table of Contents
1 Introduction (Page No. - 20)
1.1 Objectives of the Study
1.2 Market Definition
1.3 Study Scope
1.3.1 Years Considered for the Study
1.4 Currency
1.5 Unit Considered
1.6 Stakeholders
1.7 Limitations
2 Research Methodology (Page No. - 23)
2.1 Introduction
2.1.1 Secondary Data
2.1.1.1 Key Data From Secondary Sources
2.1.2 Primary Data
2.1.2.1 Key Data From Primary Sources
2.1.2.1.1 Breakdown of Primaries, By Company Type, Designation, and Region.
2.2 Factor Analysis
2.2.1 Introduction
2.2.2 Overview of the Parent Industry
2.2.3 Demand-Side Analysis
2.2.3.1 Rising Population
2.2.3.1.1 Increase in Middle-Class Population, 2009 to 2030
2.2.3.2 Developing Economies, GDP (Gross Domestic Production)
2.2.4 Supply-Side Analysis
2.2.4.1 Regulations
2.2.4.2 Research & Development
2.3 Market Size Estimation
2.4 Market Breakdown & Data Triangulation
2.5 Market Share Estimation
2.6 Research Assumptions & Limitations
3 Executive Summary (Page No. - 36)
3.1 Collection & Transportation Accounts for Major Share in the Wet Waste Management Market
3.2 Municipal Wet Waste Projected to Be the Largest Segment By 2020
3.3 Asia-Pacific: Best Market for Investment
3.4 Asia-Pacific: Leading Market for Wet Waste Management
3.5 Mergers & Acquisitions Were the Key Growth Strategies
4 Premium Insights (Page No. - 42)
4.1 Attractive Opportunities in Wet Waste Management Market
4.2 Food Scrap Waste to Grow at the Highest Rate Over the Next Five Years
4.3 Collection & Transportation Segment to Dominate Wet Waste Management Market
4.4 Dumpsite/Landfill Treatment is the Fastest-Growing Process in Wet Waste Management Market
4.5 Food Scrap Waste Accounted for the Largest Share in the Asia-Pacific Region
4.6 Growth Prospects in the Market
4.7 Asia-Pacific Region to Provide Immense Potential for Wet Waste Management Market Growth
5 Market Overview (Page No. - 49)
5.1 Introduction
5.2 Market Segmentation
5.2.1 By Service
5.2.2 By Source
5.2.3 By Waste Type
5.2.4 By Region
5.3 Market Dynamics
5.3.1 Drivers
5.3.1.1 Laws & Regulations Enforced By Governments
5.3.1.2 Increasing Urban Population
5.3.1.3 Increasing Awareness Programs for Waste Management
5.3.2 Restraints
5.3.2.1 Less Participation of Source Sectors Towards Management of Waste
5.3.2.2 Less Number of Treatment Plants and Lack of Expertise Restrict the Amount of Recycled Wet Waste
5.3.3 Opportunities
5.3.3.1 Increasing Purchase of End Product
5.3.3.2 Increasing Environmental Safety Regulations
5.3.4 Challenges
5.3.4.1 Unavailability of Landfill Sites for Waste Disposal
5.4 Industry Trends
5.5 Value Chain Analysis
5.5.1 Major Value Addition Takes Place in Waste Recovery & Processing of Wet Waste Management
6 Wet Waste Management Market, By Service (Page No. - 58)
6.1 Introduction
6.2 Collection & Transportation
6.2.1 Collection & Transporation Equipments
6.2.1.1 Garbage Trucks
6.3 Storage
6.4 Sorting
6.4.1 Sorting Equipments
6.4.1.1 Compactors
6.4.1.2 Balers
6.4.1.3 Shredders
6.5 Processing
6.5.1 Processing & Disposal Equipments
6.5.1.1 Scrubber
6.5.1.2 Precipitator
6.5.1.3 Combustor
6.5.1.4 Sludging Machine
6.5.1.5 Digester
6.5.1.6 Separator
6.5.1.7 Gas Storage Equipment
6.5.1.8 Crusher
6.6 Disposal & Landfill
7 Wet Waste Management Market, By Process (Page No. - 79)
7.1 Introduction
7.2 Recycling
7.2.1 Anaerobic Digestion for Wet Waste Management
7.3 Incineration
7.4 Dumpsites/Landfill Treatment
8 Wet Waste Management Market, By Waste Type (Page No. - 87)
8.1 Introduction
8.2 Food Scrap
8.3 Meat & Bones
8.4 Agricultural Waste
8.5 Medical Waste
8.6 Shredded Paper
8.7 Others
9 Wet Waste Management Market, By Source (Page No. - 92)
9.1 Introduction
9.2 Household & Municipal Waste
9.3 Commercial Waste
9.4 Industrial Waste
9.5 Healthcare & Medical Waste
9.6 Other Waste
10 Wet Waste Management Market, By Geography (Page No. - 97)
10.1 Introduction
10.2 Key Country-Wise Regulations
10.3 North America
10.3.1 U.S.
10.3.2 Canada
10.3.3 Mexico
10.4 Europe
10.4.1 Germany
10.4.2 U.K.
10.4.3 Russia
10.4.4 Italy
10.4.5 France
10.4.6 Rest of Europe
10.5 Asia-Pacific
10.5.1 China
10.5.2 Japan
10.5.3 India
10.5.4 Australia
10.5.5 Rest of Asia-Pacific
10.6 Rest of the World (RoW)
10.6.1 Brazil
10.6.2 Argentina
10.6.3 South Africa
10.6.4 Egypt
10.6.5 Others in RoW
11 Competitive Landscape (Page No. - 208)
11.1 Overview
11.2 Competitive Situations & Trends
11.2.1 Mergers & Acquisitions
11.2.2 Partnerships, Joint Ventures, Agreements & Contracts
11.2.3 Investments & Expansions
11.2.4 New Product Launches
12 Company Profiles (Page No. - 213)
12.1 Introduction
12.2 Waste Management Inc.
12.3 Republic Services, Inc.
12.4 Veolia Environment S.A.
12.5 Suez Environment
12.6 Clean Harbors Inc.
12.7 Progressive Waste Solution Ltd.
12.8 Stericycle
12.9 Advanced Disposal
12.10 Covanta
12.11 Remondis SE & Co. Kg
13 Appendix (Page No. - 241)
13.1 Insights of Industry Experts
13.2 Discussion Guide
13.3 Introducing RT: Real Time Market Intelligence
13.4 Available Customizations
13.5 Related Reports
List of Tables (229 Tables)
Table 1 Wet Waste Management Market Size, By Service, 2013�2020 (USD Million)
Table 2 Wet Waste Management Market Size, By Service, 2013�2020 (MMT)
Table 3 Garbage Trucks: Wet Waste Management Market,2013�2020 (USD Million)
Table 4 Garbage Trucks: Market,2013�2020 (Thousand Units)
Table 5 Compactor: Wet Waste Management Market, 2013�2020 (USD Billion)
Table 6 Compactor: Market, 2013�2020 (Thousand Units)
Table 7 Balers: Wet Waste Management Market, 2013�2020 (USD Billion)
Table 8 Balers: Market, 2013�2020 (Thousand Units)
Table 9 Shredders: Wet Waste Management Market, 2013�2020 (USD Billion)
Table 10 Shredders: Market, 2013�2020 (Thousand Units)
Table 11 Scrubbers: Wet Waste Management Market, 2013�2020 (USD Billion)
Table 12 Scrubbers: Market, 2013�2020 (Thousand Units)
Table 13 Precipitators: Wet Waste Management Market, 2013�2020 (USD Billion)
Table 14 Precipitators: Market, 2013�2020 (Units)
Table 15 Combustor: Wet Waste Management Market, 2013�2020 (USD Billion)
Table 16 Combustor: Market, 2013�2020 (Units)
Table 17 Sludging Machine: Wet Waste Management Market,2013�2020 (USD Billion)
Table 18 Sludging Machine: Market,2013�2020 (Thousand Units)
Table 19 Digester: Wet Waste Management Market, 2013�2020 (USD Billion)
Table 20 Digester: Market, 2013�2020 (Thousand Units)
Table 21 Separator: Wet Waste Management Market, 2013�2020 (USD Billion)
Table 22 Separator: Market, 2013�2020 (Units)
Table 23 Gas Storage Equipment: Wet Waste Management Market,2013�2020 (USD Billion)
Table 24 Gas Storage Equipment: Wet Waste Management Market,2013�2020 (Units)
Table 25 Crusher: Wet Waste Management Market, 2013�2020 (USD Billion)
Table 26 Crusher: Wet Waste Management Market, 2013�2020 (Thousand Units)
Table 27 Wet Waste Management Market Size, By Process, 2013�2020 (USD Million)
Table 28 Wet Waste Management Market Size, By Process, 2013�2020 (MMT)
Table 29 Waste Management Market Size, By Waste Type, 2013�2020 (USD Million)
Table 30 Wet Waste Management Market, By Waste Type, 2013�2020 (MMT)
Table 31 Wet Waste Management Market Size, By Source, 2013�2020 (USD Million)
Table 32 Wet Waste Management Market Size, By Source, 2013�2020 (Mt)
Table 33 Wet Waste Management Market By Region, 2013�2020 (USD Million)
Table 34 Wet Waste Management Market By Region, 2013�2020 (Mt)
Table 35 North America: Wet Waste Management Market Size, By Country,2013�2020 (USD Million)
Table 36 North America: Market Size, By Country,2013�2020 (MMT)
Table 37 North America: Market Size, By Service,2013�2020 (USD Million)
Table 38 North America: Market Size, By Service,2013�2020 (MMT)
Table 39 North America: Market Size, By Process,2013�2020 (USD Million)
Table 40 North America: Market Size, By Process,2013�2020 (MMT)
Table 41 North America: Market Size, By Waste Type, 2013�2020 (USD Million)
Table 42 North America: Market Size, By Waste Type, 2013�2020 (MMT)
Table 43 North America: Market Size, By Source,2013�2020 (USD Million)
Table 44 North America: Market Size, By Source,2013�2020 (MMT)
Table 45 U.S.: Wet Waste Management Market Size, By Service,2013�2020 (USD Million)
Table 46 U.S.: Market Size, By Service, 2013�2020 (MMT)
Table 47 U.S.: Market Size, By Process,2013�2020 (USD Million)
Table 48 U.S.: Market Size, By Process, 2013�2020 (MMT)
Table 49 U.S.: Market Size, By Waste Type,2013�2020 (USD Million)
Table 50 U.S.: Market Size, By Waste Type, 2013�2020 (MMT)
Table 51 U.S.: Market Size, By Source,2013�2020 (USD Million)
Table 52 U.S.: Market Size, By Source, 2013�2020 (MMT)
Table 53 Canada: Wet Waste Management Market Size, By Service,2013�2020 (USD Million)
Table 54 Canada: Market Size, By Service, 2013�2020 (MMT)
Table 55 Canada: Market Size, By Process,2013�2020 (USD Million)
Table 56 Canada: Market Size, By Process,2013�2020 (MMT)
Table 57 Canada: Market Size, By Waste Type,2013�2020 (USD Million)
Table 58 Canada: Market Size, By Waste Type,2013�2020 (MMT)
Table 59 Canada: Market Size, By Source,2013�2020 (USD Million)
Table 60 Canada: Market Size, By Source, 2013�2020 (MMT)
Table 61 Mexico: Wet Waste Management Market Size, By Service,2013�2020 (USD Million)
Table 62 Mexico: Market Size, By Service, 2013�2020 (MMT)
Table 63 Mexico: Market Size, By Process,2013�2020 (USD Million)
Table 64 Mexico: Market Size, By Process,2013�2020 (MMT)
Table 65 Mexico: Market Size, By Waste Type,2013�2020 (USD Million)
Table 66 Mexico: Market Size, By Waste Type,2013�2020 (MMT)
Table 67 Mexico: Market Size, By Source,2013�2020 (USD Million)
Table 68 Mexico: Market Size, By Source, 2013�2020 (MMT)
Table 69 Europe: Wet Waste Management Market Size, By Country,2013�2020 (USD Million)
Table 70 Europe: Market Size, By Country,2013�2020 (MMT)
Table 71 Europe: Market Size, By Service,2013�2020 (USD Million)
Table 72 Europe: Market Size, By Service,2013�2020 (MMT)
Table 73 Europe: Market Size, By Process,2013�2020 (USD Million)
Table 74 Europe: Market Size, By Process, 2013�2020 (MMT)
Table 75 Europe: Market Size, By Waste Type,2013�2020 (USD Million)
Table 76 Europe: Market Size, By Waste Type,2013�2020 (MMT)
Table 77 Europe: Market Size, By Source,2013�2020 (USD Million)
Table 78 Europe: Market Size, By Source, 2013�2020 (MMT)
Table 79 Germany: Wet Waste Management Market Size, By Service,2013�2020 (USD Million)
Table 80 Germany: Market Size, By Service,2013�2020 (MMT)
Table 81 Germany: Market Size, By Process,2013�2020 (USD Million)
Table 82 Germany: Market Size, By Process,2013�2020 (MMT)
Table 83 Germany: Market Size, By Waste Type,2013�2020 (USD Million)
Table 84 Germany: Market Size, By Waste Type,2013�2020 (MMT)
Table 85 Germany: Market Size, By Source,2013�2020 (USD Million)
Table 86 Germany: Market Size, By Source,2013�2020 (MMT)
Table 87 U.K.: Wet Waste Management Market Size, By Service,2013�2020 (USD Million)
Table 88 U.K.: Market Size, By Service, 2013�2020 (MMT)
Table 89 U.K.: Market Size, By Process,2013�2020 (USD Million)
Table 90 U.K.: Market Size, By Process, 2013�2020 (MMT)
Table 91 U.K.: Market Size, By Waste Type,2013�2020 (USD Million)
Table 92 U.K.: Market Size, By Waste Type, 2013�2020 (MMT)
Table 93 U.K.: Market Size, By Source,2013�2020 (USD Million)
Table 94 U.K.: Market Size, By Source, 2013�2020 (MMT)
Table 95 Russia: Wet Waste Management Market Size, By Service,2013�2020 (USD Million)
Table 96 Russia: Market Size, By Service, 2013�2020 (MMT)
Table 97 Russia: Market Size, By Process,2013�2020 (USD Million)
Table 98 Russia: Market Size, By Process,2013�2020 (MMT)
Table 99 Russia: Market Size, By Waste Type,2013�2020 (USD Million)
Table 100 Russia: Market Size, By Waste Type,2013�2020 (MMT)
Table 101 Russia: Market Size, By Source,2013�2020 (USD Million)
Table 102 Russia: Market Size, By Source, 2013�2020 (MMT)
Table 103 Italy: Wet Waste Management Market Size, By Service,2013�2020 (USD Million)
Table 104 Italy: Market Size, By Service, 2013�2020 (MMT)
Table 105 Italy: Market Size, By Process,2013�2020 (USD Million)
Table 106 Italy: Market Size, By Process, 2013�2020 (MMT)
Table 107 Italy: Market Size, By Waste Type,2013�2020 (USD Million)
Table 108 Italy: Market Size, By Waste Type,2013�2020 (MMT)
Table 109 Italy: Market Size, By Source,2013�2020 (USD Million)
Table 110 Italy: Market Size, By Source, 2013�2020 (MMT)
Table 111 France: Wet Waste Management Market Size, By Service,2013�2020 (USD Million)
Table 112 France: Market Size, By Service, 2013�2020 (MMT)
Table 113 France: Market Size, By Process,2013�2020 (USD Million)
Table 114 France: Market Size, By Process,2013�2020 (MMT)
Table 115 France: Market Size, By Waste Type,2013�2020 (USD Million)
Table 116 France: Market Size, By Waste Type,2013�2020 (MMT)
Table 117 France: Market Size, By Source,2013�2020 (USD Million)
Table 118 France: Market Size, By Source, 2013�2020 (MMT)
Table 119 Rest of Europe: Wet Waste Management Market Size, By Service,2013�2020 (USD Million)
Table 120 Rest of Europe: Market Size, By Service,2013�2020 (MMT)
Table 121 Rest of Europe: Market Size, By Process,2013�2020 (USD Million)
Table 122 Rest of Europe: Market Size, By Process,2013�2020 (MMT)
Table 123 Rest of Europe: Market Size, By Waste Type, 2013�2020 (USD Million)
Table 124 Rest of Europe: Market Size, By Waste Type, 2013�2020 (MMT)
Table 125 Rest of Europe: Market Size, By Source,2013�2020 (USD Million)
Table 126 Rest of Europe: Market Size, By Source,2013�2020 (MMT)
Table 127 Asia-Pacific: Wet Waste Management Market, By Country,2013�2020 (USD Million)
Table 128 Asia-Pacific: Market, By Country,2013�2020 (MMT)
Table 129 Asia-Pacific: Market, By Service,2013�2020 (USD Million)
Table 130 Asia-Pacific: Market, By Service, 2013�2020 (MMT)
Table 131 Asia-Pacific: Market, By Process,2013�2020 (USD Million)
Table 132 Asia-Pacific: Market, By Process,2013�2020 (MMT)
Table 133 Asia-Pacific: Market, By Waste Type,2013�2020 (USD Million)
Table 134 Asia-Pacific: Market, By Waste Type,2013�2020 (MMT)
Table 135 Asia-Pacific: Market, By Source,2013�2020 (USD Million)
Table 136 Asia-Pacific: Market, By Source, 2013�2020 (MMT)
Table 137 China: Wet Waste Management Market, By Service,2013�2020 (USD Million)
Table 138 China: Market, By Service, 2013�2020 (MMT)
Table 139 China: Market, By Process,2013�2020 (USD Million)
Table 140 China: Market, By Process, 2013�2020 (MMT)
Table 141 China: Market, By Waste Type,2013�2020 (USD Million)
Table 142 China: Market, By Waste Type, 2013�2020 (MMT)
Table 143 China: Market, By Source,2013�2020 (USD Million)
Table 144 China: Market, By Source, 2013�2020 (MMT)
Table 145 Japan: Wet Waste Management Market, By Service,2013�2020 (USD Million)
Table 146 Japan: Market, By Service, 2013�2020 (MMT)
Table 147 Japan: Market, By Process,2013�2020 (USD Million)
Table 148 Japan: Market, By Process, 2013�2020 (MMT)
Table 149 Japan: Market, By Waste Type,2013�2020 (USD Million)
Table 150 Japan: Market, By Waste Type, 2013�2020 (MMT)
Table 151 Japan: Market, By Source,2013�2020 (USD Million)
Table 152 Japan: Market, By Source, 2013�2020 (MMT)
Table 153 India: Wet Waste Management Market, By Service,2013�2020 (USD Million)
Table 154 India: Market, By Service, 2013�2020 (MMT)
Table 155 India: Market, By Process,2013�2020 (USD Million)
Table 156 India: Market, By Process, 2013�2020 (MMT)
Table 157 India: Market, By Waste Type,2013�2020 (USD Million)
Table 158 India: Market, By Waste Type, 2013�2020 (MMT)
Table 159 India: Market, By Source,2013�2020 (USD Million)
Table 160 India: Market, By Source, 2013�2020 (MMT)
Table 161 Australia: Wet Waste Management Market, By Service,2013�2020 (USD Million)
Table 162 Australia:Market, By Service, 2013�2020 (MMT)
Table 163 Australia: Market, By Process,2013�2020 (USD Million)
Table 164 Australia: Market, By Process, 2013�2020 (MMT)
Table 165 Australia: Market, By Waste Type,2013�2020 (USD Million)
Table 166 Australia: Market, By Waste Type,2013�2020 (MMT)
Table 167 Australia: Market, By Source,2013�2020 (USD Million)
Table 168 Australia: Market, By Source, 2013�2020 (MMT)
Table 169 Rest of Asia-Pacific: Wet Waste Management Market, By Service,2013�2020 (USD Million)
Table 170 Rest of Asia-Pacific: Market, By Service,2013�2020 (MMT)
Table 171 Rest of Asia-Pacific: Market, By Process,2013�2020 (USD Million)
Table 172 Rest of Asia-Pacific: Market, By Process,2013�2020 (MMT)
Table 173 Rest of Asia-Pacific: Market, By Waste Type,2013�2020 (USD Million)
Table 174 Rest of Asia-Pacific: Market, By Waste Type,2013�2020 (MMT)
Table 175 Rest of Asia-Pacific: Market, By Source,2013�2020 (USD Million)
Table 176 Rest of Asia-Pacific: Market, By Source,2013�2020 (MMT)
Table 177 RoW: Wet Waste Management Market, By Country, 2013�2020 (USD Million)
Table 178 RoW: Market, By Country, 2013�2020 (MMT)
Table 179 RoW: Market, By Service, 2013�2020 (USD Million)
Table 180 RoW: Market, By Service, 2013�2020 (MMT)
Table 181 RoW: Market, By Process, 2013�2020 (USD Million)
Table 182 RoW: Market, By Process, 2013�2020 (MMT)
Table 183 RoW: Market, By Waste Type, 2013�2020 (USD Million)
Table 184 RoW: Market, By Waste Type, 2013�2020 (MMT)
Table 185 RoW: Market, By Source, 2013�2020 (USD Million)
Table 186 RoW: Market, By Source, 2013�2020 (MMT)
Table 187 Brazil: Wet Waste Management Market, By Service,2013�2020 (USD Million)
Table 188 Brazil: Market, By Service, 2013�2020 (MMT)
Table 189 Brazil: Market, By Process,2013�2020 (USD Million)
Table 190 Brazil: Market, By Process, 2013�2020 (MMT)
Table 191 Brazil: Market, By Waste Type,2013�2020 (USD Million)
Table 192 Brazil: Market, By Waste Type, 2013�2020 (MMT)
Table 193 Brazil: Market, By Source,2013�2020 (USD Million)
Table 194 Brazil: Market, By Source, 2013�2020 (MMT)
Table 195 Argentina: Wet Waste Management Market, By Service,2013�2020 (USD Million)
Table 196 Argentina: Market, By Service, 2013�2020 (MMT)
Table 197 Argentina: Market, By Process,2013�2020 (USD Million)
Table 198 Argentina: Market, By Process, 2013�2020 (MMT)
Table 199 Argentina: Market, By Waste Type,2013�2020 (USD Million)
Table 200 Argentina: Market, By Waste Type,2013�2020 (MMT)
Table 201 Argentina: Market, By Source,2013�2020 (USD Million)
Table 202 Argentina: Market, By Source, 2013�2020 (MMT)
Table 203 South Africa: Wet Waste Management Market, By Service,2013�2020 (USD Million)
Table 204 South Africa: Market, By Service,2013�2020 (MMT)
Table 205 South Africa: Market, By Process,2013�2020 (USD Million)
Table 206 South Africa: Market, By Process,2013�2020 (MMT)
Table 207 South Africa: Market, By Waste Type,2013�2020 (USD Million)
Table 208 South Africa: Market, By Waste Type,2013�2020 (MMT)
Table 209 South Africa: Market, By Source,2013�2020 (MMT)
Table 210 Egypt: Wet Waste Management Market, By Service,2013�2020 (USD Million)
Table 211 Egypt: Market, By Service, 2013�2020 (MMT)
Table 212 Egypt: Market, By Process, 2013�2020 (USD Million)
Table 213 Egypt: Market, By Process, 2013�2020 (MMT)
Table 214 Egypt: Market, By Waste Type, 2013�2020 (USD Million)
Table 215 Egypt: Market, By Waste Type, 2013�2020 (MMT)
Table 216 Egypt: Market, By Source, 2013�2020 (USD Million)
Table 217 Egypt: Market, By Source, 2013�2020 (MMT)
Table 218 Others in RoW: Wet Waste Management Market, By Service, 2013�2020 (USD Million)
Table 219 Others in RoW: Market, By Service, 2013�2020 (MMT)
Table 220 Others in RoW: Market, By Process, 2013�2020 (USD Million)
Table 221 Others in RoW: Market, By Process, 2013�2020 (MMT)
Table 222 Others in RoW: Market, By Waste Type, 2013�2020 (USD Million)
Table 223 Others in RoW: Market, By Waste Type, 2013�2020 (MMT)
Table 224 Others in RoW: Market, By Source, 2013�2020 (USD Million)
Table 225 Others in RoW: Market, By Source, 2013�2020 (MMT)
Table 226 Mergers & Acquisitions, 2011�2015
Table 227 Parnetships, Joint Ventures, Agreements & Contracts, 2011�2015
Table 228 Investments & Expansions, 2011�2015
Table 229 New Product Launches, 2011�2015
List of Figures (57 Figures)
Figure 1 Wet Waste Management Market Segmentation
Figure 2 Research Design
Figure 3 Global Population Projected to Reach ~9.5 Billion By 2050
Figure 4 Increasing in Middle Class Population, 2009 to 2030
Figure 5 GDP Per Capita, By Country, 2013�2015 (USD Billion)
Figure 6 Market Size Estimation Methodology: Bottom-Up Approach
Figure 7 Market Size Estimation Methodology: Top-Down Approach
Figure 8 Wet Waste Management Market Snapshot, By Service, 2014 2020 (USD Million)
Figure 9 Wet Waste Management Market Size, By Source, 2014�2020 (USD Million)
Figure 10 Wet Waste Management Market Trend, By Region, 2015�2020
Figure 11 Wet Waste Management Market, By Region, 2014
Figure 12 Wet Waste Management Market Share (Developments), 2011�2015
Figure 13 Wet Waste Management Market Scenario
Figure 14 Wet Waste Management Market Size, By Waste Type, 2014�2020 (MMT)
Figure 15 Wet Waste Management Market Size, By Service Type, 2014 vs 2020 (MMT)
Figure 16 Wet Waste Management Market Size, By Process Type, 2014 vs 2020 (USD Million)
Figure 17 Asia-Pacific Wet Waste Management Market Size, By Waste Type, 2015 (USD Million)
Figure 18 Wet Waste Management Market Growth Prospects, 2015�2020 (CAGR%)
Figure 19 Life Cycle Analysis, By Region, 2014
Figure 20 Wet Waste Management Market Dynamics
Figure 21 Global Percentage of Urban Population
Figure 22 Global Biogas Fuel Consumption 2014
Figure 23 Value Chain Analysis of Wet Waste Management
Figure 24 Wet Waste Management Market Size, By Service, 2014 vs 2020 (USD Million)
Figure 25 Wet Waste Management By Service Flow Chart
Figure 26 Wet Waste Management Market Size, By Process, 2014 vs 2020 (MMT)
Figure 27 Wet Waste Management Recycling Process
Figure 28 Anaerobic Digestion for Wet Waste Management
Figure 29 Anaerobic Digester Plant for Wet Waste Management
Figure 30 Incineration Process for Wet Waste Management
Figure 31 Wet Waste Management Market By Waste Type, 2014-2020 (MMT)
Figure 32 Wet Waste Management Market Size, By Source, 2014 vs 2020 (Mt)
Figure 33 North America Wet Waste Management Market Overview
Figure 34 Asia-Pacific Wet Waste Management Market Overview
Figure 35 Asia-Pacific: Market By Service, 2014 vs 2020 (USD Million)
Figure 36 Asia-Pacific: Market By Process, 2014 vs 2020 (USD Million)
Figure 37 Asia-Pacific: Market By Waste Type, 2014 & 2020 (MMT)
Figure 38 Asia-Pacific: Market By Source, 2014 & 2020 (MMT)
Figure 39 China: Wet Waste Management Market, 2013 to 2020 (MMT)
Figure 40 Companies Adopted Merger & Acquisition Strategy From 2011-2015
Figure 41 Acquisition Fueled Growth of the Wet Waste Management Market
Figure 42 Mergers & Acquisitions the Key Strategy, 2011-2015
Figure 43 Geographic Revenue Mix of Top Five Market Players
Figure 44 Waste Management Corporation: Company Snapshot
Figure 45 Waste Management Inc.: SWOT Analysis
Figure 46 Republic Services, Inc.: Company Snapshot
Figure 47 Republic Services: SWOT Analysis
Figure 48 Veolia Environment S.A.: Company Snapshot
Figure 49 Republic Services: SWOT Analysis
Figure 50 Suez Environment: Company Snapshot
Figure 51 Suez Environment: SWOT Analysis
Figure 52 Clean Harbors Inc.: Company Snapshot
Figure 53 Clean Harbors Inc.: SWOT Analysis
Figure 54 Progressive Waste Solutions Ltd.: Company Snapshot
Figure 55 Stericycle: Company Snapshot
Figure 56 Advanced Disposal: Company Snapshot
Figure 57 Covanta: Company Snapshot


Growth opportunities and latent adjacency in Wet Waste Management Market