Epoxy Coatings Market by Technology (Solvent borne, Waterborne, and Powder-Based) and Application (Construction, Transportation, General Industrial, and Others) - Forecast to 2021


[162 Pages Report] The market size of epoxy coatings is estimated to grow from USD 26.34 Billion in 2016 to USD 33.97 Billion by 2021, at a CAGR of 5.22%. The epoxy coatings industry is witnessing high growth because of increasing applications, growing demand from waterborne epoxy coatings, and its rising demand in developing countries. Epoxy coatings are largely used in construction applications. Rapid growth of the epoxy coatings market is driven by increasing demand from its end-use industries. The report covered the epoxy coatings market by technology such as solvent borne, waterborne, and powder-based, and the market by applications such as construction, transportation, general industrial, and others.
Years considered for this report
2014 � Historical Year
2015 � Base Year
2016 � Estimated Year
2021 � Projected Year
Research Methodology
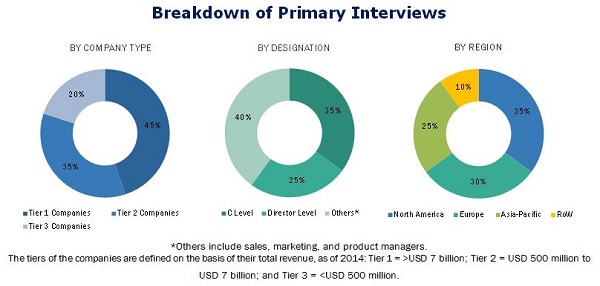
This study aims to estimate the market size of epoxy coatings for 2016 and project its demand by 2021. It also provides a detailed qualitative and quantitative analysis of the epoxy coatings market. Various secondary sources such as directories, industry journals, and databases have been used to identify and collect information useful for this extensive commercial study of the epoxy coatings market. Primary sources such as experts from related industries and suppliers have been interviewed to obtain and verify critical information as well as to assess prospects of the epoxy coatings market.
To know about the assumptions considered for the study, download the pdf brochure
The epoxy coatings value chain includes raw material suppliers, epoxy coatings manufacturers, and end users. Maximum value addition is done during the manufacturing stage of epoxy coatings. The major companies involved in the value chain of epoxy coatings market are BASF SE (Germany), AkzoNobel N.V. (Netherlands), PPG Industries (U.S.), Valspar Corporation (U.S.), and others.
Target Audience:
- Manufacturers of epoxy coatings
- Manufacturers of coatings, resins, additives, pigments, and other feedstock chemicals manufacturers
- Manufacturers in end-use industries, such as construction, transportation, general industrial, and others
- Traders, distributors, and suppliers of epoxy coatings
- Regional manufacturers' associations and paints & coatings associations
- Government and regional agencies and research organizations
�The study answers several questions for the stakeholders, primarily, which market segments to focus on in the next two-to-five years for prioritizing efforts and investments and competitive landscape of the market�.
Scope of the Report:
The epoxy coatings market has been covered in detail in this report. To provide aa complete picture, the current market demand and forecasts have also been included. The epoxy coatings market is segmented as follows:
On the basis of Technology:
- Solvent borne
- Waterborne
- Powder-based
On the basis of Application:
- Construction
- Transportation
- General Industrial
- Others
On the basis of Region:
- Europe
- North America
- Asia-Pacific
- RoW
The market is further analyzed for key countries in each of these regions.
Available Customizations
With the given market data, MarketsandMarkets offers customizations as per the company�s specific needs. The following customization options are available for the report:
Product Analysis
- Product Matrix, which gives a detailed comparison of product portfolio of each company
Regional Analysis
- Further breakdown of the rest of Asia-Pacific epoxy coatings market into Australia, New Zealand, and others
- Further breakdown of the RoW epoxy coatings market into Latin America and the Middle East and Africa.
The epoxy coatings market is estimated to reach USD 33.97 Billion by 2021, at a CAGR of over 5.22% between 2016 and 2021. The drivers identified for the epoxy coatings market are growth in application areas, increased demand for waterborne epoxy coatings, and growing demand from developing nations.
Construction is the largest application of epoxy coatings. The construction industry is driven by rising urbanization in Asia-Pacific and RoW, which has resulted in increased demand for residential, commercial, and industrial infrastructure. Low interest rates on housing loans are also responsible for increase in the demand for new houses, eventually driving the construction application of epoxy coatings.
The powder-based technology of epoxy coatings is growing at the highest rate among all the technologies of epoxy coatings. The demand for epoxy powder-based coatings is expected to increase in the future owing to their non-VOC emission properties, thus providing high growth opportunity to the overall epoxy coatings market.
In the past few years, epoxy powder-based coating has gained substantial popularity as a VOC-free coating technology. This market is expected to grow rapidly in the future with the development of new materials, formulations, and advancement of equipment and application processes. The growth in epoxy powder-based coatings is also driven by high demand from the end-use applications such as construction, transportation, and general industrial.
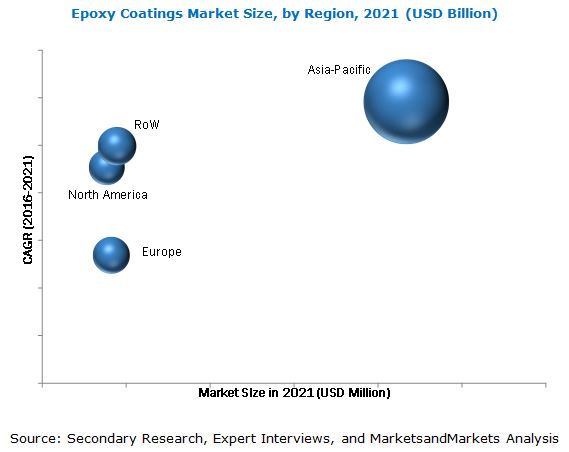
Currently, the Asia-Pacific region is the largest market for epoxy coatings and is estimated to record the highest CAGR. Countries such as China, India, and Japan are expected to lead the Asia-Pacific epoxy coatings market, with China accounting for the largest share in its regional demand. The market size, in terms of volume, of epoxy coatings is comparatively low in the RoW region, but is estimated to witness a moderate CAGR between 2016 and 2021.
Low performance in exterior application and slow growth of epoxy coatings and its application industries in developed countries are restraining the growth of the epoxy coatings market.
The epoxy coatings market is highly competitive, with key market players, such as BASF SE (Germany), AkzoNobel N.V. (Netherlands), Axalata Coating System LLC (U.S.), PPG Industries (U.S.), The Valspar Corporation (U.S.), Sherwin-Williams Company (U.S.), and Nippon Paints Co. Ltd. (Japan), having a sizable share in the global market. New product launches; agreements, partnerships, and joint ventures; expansions; and mergers & acquisitions are some of the key strategies adopted by the market players to expand their global presence and product portfolio. Maximum number of market activities took place in 2013. The leading players, such as BASF SE (Germany), AkzoNobel N.V. (Netherlands), Valspar Corporation (U.S.), The Sherwin-Williams Company, and PPG Industries (U.S.), contributed mainly in terms of number of developments. New product launches and agreements are key strategies adopted between 2012 and 2016.
To speak to our analyst for a discussion on the above findings, click Speak to Analyst
 Exclusive indicates content/data unique to MarketsandMarkets and not available with any competitors.
Table of Contents
1 Introduction (Page No. - 16)
1.1 Objectives of the Study
1.2 Market Definition
1.3 Markets Scope
1.3.1 Markets Covered
1.3.2 Years Considered for the Study
1.4 Currency
1.5 Package Size
1.6 Limitations
1.7 Stakeholders
2 Research Methodology (Page No. - 20)
2.1 Research Data
2.1.1 Secondary Data
2.1.1.1 Key Data From Secondary Sources
2.2 Primary Data
2.2.1 Key Data From Primary Sources
2.2.2 Key Industry Insights
2.2.3 Breakdown of Primary Interviews
2.3 Market Size Estimation
2.3.1 Bottom-Up Approach
2.3.2 Top-DOWn Approach
2.4 Data Triangulation
2.5 Research Assumptions
3 Executive Summary (Page No. - 31)
4 Premium Insights (Page No. - 35)
4.1 Attractive Opportunities in the Epoxy Coatings Market
4.2 Epoxy Coatings Market: Developed vs. Developing Countries
4.3 Epoxy Coatings: Life Cycle Analysis, By Region
5 Market Overview (Page No. - 40)
5.1 Introduction
5.1.1 Market Segmentation
5.2 Market Dynamics
5.2.1 Drivers
5.2.1.1 Increasing Demand for Waterborne Epoxy Coatings
5.2.1.2 High Growth in End-Use Industries
5.2.1.3 Increasing Demand From Developing Countries
5.2.2 Restraints
5.2.2.1 Low Performance in Exterior Applications
5.2.2.2 Slow Growth in Developed Countries
5.2.3 Opportunities
5.2.3.1 High Growth in Powder-Based Epoxy Coatings Market
5.2.3.2 High Economic Growth in Emerging Economies
5.2.4 Challenges
5.2.4.1 Stringent Regulations From Governments and Institutions
5.2.4.2 Fluctuating Raw Material Prices
6 Industry Trends (Page No. - 47)
6.1 Introduction
6.2 Value-Chain Analysis
6.3 Porter�s Five Forces Analysis
6.3.1 Threat From New Entrants
6.3.2 Threat of Substitutes
6.3.3 Bargaining Power of Buyers
6.3.4 Bargaining Power of Suppliers
6.3.5 Intensity of Rivalry
6.4 Cost & Profit Margin Analysis of Paints & Coatings Industry
7 Patent Details (Page No. - 53)
7.1 Introduction
8 Revenue Pocket Matrix (Page No. - 56)
8.1 Revenue Pocket Matrix of Epoxy Coatings, By Technology
8.2 Revenue Pocket Matrix of Epoxy Coatings, By Application
9 Epoxy Coatings Market, By Technology (Page No. - 58)
9.1 Introduction
9.2 Waterborne
9.2.1 Applications of Waterborne Coatings
9.2.2 Advantages and Disadvantages
9.3 Solvent Borne
9.3.1 Advantages and Disadvantages
9.4 Powder-Based
9.4.1 Advantages and Disadvantages of Powder-Based Coatings
10 Epoxy Coatings Market, By Application (Page No. - 68)
10.1 Introduction
10.2 Construction
10.3 Transportation
10.4 General Industrial
10.5 Others
11 Epoxy Coatings Market, By Region (Page No. - 76)
11.1 Introduction
11.2 Asia-Pacific
11.2.1 China
11.2.1.1 China Macroeconomic Indicators
11.2.2 India
11.2.2.1 India Macroeconomic Indicators
11.2.3 Japan
11.2.3.1 Japan Macroeconomic Indicators
11.2.4 South Korea
11.2.4.1 South Korea Macroeconomic Indicators
11.2.5 Indonesia
11.2.5.1 Indonesia Macroeconomic Indicators
11.2.6 Thailand
11.2.6.1 Thailand Macroeconomic Indicators
11.2.7 Malaysia
11.2.7.1 Malaysia Macroeconomic Indicators
11.2.8 Others
11.3 North America
11.3.1 U.S.
11.3.1.1 U.S. Macroeconomic Indicators
11.3.2 Mexico
11.3.2.1 Mexico Macroeconomic Indicators
11.3.3 Canada
11.3.3.1 Canada Macroeconomic Indicators
11.4 Europe
11.4.1 Germany
11.4.1.1 Germany Macroeconomic Indicators
11.4.2 Spain
11.4.2.1 Spain Macroeconomic Indicators
11.4.3 U.K
11.4.3.1 U.K. Macroeconomic Indicators
11.4.4 France
11.4.4.1 France Macroeconomic Indicators
11.4.5 Russia
11.4.5.1 Russia Macroeconomic Indicators
11.4.6 Turkey
11.4.6.1 Turkey Macroeconomic Indicators
11.4.7 Others
11.5 RoW
11.5.1 Middle East
11.5.2 South America
11.5.3 Others
12 Competitive Landscape (Page No. - 118)
12.1 Introduction
12.2 Maximum Developments Between 2012 and 2016
12.3 Growth Strategies in the Epoxy Coatings Market
12.4 Competitive Situation and Trends
12.4.1 New Product Developments and Launches
12.4.2 Partnerships, Agreements, and Collaborations
12.4.3 Expansions
12.4.4 Mergers & Acquisitions
12.5 Product Portfolio Mapping
13 Company Profiles (Page No. - 125)
(Overview, Financial*, Products & Services, Strategy, and Developments)
13.1 BASF SE
13.2 Akzonobel N.V.
13.3 PPG Industries
13.4 RPM International Inc.
13.5 The Sherwin-Williams Company
13.6 The Valspar Corporation
13.7 Axalta Coating Systems LLC
13.8 Nippon Paint Co. Ltd.
13.9 Kansai Paint Co. Ltd.
13.10 Tikkurila OYJ
13.11 Berger Paints India Ltd.
*Details Might Not Be Captured in Case of Unlisted Companies.
14 Appendix (Page No. - 155)
14.1 Insights From Industry Experts
14.2 Discussion Guide
14.3 Knowledge Store: Marketsandmarkets� Subscription Portal
14.4 Introducing RT: Real-Time Market Intelligence
14.5 Available Customizations
14.6 Related Reports
List of Tables (111 Tables)
Table 1 Asia-Pacific Accounted for A Major Share in the Epoxy Coatings Market
Table 2 Market Segmentation, By Technology
Table 3 Epoxy Coatings Market Segmentation
Table 4 Patent Details
Table 5 Epoxy Coatings Market Size, By Technology, 2014�2021 (Kiloton)
Table 6 Epoxy Coatings Market Size, By Technology, 2014�2021 (USD Million)
Table 7 Waterborne Epoxy Coatings Market Size, By Region,2014�2021 (Kiloton)
Table 8 Waterborne Epoxy Coatings Market Size, By Region,2014�2021 (USD Million)
Table 9 Traditional Formulation Solvent Used for Each Resin Type
Table 10 Solvent Borne Epoxy Coatings Market Size, By Region,2014�2021 (Kiloton)
Table 11 Solvent Borne Epoxy Coatings Market Size, By Region, 2014�2021 (USD Million)
Table 12 Powder-Based Epoxy Coatings Market Size, By Region,2014�2021 (Kiloton)
Table 13 Powder-Based Epoxy Coatings Market Size, By Region, 2014�2021 (USD Million)
Table 14 Epoxy Coatings Market Size, By Application, 2014�2021 (Kiloton)
Table 15 Epoxy Coatings Market Size, By Application, 2014�2021 (USD Million)
Table 16 Epoxy Coatings Market Size in Construction Application, By Region, 2014�2021 (Kiloton)
Table 17 Epoxy Coatings Market Size in Construction Application, By Region, 2014�2021 (USD Million)
Table 18 Epoxy Coatings Market Size in Transportation Application, By Region, 2014�2021 (Kiloton)
Table 19 Epoxy Coatings Market Size in Transportation Application, By Region, 2014�2021 (USD Million)
Table 20 Epoxy Coatings Market Size in General Industrial Application, By Region, 2014�2021 (Kiloton)
Table 21 Epoxy Coatings Market Size in General Industrial Application, By Region, 2014�2021 (USD Million)
Table 22 Epoxy Coatings Market Size in Others Application, By Region, 2014�2021 (Kiloton)
Table 23 Epoxy Coatings Market Size in Others Application, By Region, 2014�2021 (USD Million)
Table 24 Epoxy Coatings Market Size, By Region, 2014�2021 (Kiloton)
Table 25 Epoxy Coatings Market Size, By Region, 2014�2021 (USD Million)
Table 26 Asia-Pacific: By Market Size, By Country,2014�2021 (Kiloton)
Table 27 Asia-Pacific: By Market Size, By Country, 2014�2021 (USD Million)
Table 28 Asia-Pacific: By Market Size, By Technology, 2014�2021 (Kiloton)
Table 29 Asia-Pacific: By Market Size, By Technology, 2014�2021 (USD Million)
Table 30 Asia-Pacific: By Market Size, By Application,2014�2021 (Kiloton)
Table 31 Asia-Pacific: By Market Size, By Application, 2014�2021 (USD Million)
Table 32 China: Macroeconomic Indicators
Table 33 China: By Market Size, By Application, 2014�2021 (Kiloton)
Table 34 China: By Market Size By Application,2014�2021 (USD Million)
Table 35 India: Macroeconomic Indicators
Table 36 India: By Market Size, By Application, 2014�2021 (Kiloton)
Table 37 India: By Market Size, By Application,2014�2021 (USD Million)
Table 38 Japan: Macroeconomic Indicators
Table 39 Japan: By Market Size, By Application, 2014�2021 (Kiloton)
Table 40 Japan: By Market Size, By Application,2014�2021 (USD Million)
Table 41 South Korea: Macroeconomic Indicators
Table 42 South Korea: By Market Size, By Application, 2014�2021 (Kiloton)
Table 43 South Korea: By Market Size, By Application, 2014�2021 (USD Million)
Table 44 Indonesia: Macroeconomic Indicators
Table 45 Indonesia: By Market Size, By Application,2014�2021 (Kiloton)
Table 46 Indonesia: By Market Size, By Application, 2014�2021 (USD Million)
Table 47 Thailand: Macroeconomic Indicators
Table 48 Thailand: By Market Size, By Application,2014-2021 (Kiloton)
Table 49 Thailand: By Market Size, By Application, 2014�2021 (USD Million)
Table 50 Malaysia: Macroeconomic Indicators
Table 51 Malaysia: By Market Size, By Application,2014-2021 (Kiloton)
Table 52 Malaysia: By Market Size, By Application, 2014-2021 (USD Million)
Table 53 Others: By Market Size, By Application, 2014-2021 (Kiloton)
Table 54 Others: By Market Size, By Application,2014-2021 (USD Million)
Table 55 North America: By Market Size, By Country,2014-2021 (Kiloton)
Table 56 North America: By Market Size, By Country, 2014�2021 (USD Million)
Table 57 North America: By Market Size, By Technology, 2014�2021 (Kiloton)
Table 58 North America: By Market Size, By Technology, 2014-2021 (USD Million)
Table 59 North America: By Market Size, By Application, 2014-2021 (Kiloton)
Table 60 North America: By Market Size, By Application, 2014�2021 (USD Million)
Table 61 U.S.: Macroeconomic Indicators
Table 62 U.S.: By Market Size, By Application, 2014�2021 (Kiloton)
Table 63 U.S.: By Market Size, By Application,2014�2021 (USD Million)
Table 64 Mexico Macroeconomic Indicators
Table 65 Mexico: By Market Size, By Application, 2014�2021 (Kiloton)
Table 66 Mexico: By Market Size, By Application,2014�2021 (USD Million)
Table 67 Canada Macroeconomic Indicators
Table 68 Canada: By Market Size, By Application,2014�2021 (Kiloton)
Table 69 Canada: By Market Size, By Application,2014�2021 (USD Million)
Table 70 Europe: By Market Size, By Country, 2014�2021 (Kiloton)
Table 71 Europe: By Market Size, By Country,2014�2021 (USD Million)
Table 72 Europe: By Market Size, By Technology Type,2014�2021 (Kiloton)
Table 73 Europe: By Market Size, By Technology,2014�2021 (USD Million)
Table 74 Europe: By Market Size, By Application,2014�2021 (Kiloton)
Table 75 Europe: By Market Size, By Application,2014�2021 (USD Million)
Table 76 Germany: Macroeconomic Indicators
Table 77 Germany: By Market Size, By Application,2014�2021 (Kiloton)
Table 78 Germany: By Market Size, By Application, 2014�2021 (USD Million)
Table 79 Spain: Macroeconomic Indicators
Table 80 Spain: By Market Size, By Application,2014 - 2021 (Kiloton)
Table 81 Spain: By Market Size, By Application,2014�2021 (USD Million)
Table 82 U.K.: Macroeconomic Indicators
Table 83 U.K.: By Market Size, By Application, 2014�2021 (Kiloton)
Table 84 U.K.: By Market Size, By Application,2014�2021 (USD Million)
Table 85 France: Macroeconomic Indicators
Table 86 France: By Market Size, By Application,2014�2021 (Kiloton)
Table 87 France: By Market Size, By Application,2014�2021 (USD Million)
Table 88 Russia: Macroeconomic Indicators
Table 89 Russia: By Market Size, By Application, 2014�2021 (Kiloton)
Table 90 Russia: By Market Size, By Application,2014�2021 (USD Million)
Table 91 Turkey: Macroeconomic Indicators
Table 92 Turkey: By Market Size, By Application, 2014�2021 (Kiloton)
Table 93 Turkey: By Market Size, By Application,2014�2021 (USD Million)
Table 94 Others: By Market Size, By Application,2014�2021 (Kiloton)
Table 95 Others: By Market Size, By Application,2014�2021 (USD Million)
Table 96 RoW: By Market Size, By Country, 2014�2021 (Kiloton)
Table 97 RoW: By Market Size, By Country, 2014�2021 (USD Million)
Table 98 RoW: By Market Size, By Technology, 2014�2021 (Kiloton)
Table 99 RoW: By Market Size, By Technology,2014�2021 (USD Million)
Table 100 RoW: By Market Size, By Application, 2014�2021 (Kiloton)
Table 101 RoW: By Market Size, By Application,2014�2021 (USD Million)
Table 102 Middle East: Epoxy Coatings Market Size, By Application,2014�2021 (Kiloton)
Table 103 Middle East: Epoxy Coatings Market Size, By Application, 2014�2021 (USD Million)
Table 104 South America: Epoxy Coatings Market Size, By Application, 2014�2021 (Kiloton)
Table 105 South America: Epoxy Coatings Market Size, By Application, 2014�2021 (USD Million)
Table 106 Others: Epoxy Coatings Market Size, By Application, 2014-2021 (Kiloton)
Table 107 Others: Epoxy Coatings Market Size, By Application, 2014-2021 (Kiloton)
Table 108 New Product Developments and Launches, 2012�2016
Table 109 Partnerships, Agreements, and Collaborations, 2012�2016
Table 110 Expansion, 2012�2016
Table 111 Mergers & Acquisitions, 2012�2016
List of Figures (58 Figures)
Figure 1 Epoxy Coatings Market Segmentation
Figure 2 Epoxy Coatings: Research Design
Figure 3 Bottom-Up Approach
Figure 4 Top-Down Approach
Figure 5 Data Triangulation
Figure 6 Assumptions of the Research Study
Figure 7 Construction Application of Epoxy Coatings to Grow at the Highest Rate Between 2016 and 2021
Figure 8 Asia-Pacific to Have Highest Growth During the Forecast Period,2016-2021 (USD Million)
Figure 9 Epoxy Coatings Market to Record High Growth Between 2016 and 2021
Figure 10 Construction and Transportation Applications to Register the Highest CAGR Between 2016 and 2021
Figure 11 China Accounts for Major Share in the Asia-Pacific Epoxy Coatings Market
Figure 12 India and China to Register the Highest CAGR in the Epoxy Coatings Market Between 2016 and 2021
Figure 13 Epoxy Coatings Market in Developing Countries to Grow Faster Than Developed Countries
Figure 14 Epoxy Coatings to Witness High Growth Between 2016 and 2021 in Asia-Pacific and RoW
Figure 15 Drivers, Restrains, Opportunities, and Challenges in the Epoxy Coatings Market
Figure 16 High Investment in Infrastructure Development in Emerging Countries By 2017
Figure 17 Fluctuations in Crude Oil Prices Negatively Affect Base Raw Material Prices
Figure 18 Overview of Value Chain of the Epoxy Coatings Market
Figure 19 Porter�s Five Forces Analysis of the Epoxy Coatings Market
Figure 20 Gross Profit Margin of Major Paints & Coatings Players in 2015
Figure 21 The Sherwin-Williams Company Registered the Highest Ebitda in 2015
Figure 22 Europe Accounted for the Highest Number of Patents in 2015
Figure 23 DOW Global Technologies Had the Highest Number of Patents in 2015
Figure 24 Solvent Borne Technology is Estimated to Have the Largest Share in Epoxy Coatings Market (2016�2021)
Figure 25 Waterborne Coatings Adoption in Markets, 1970�1990
Figure 26 Types of Waterborne Coatings
Figure 27 Drivers and Restraints of Waterborne Coatings
Figure 28 Construction Application to Witness the Highest Growth in the Epoxy Coatings Market Between 2016 and 2021
Figure 29 Countries Snapshot (2016-2021): Fastest-Growing Markets Emerging as New Hot Spots
Figure 30 China and India are the Major Markets for Epoxy Coatings in Asia-Pacific
Figure 31 U.S.: the Largest Market for Epoxy Coatings in North America
Figure 32 Russia and Germany is the Largest Markets of Epoxy Coatings in Europe
Figure 33 Companies Adopted New Product Launches and Agreements as Their Key Growth Strategies
Figure 34 Maximum Developments in Epoxy Coatings Market Witnessed in 2013
Figure 35 New Product Launches: the Most Popular Growth Strategy
Figure 36 Akzonobel N.V. and Sherwin-Williams Company Have Broad Product Portfolio for Epoxy Coatings Products
Figure 37 BASF SE: Company Snapshot
Figure 38 BASF SE: SWOT Analysis
Figure 39 Akzonobel N.V.: Company Snapshot
Figure 40 Akzonobel N.V.: SWOT Analysis
Figure 41 PPG Industries: Company Snapshot
Figure 42 PPG Industries: SWOT Analysis
Figure 43 RPM International Inc.: Company Snapshot
Figure 44 RPM International: SWOT Analysis
Figure 45 The Sherwin-Williams Company: Company Snapshot
Figure 46 The Sherwin-Williams Company: SWOT Analysis
Figure 47 The Valspar Corporation: Company Snapshot
Figure 48 The Valspar Corporation: SWOT Analysis
Figure 49 Axalata Coating Systems LLC: Company Snapshot
Figure 50 Axalta Coating Systems LLC: SWOT Analysis
Figure 51 Nippon Paint Co. Ltd.: Company Snapshot
Figure 52 Nippon Paint Co. Ltd.: SWOT Analysis
Figure 53 Kansai Paint Co. Ltd.: Company Snapshot
Figure 54 Kansai Paint Co. Ltd.: SWOT Analysis
Figure 55 Tikkurila OYJ: Company Snapshot
Figure 56 Tikkurila OYJ : SWOT Analysis
Figure 57 Berger Paints India Ltd.: Company Snapshot
Figure 58 Berger Paints India Ltd.: SWOT Analysis


Growth opportunities and latent adjacency in Epoxy Coatings Market