ESG Reporting Software Market

ESG Reporting Software Market by Component (Solutions, Services), Deployment Type (On-premises, Cloud), Organization Size (Large Enterprises, SMEs), Vertical (BFSI, Government, Public Sector & Non-Profit, Retail) and Region - Global Forecast to 2027

Report Code: TC 8523 Dec, 2022, by marketsandmarkets.com

Updated on : May 9, 2023

ESG Reporting Software Market Analysis

The global ESG reporting software market size in terms of revenue was reasonably estimated at $0.7 billion in 2022 and is anticipated to rise to $1.5 billion by 2027, presenting a CAGR of 15.9%. ESG reporting software automates the collection and organization of ESG data to assist businesses in meeting various disclosure requirements and evaluating key performance indicators. ESG reporting is the publication of information about a company's operations in three areas: environmental, social, and corporate governance. To identify growth opportunities and material risks, investors are increasingly incorporating ESG factors into their company analysis. Few driving forces of this market include consistent growth in corporate data volume, consistent throughput of existing applications, spike in amount of credible corporate disclosures.

ESG Reporting Software Market

To know about the assumptions considered for the study, Request for Free Sample Report

ESG Reporting Software Market Dynamics;

Driver: Consistent growth in corporate data volume

Digitalization has offered various benefits and hence calls for efficient resource planning. Several organizations are currently compelled to store digitalized data securely to improve efficiency at a lower cost. Hence, a cost-effective and efficient cloud-based information management infrastructure offers a feasible option in such scenarios. It offers advantages such as minimal IT infrastructure support and swiftly leveraging the cloud-based data across organizations. An improved financial performance of an organization due to ESG becomes a greater marked factor in the longer sustainability run. Per a report published Oct 2021, ESG data spending is growing at 20% Y-o-Y.

Restraint: Huge initial capital expenditure

Higher expenditure is required to replace existing infrastructure with EHS (Environment, Health & Safety) infrastructure. Therefore, a large amount of capital is required inevitably for infrastructure investments in EHS solutions, which ultimately limits the growth of the global investor ESG software market. The difficulty in integrating ESG software with the ERP systems of enterprises is another major and significant challenge in the market. ESG standards are involved in most of the operational activities of an enterprise across vertical and regions. However, the advantages of EHS standards can be achieved by integrating them with an ERP system. Having said that, this integration is challenging all the way more, as the IT infrastructure (design and structure) of a company might not support the investor ESG software.

Opportunity: Climate stress testing to gain traction among financial services organizations

Major financial institutions and policymakers have begun to acknowledge the associated long-term threat to financial stability. They’re also starting to recognize the critical and crucial role that financing will play in facilitating the low-carbon transformation or transition and ensuring the climate resiliency of the economy. Increasingly, based on the research findings of the Network for Greening the Financial System (NGFS), central banks have commenced incorporating climate risk as a stress testing feature for banks and insurers. The European Central Bank’s economy-wide climate stress testing in 2021 delivered the need for banks to enhance assessment of their exposure to both climate transition risks and physical risks in order to proactively manage and tackle them. For instance, in the US, the Federal Reserve is calculating the implications of climate-related risks for financial institutions and the financial system. China, on the other hand, has been evaluating measures of incorporating climate change risk in its stress testing of financial institutions. A larger portion of the work on climate stress tests comes from collaborative work globally by central banks. Insurance regulators are also incorporating parallel steps to integrate sustainability, climate risks, into their judicious frameworks.

Challenge: Turning net-zero pledges into nearby-term action

The number of government and large-sized companies that have set goals to reach net zero emissions by 2050 has grown rapidly. But these commitments often contained this setback of interim emission reduction targets or plans to prevent/curb indirect emissions that happen along the supply chain. In 2022, it is estimated that pressure from shareholders and other stakeholders will rise on those entities, organizations in order to develop concrete, near-term plans and begin to act to address emissions across the full value chain. With stakes high, investors will likely demand more than merely setting long-term climate commitments. It’s forecasted that governments and companies will have to provide credible, viable near-term milestones on their path to decarbonization. Again, moving beyond the established focus on emission reductions, the spotlight will extend to how these entities manage exposure to physical climate risks, including the presence and adequate design followed by implementation of adaptation and resiliency planning.

Based on organization size, SMEs segment to grow at higher CAGR in the ESG Reporting software market during the forecast period.

ESG initiatives have also been shown to improve efficiencies, lower costs, and boost employee productivity among SMEs. While mandatory ESG regulation is slowly being adopted, SMEs can get ahead of the curve by identifying relevant voluntary frameworks and matching their ESG priorities to best practice. This allows them to capitalize on the head start they have over slower-moving competitors. Businesses could begin with world-renowned frameworks like the Global Reporting Initiative (GRI), which assists businesses in measuring a variety of ESG issues ranging from carbon emissions to human rights and compliance. Transparency is a key trait of ESG.

Based on vertical, BFSI segment to grow at the highest CAGR during the forecast period

Businesses and economies are constantly confronted with sustainability challenges such as climate change, social outbreaks, health crises, and corporate governance. As a result, the risk for BFSI firms and capital invested as financial support (loans, investment services, and so on) to BFSI customers increases. ESG factors have been incorporated into BFSI firms' business processes. Previously, adoption was primarily focused on risk and compliance, operational and process efficiencies, and now even integrating ESG into product innovation to drive purpose. The financial services industry has seen a significant increase in the use of ESG. E.g., BFSI firms have shifted their focus away from CSR and toward a more focused ESG agenda, embracing integration to develop sustainable practices and purpose-driven best practices to meet sustainability goals. Climate change, rising temperatures, and an increase in weather-related disasters have compelled BFSI firms to reconsider their approach to mitigating climate risk in their portfolios. The firms constantly assess their investment, lending, and other critical operational policies. To integrate ESG performance factors and assess their customers' financial performance.

ESG Reporting Software Market Size, and Share

To know about the assumptions considered for the study, download the pdf brochure

North America to grow significantly during the forecast period

The region has witnessed a growing adoption of ESG reporting solutions with industrialization, as the world is moving towards industry 4.0. The regional market has been steadily showing positive trends as several companies and industries are adopting ESG reporting software solutions and services at various levels as a part of their strategy to sustain in the market and increase their productivity. Adoption of technologically advanced mobile devices is driving the market in the region as individuals and enterprises are technologically advanced. It has been statistically inferred that this region has increasingly critical importance of transparent, accurate, and comparable ESG data and analytics, predominantly for the financial industry.

Key Market Players

The ESG Reporting software market is dominated by vendors such as Wolters Kluwer (Netherlands), Nasdaq (US), PwC (UK), Workiva (US), Refinitiv (UK), Diligent (US), Sphera (US), Cority (Canada), Intelex (Canada), Greenstone (UK), Novisto (Canada), Emex (Ireland), Enhelix (US), Anthesis (UK), Diginex (Hong Kong), Bain & Co. (US), Keramida (US), Isometrix (US), Accuvio (acquired by Diligent) (US).

Get online access to the report on the World's First Market Intelligence Cloud

  • Easy to Download Historical Data & Forecast Numbers
  • Company Analysis Dashboard for high growth potential opportunities
  • Research Analyst Access for customization & queries
  • Competitor Analysis with Interactive dashboard
  • Latest News, Updates & Trend analysis
Request Sample

Scope of the Report

Report Metrics

Details

Market size value in 2022

$0.7 billion

Revenue forecast in 2027

$1.5 billion

Growth Rate

15.9% CAGR

Market size available for years 2018–2027
Base year considered 2021
Forecast period 2022–2027
Forecast units Billion (USD)
Segments covered Component, deployment type, organization size, vertical and region
Geographies covered North America, Asia Pacific, Europe, Middle East & Africa, and Latin America
Companies covered Wolters Kluwer (Netherlands), Nasdaq (US), PwC (UK), Workiva (US), Refinitiv (UK), Diligent (US), Sphera (US), Cority (Canada), Intelex (Canada), Greenstone (UK), Novisto (Canada), Emex (Ireland), Enhelix (US), Anthesis (UK), Diginex (Hong Kong), Bain & Co. (US), Keramida (US), Isometrix (US)

This research report categorizes the ESG Reporting Software market based on Component, deployment type, organization size, vertical and region.

Based on Component:
  • Solutions
  • Services
Based on Deployment type:
  • On-premises
  • Cloud
Based on Organization Size:
  • SMEs
  • Large Enterprises
Based on Vertical:
  • Banking, Financial Services, and insurance
  • IT and ITeS
  • Government and Public Sector
  • Manufacturing
  • Retail and Consumer Goods
  • Healthcare and Life Sciences
  • Energy and Utilities
  • Other Verticals
Based on Regions:
  • North America
    • US
    • Canada
  • Europe
    • UK
    • Germany
    • Rest of Europe
  • Asia Pacific
    • China
    • Japan
    • Rest of Asia Pacific
  • Middle East & Africa
    • KSA
    • UAE
    • Rest of Middle East & Africa
  • Latin America
    • Brazil
    • Rest of Latin America

Recent Developments

  • In May 2022, PwC and Sphera formed an alliance to accelerate scale-up of leading ESG management platform. This alliance aims to leverage Sphera's track record of successful ESG platform customer deployments and PwC's proven technology and strategy consulting capabilities to rapidly expand the Sphera customer base, expand the use of the Sphera platform's suite of capabilities, and create a stronger ESG digital ecosystem for its customers.
  • In April 2022, Wolters Kluwer launched version 9.4 of the Enablon Vision Platform, which includes enhancements that will allow for greater collaboration and integration, as well as improved communications and mobility. It enables organizations to work together in new ways to manage risk It is built on a foundation that is intended to provide a comprehensive 360° view of risk by breaking down silos between EHS, risk, sustainability, and compliance; integrating safety, risk, and operations processes; connecting workers via mobility; and predicting and preventing incidents.
  • In June 2021, Nasdaq launched its ESG Data Hub, the most recent addition to Nasdaq's growing suite of products aimed at assisting investors in making sustainable investment decisions. The new platform connects investors with expert led ESG data sets from leading providers in a variety of areas, including gender diversity, carbon emissions, and climate risk, providing detailed and actionable intelligence on companies' ESG profiles.

Frequently Asked Questions (FAQ):

To speak to our analyst for a discussion on the above findings, click Speak to Analyst

TABLE OF CONTENTS
 
1 INTRODUCTION (Page No. - 22)
    1.1 STUDY OBJECTIVES 
    1.2 MARKET DEFINITION 
           1.2.1 INCLUSIONS & EXCLUSIONS
    1.3 MARKET SCOPE 
           1.3.1 MARKET SEGMENTATION
           1.3.2 REGIONS COVERED
           1.3.3 YEARS CONSIDERED
    1.4 CURRENCY CONSIDERED 
           TABLE 1 UNITED STATES DOLLAR EXCHANGE RATE, 2017–2021
    1.5 STAKEHOLDERS 
 
2 RESEARCH METHODOLOGY (Page No. - 26)
    2.1 RESEARCH DATA 
           FIGURE 1 ESG REPORTING SOFTWARE MARKET: RESEARCH DESIGN
           2.1.1 SECONDARY DATA
           2.1.2 PRIMARY DATA
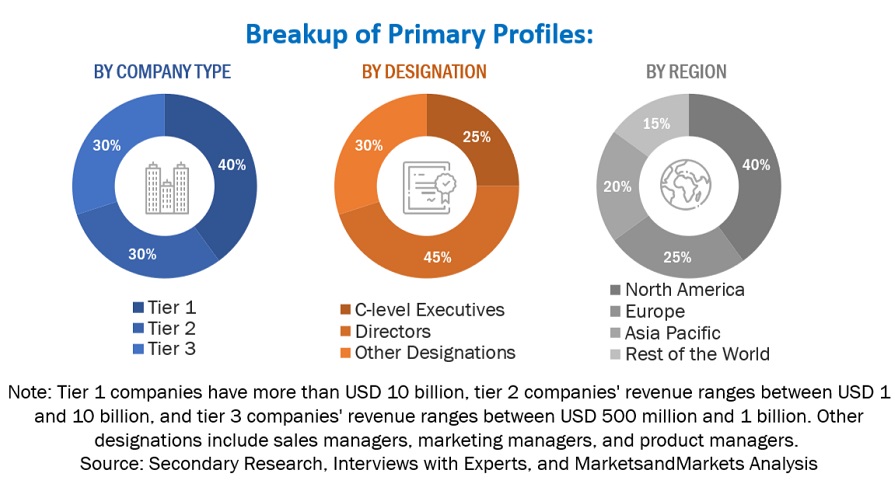
                    2.1.2.1 Breakup of primary profiles
                               FIGURE 2 BREAKUP OF PRIMARY INTERVIEWS: BY COMPANY TYPE, DESIGNATION, AND REGION
                    2.1.2.2 Key industry insights
    2.2 MARKET BREAKUP AND DATA TRIANGULATION 
           FIGURE 3 DATA TRIANGULATION
    2.3 MARKET SIZE ESTIMATION 
           FIGURE 4 ESG REPORTING SOFTWARE MARKET: TOP-DOWN AND BOTTOM-UP APPROACHES
           FIGURE 5 MARKET SIZE ESTIMATION METHODOLOGY – APPROACH 1 (SUPPLY SIDE): REVENUE OF ESG REPORTING SOFTWARE FROM VENDORS
           FIGURE 6 MARKET SIZE ESTIMATION METHODOLOGY: BOTTOM-UP APPROACH (SUPPLY SIDE) - COLLECTIVE REVENUE OF ESG REPORTING SOFTWARE VENDORS
           FIGURE 7 MARKET SIZE ESTIMATION METHODOLOGY - APPROACH 2 (DEMAND SIDE): MARKET
           FIGURE 8 MARKET SIZE ESTIMATION METHODOLOGY (SUPPLY SIDE): VENDOR-REVENUE ESTIMATION
    2.4 MARKET FORECAST 
           TABLE 2 FACTOR ANALYSIS
    2.5 COMPANY EVALUATION MATRIX METHODOLOGY 
           FIGURE 9 COMPANY EVALUATION MATRIX: CRITERIA WEIGHTAGE
    2.6 ASSUMPTIONS 
    2.7 LIMITATIONS 
 
3 EXECUTIVE SUMMARY (Page No. - 38)
    FIGURE 10 ESG REPORTING SOFTWARE MARKET: GLOBAL SNAPSHOT 
    FIGURE 11 HIGH-GROWTH SEGMENTS IN MARKET 
    FIGURE 12 TOP VERTICALS IN MARKET, 2022 VS. 2027 (USD MILLION) 
    FIGURE 13 MARKET: REGIONAL SNAPSHOT 
 
4 PREMIUM INSIGHTS (Page No. - 43)
    4.1 BRIEF OVERVIEW OF MARKET 
           FIGURE 14 INCREASING ESG INVESTMENTS FROM LOCAL AND GLOBAL ENTERPRISES TO DRIVE MARKET
    4.2 MARKET, BY COMPONENT, 2022 VS. 2027 
           FIGURE 15 SOLUTIONS TO ACCOUNT FOR LARGER SHARE DURING FORECAST PERIOD
    4.3 MARKET, BY DEPLOYMENT TYPE, 2022 VS. 2027 
           FIGURE 16 ON-PREMISES DEPLOYMENT TO REMAIN DOMINANT
    4.4 MARKET, BY ORGANIZATION SIZE, 2022 VS. 2027 
           FIGURE 17 LARGE ENTERPRISES TO BE MAJOR USERS
    4.5 MARKET, BY VERTICAL, 2022 VS. 2027 
           FIGURE 18 BANKING, FINANCIAL SERVICES, AND INSURANCE TO ACCOUNT FOR LARGEST SHARE DURING FORECAST PERIOD
    4.6 MARKET - INVESTMENT SCENARIO 
           FIGURE 19 ASIA PACIFIC TO EMERGE AS BEST MARKET FOR INVESTMENTS IN NEXT FIVE YEARS
 
5 MARKET OVERVIEW AND INDUSTRY TRENDS (Page No. - 46)
    5.1 INTRODUCTION 
    5.2 MARKET DYNAMICS 
           FIGURE 20 ESG REPORTING SOFTWARE MARKET: DRIVERS, RESTRAINTS, OPPORTUNITIES, AND CHALLENGES
           5.2.1 DRIVERS
                    5.2.1.1 Consistent growth in corporate data volume
                    5.2.1.2 Surge in growth of credible corporate disclosures
                    5.2.1.3 Consistent throughput of existing applications
                    5.2.1.4 Providing graphical materiality map in visualizing important pointers
           5.2.2 RESTRAINTS
                    5.2.2.1 Huge initial capital expenditure
                    5.2.2.2 Multiple ESG frameworks
           5.2.3 OPPORTUNITIES
                    5.2.3.1 Climate stress testing to gain traction among financial services organizations
                    5.2.3.2 Assessment of natural capital and biodiversity risks to grow significantly
           5.2.4 CHALLENGES
                    5.2.4.1 Turning net zero pledges into near-term action
                    5.2.4.2 Rising pressure on corporate boards and government leaders to enhance ESG skills
    5.3 CASE STUDY ANALYSIS 
           5.3.1 CASE STUDY 1: ESG PERFORMANCE ANALYTICS TO DELIVER EXCELLENCE
           5.3.2 CASE STUDY 2: MAKING STANDARDIZATION ACHIEVABLE
           5.3.3 CASE STUDY 3: REDUCED ENERGY USAGE
    5.4 VALUE CHAIN ANALYSIS 
           FIGURE 21 ESG REPORTING SOFTWARE MARKET: VALUE CHAIN
    5.5 PATENT ANALYSIS 
           FIGURE 22 NUMBER OF PATENT DOCUMENTS PUBLISHED OVER LAST 10 YEARS
           FIGURE 23 TOP FIVE PATENT OWNERS (GLOBAL)
           TABLE 3 TOP TEN PATENT APPLICANTS (US)
    5.6 PORTER’S FIVE FORCES ANALYSIS 
           FIGURE 24 MARKET: PORTER’S FIVE FORCES ANALYSIS
           TABLE 4 ESG REPORTING SOFTWARE: PORTER’S FIVE FORCES ANALYSIS
           5.6.1 THREAT OF NEW ENTRANTS
           5.6.2 THREAT OF SUBSTITUTES
           5.6.3 BARGAINING POWER OF SUPPLIERS
           5.6.4 BARGAINING POWER OF BUYERS
           5.6.5 DEGREE OF COMPETITION
    5.7 TECHNOLOGICAL ANALYSIS 
           5.7.1 ARTIFICIAL INTELLIGENCE AND MACHINE LEARNING
           5.7.2 ANALYTICS
    5.8 TRENDS/DISRUPTIONS IMPACTING BUYERS 
           FIGURE 25 ESG REPORTING SOFTWARE MARKET: TRENDS/DISRUPTIONS IMPACTING BUYERS
    5.9 REGULATORY LANDSCAPE 
           5.9.1 REGULATORY BODIES, GOVERNMENT AGENCIES, AND OTHER ORGANIZATIONS
                    TABLE 5 NORTH AMERICA: LIST OF REGULATORY BODIES, GOVERNMENT AGENCIES, AND OTHER ORGANIZATIONS
                    TABLE 6 EUROPE: LIST OF REGULATORY BODIES, GOVERNMENT AGENCIES, AND OTHER ORGANIZATIONS
                    TABLE 7 ASIA PACIFIC: LIST OF REGULATORY BODIES, GOVERNMENT AGENCIES, AND OTHER ORGANIZATIONS
                    TABLE 8 ROW: LIST OF REGULATORY BODIES, GOVERNMENT AGENCIES, AND OTHER ORGANIZATIONS
           5.9.2 REGULATORY IMPLICATIONS AND INDUSTRY STANDARDS
                    5.9.2.1 General Data Protection Regulation
                    5.9.2.2 SEC Rule 17a-4
                    5.9.2.3 ISO/IEC 27001
                    5.9.2.4 System and Organization Controls 2 Type II Compliance
                    5.9.2.5 Financial Industry Regulatory Authority
                    5.9.2.6 Freedom of Information Act
                    5.9.2.7 Health Insurance Portability and Accountability act
                    5.9.2.8 Global Reporting Initiative (GRI)
                    5.9.2.9 Sustainability Accounting Standards Board (SASB)
                    5.9.2.10 Sustainable Finance Disclosure Regulation (SFDR)
                    5.9.2.11 Non-Financial Reporting Directive (NFRD)
                    5.9.2.12 International Integrated Reporting Council (IIRC)
                    5.9.2.13 Task Force on Climate-Related Financial Disclosures (TCFD)
    5.10 KEY CONFERENCES AND EVENTS IN 2022–2023 
           TABLE 9 MARKET: DETAILED LIST OF CONFERENCES AND EVENTS
 
6 ESG REPORTING SOFTWARE MARKET, BY COMPONENT (Page No. - 67)
    6.1 INTRODUCTION 
           FIGURE 26 SERVICES SEGMENT TO GROW AT HIGHER CAGR DURING FORECAST PERIOD
           TABLE 10 MARKET, BY COMPONENT, 2017–2021 (USD MILLION)
           TABLE 11 MARKET, BY COMPONENT, 2022–2027 (USD MILLION)
           6.1.1 COMPONENT: MARKET DRIVERS
    6.2 SOLUTIONS 
           6.2.1 NEED FOR GOOD GOVERNANCE TO INCREASE DEMAND FOR SOLUTIONS
                    TABLE 12 SOLUTIONS: MARKET, BY REGION, 2017–2021 (USD MILLION)
                    TABLE 13 SOLUTIONS: MARKET, BY REGION, 2022–2027 (USD MILLION)
    6.3 SERVICES 
           6.3.1 NEED FOR STRATEGIC FORMULATION, IMPLEMENTATION, PLANNING, AND EVALUATION
                    TABLE 14 SERVICES: MARKET, BY REGION, 2017–2021 (USD MILLION)
                    TABLE 15 SERVICES: MARKET, BY REGION, 2022–2027 (USD MILLION)
 
7 ESG REPORTING SOFTWARE MARKET, BY DEPLOYMENT TYPE (Page No. - 72)
    7.1 INTRODUCTION 
           FIGURE 27 CLOUD TO GROW AT HIGHER CAGR DURING FORECAST PERIOD
           TABLE 16 MARKET, BY DEPLOYMENT TYPE, 2017–2021 (USD MILLION)
           TABLE 17 MARKET, BY DEPLOYMENT TYPE, 2022–2027 (USD MILLION)
           7.1.1 DEPLOYMENT TYPE: MARKET DRIVERS
    7.2 ON-PREMISES 
           7.2.1 TO IMPROVE ESG PERFORMANCE, STOCK PERFORMANCE, AND CUSTOMER LOYALTY
                    TABLE 18 ON-PREMISES: MARKET, BY REGION, 2017–2021 (USD MILLION)
                    TABLE 19 ON-PREMISES: MARKET, BY REGION, 2022–2027 (USD MILLION)
    7.3 CLOUD 
           7.3.1 ONETRUST ESG AND SUSTAINABILITY CLOUD LAUNCHED TO ASSIST ORGANIZATIONS
                    TABLE 20 CLOUD: MARKET, BY REGION, 2017–2021 (USD MILLION)
                    TABLE 21 CLOUD: MARKET, BY REGION, 2022–2027 (USD MILLION)
 
8 ESG REPORTING SOFTWARE MARKET, BY ORGANIZATION SIZE (Page No. - 77)
    8.1 INTRODUCTION 
           FIGURE 28 SMES TO GROW AT HIGHER CAGR
           TABLE 22 MARKET, BY ORGANIZATION SIZE, 2017–2021 (USD MILLION)
           TABLE 23 MARKET, BY ORGANIZATION SIZE, 2022–2027 (USD MILLION)
           8.1.1 ORGANIZATION SIZE: MARKET DRIVERS
    8.2 SMALL AND MEDIUM-SIZED ENTERPRISES 
           8.2.1 GRI TO IDENTIFY ESG ISSUES FOR SMES
                    TABLE 24 SMES: MARKET, BY REGION, 2017–2021 (USD MILLION)
                    TABLE 25 SMES: MARKET, BY REGION, 2022–2027 (USD MILLION)
    8.3 LARGE ENTERPRISES 
           8.3.1 NEED FOR MANAGING RISKS TO SOLVE PROBLEMS ASSOCIATED WITH CLIMATE AND WASTE MATERIAL
                    TABLE 26 LARGE ENTERPRISES: MARKET, BY REGION, 2017–2021 (USD MILLION)
                    TABLE 27 LARGE ENTERPRISES: MARKET, BY REGION, 2022–2027 (USD MILLION)
 
9 ESG REPORTING SOFTWARE MARKET, BY VERTICAL (Page No. - 82)
    9.1 INTRODUCTION 
           FIGURE 29 BFSI TO ACCOUNT FOR LARGEST MARKET SIZE
           TABLE 28 MARKET, BY VERTICAL, 2017–2021 (USD MILLION)
           TABLE 29 MARKET, BY VERTICAL, 2022–2027 (USD MILLION)
           9.1.1 VERTICAL: MARKET DRIVERS
    9.2 BFSI 
           9.2.1 NEED FOR CAPITAL INVESTMENT AND FINANCIAL SUPPORT TO DRIVE MARKET
                    TABLE 30 BFSI: MARKET, BY REGION, 2017–2021 (USD MILLION)
                    TABLE 31 BFSI: MARKET, BY REGION, 2022–2027 (USD MILLION)
    9.3 GOVERNMENT, PUBLIC SECTOR, AND NON-PROFIT 
           9.3.1 NEED TO IMPLEMENT REGULATORY ACTS LIKE SASB, TCFD, AND GRI TO DRIVE MARKET
                    TABLE 32 GOVERNMENT, PUBLIC SECTOR, AND NON-PROFIT: MARKET, BY REGION, 2017–2021 (USD MILLION)
                    TABLE 33 GOVERNMENT, PUBLIC SECTOR, AND NON-PROFIT: MARKET, BY REGION, 2022–2027 (USD MILLION)
    9.4 MANUFACTURING 
           9.4.1 NEED TO CONTROL HIGH CARBON EMISSIONS AND WATER SCARCITY TO DRIVE MARKET
                    TABLE 34 MANUFACTURING: ESG REPORTING SOFTWARE MARKET, BY REGION, 2017–2021 (USD MILLION)
                    TABLE 35 MANUFACTURING: MARKET, BY REGION, 2022–2027 (USD MILLION)
    9.5 FOOD & BEVERAGES 
           9.5.1 CHANGING CONSUMER DEMAND FOR NEW PRODUCTS TO PRESSURIZE F&B COMPANIES
                    TABLE 36 FOOD & BEVERAGES: MARKET, BY REGION, 2017–2021 (USD MILLION)
                    TABLE 37 FOOD & BEVERAGES: MARKET, BY REGION, 2022–2027 (USD MILLION)
    9.6 RETAIL & CONSUMER GOODS 
           9.6.1 NEED FOR GREENWASHING TO BOOST VERTICAL
                    TABLE 38 RETAIL & CONSUMER GOODS: MARKET, BY REGION, 2017–2021 (USD MILLION)
                    TABLE 39 RETAIL & CONSUMER GOODS: MARKET, BY REGION, 2022–2027 (USD MILLION)
    9.7 ENERGY & UTILITIES 
           9.7.1 NEED FOR INVESTMENT IN DECARBONIZATION TO DRIVE MARKET
                    TABLE 40 ENERGY & UTILITIES: MARKET, BY REGION, 2017–2021 (USD MILLION)
                    TABLE 41 ENERGY & UTILITIES: MARKET, BY REGION, 2022–2027 (USD MILLION)
    9.8 OTHER VERTICALS 
           TABLE 42 OTHER VERTICALS: MARKET, BY REGION, 2017–2021 (USD MILLION)
           TABLE 43 OTHER VERTICALS: MARKET, BY REGION, 2022–2027 (USD MILLION)
 
10 ESG REPORTING SOFTWARE MARKET, BY REGION (Page No. - 92)
     10.1 INTRODUCTION 
               FIGURE 30 ASIA PACIFIC TO GROW AT HIGHEST CAGR AMONG REGIONS
               TABLE 44 MARKET, BY REGION, 2017–2021 (USD MILLION)
               TABLE 45 MARKET, BY REGION, 2022–2027 (USD MILLION)
     10.2 NORTH AMERICA 
               FIGURE 31 NORTH AMERICA: MARKET SNAPSHOT
             10.2.1 NORTH AMERICA: MARKET DRIVERS
                       TABLE 46 NORTH AMERICA: ESG REPORTING SOFTWARE MARKET, BY COMPONENT, 2017–2021 (USD MILLION)
                       TABLE 47 NORTH AMERICA: MARKET, BY COMPONENT, 2022–2027 (USD MILLION)
                       TABLE 48 NORTH AMERICA: MARKET, BY DEPLOYMENT TYPE, 2017–2021 (USD MILLION)
                       TABLE 49 NORTH AMERICA: MARKET, BY DEPLOYMENT TYPE, 2022–2027 (USD MILLION)
                       TABLE 50 NORTH AMERICA: MARKET, BY ORGANIZATION SIZE, 2017–2021 (USD MILLION)
                       TABLE 51 NORTH AMERICA: MARKET, BY ORGANIZATION SIZE, 2022–2027 (USD MILLION)
                       TABLE 52 NORTH AMERICA: MARKET, BY VERTICAL, 2017–2021 (USD MILLION)
                       TABLE 53 NORTH AMERICA: MARKET, BY VERTICAL, 2022–2027 (USD MILLION)
                       TABLE 54 NORTH AMERICA: MARKET, BY COUNTRY, 2017–2021 (USD MILLION)
                       TABLE 55 NORTH AMERICA: MARKET, BY COUNTRY, 2022–2027 (USD MILLION)
             10.2.2 US
                       TABLE 56 US: ESG REPORTING SOFTWARE MARKET, BY DEPLOYMENT TYPE, 2017–2021 (USD MILLION)
                       TABLE 57 US: MARKET, BY DEPLOYMENT TYPE, 2022–2027 (USD MILLION)
                       TABLE 58 US: MARKET, BY ORGANIZATION SIZE, 2017–2021 (USD MILLION)
                       TABLE 59 US: MARKET, BY ORGANIZATION SIZE, 2022–2027 (USD MILLION)
             10.2.3 CANADA
                       TABLE 60 CANADA: MARKET, BY DEPLOYMENT TYPE, 2017–2021 (USD MILLION)
                       TABLE 61 CANADA: MARKET, BY DEPLOYMENT TYPE, 2022–2027 (USD MILLION)
                       TABLE 62 CANADA: MARKET, BY ORGANIZATION SIZE, 2017–2021 (USD MILLION)
                       TABLE 63 CANADA: MARKET, BY ORGANIZATION SIZE, 2022–2027 (USD MILLION)
     10.3 EUROPE 
             10.3.1 EUROPE: MARKET DRIVERS
                       TABLE 64 EUROPE: ESG REPORTING SOFTWARE MARKET, BY COMPONENT, 2017–2021 (USD MILLION)
                       TABLE 65 EUROPE: MARKET, BY COMPONENT, 2022–2027 (USD MILLION)
                       TABLE 66 EUROPE: MARKET, BY DEPLOYMENT TYPE, 2017–2021 (USD MILLION)
                       TABLE 67 EUROPE: MARKET, BY DEPLOYMENT TYPE, 2022–2027 (USD MILLION)
                       TABLE 68 EUROPE: MARKET, BY ORGANIZATION SIZE, 2017–2021 (USD MILLION)
                       TABLE 69 EUROPE: MARKET, BY ORGANIZATION SIZE, 2022–2027 (USD MILLION)
                       TABLE 70 EUROPE: MARKET, BY VERTICAL, 2017–2021 (USD MILLION)
                       TABLE 71 EUROPE: MARKET, BY VERTICAL, 2022–2027 (USD MILLION)
                       TABLE 72 EUROPE: MARKET, BY COUNTRY, 2017–2021 (USD MILLION)
                       TABLE 73 EUROPE: MARKET, BY COUNTRY, 2022–2027 (USD MILLION)
             10.3.2 UK
                       TABLE 74 UK: ESG REPORTING SOFTWARE MARKET, BY DEPLOYMENT TYPE, 2017–2021 (USD MILLION)
                       TABLE 75 UK: MARKET, BY DEPLOYMENT TYPE, 2022–2027 (USD MILLION)
                       TABLE 76 UK: MARKET, BY ORGANIZATION SIZE, 2017–2021 (USD MILLION)
                       TABLE 77 UK: MARKET, BY ORGANIZATION SIZE, 2022–2027 (USD MILLION)
             10.3.3 GERMANY
                       TABLE 78 GERMANY: MARKET, BY DEPLOYMENT TYPE, 2017–2021 (USD MILLION)
                       TABLE 79 GERMANY: MARKET, BY DEPLOYMENT TYPE, 2022–2027 (USD MILLION)
                       TABLE 80 GERMANY: MARKET, BY ORGANIZATION SIZE, 2017–2021 (USD MILLION)
                       TABLE 81 GERMANY: MARKET, BY ORGANIZATION SIZE, 2022–2027 (USD MILLION)
             10.3.4 REST OF EUROPE
                       TABLE 82 REST OF EUROPE: MARKET, BY DEPLOYMENT TYPE, 2017–2021 (USD MILLION)
                       TABLE 83 REST OF EUROPE: MARKET, BY DEPLOYMENT TYPE, 2022–2027 (USD MILLION)
                       TABLE 84 REST OF EUROPE: MARKET, BY ORGANIZATION SIZE, 2017–2021 (USD MILLION)
                       TABLE 85 REST OF EUROPE: MARKET, BY ORGANIZATION SIZE, 2022–2027 (USD MILLION)
     10.4 ASIA PACIFIC 
             10.4.1 ASIA PACIFIC: ESG REPORTING SOFTWARE MARKET DRIVERS
                       FIGURE 32 ASIA PACIFIC: MARKET SNAPSHOT
                       TABLE 86 ASIA PACIFIC: MARKET, BY COMPONENT, 2017–2021 (USD MILLION)
                       TABLE 87 ASIA PACIFIC: MARKET, BY COMPONENT, 2022–2027 (USD MILLION)
                       TABLE 88 ASIA PACIFIC: MARKET, BY DEPLOYMENT TYPE, 2017–2021 (USD MILLION)
                       TABLE 89 ASIA PACIFIC: MARKET, BY DEPLOYMENT TYPE, 2022–2027 (USD MILLION)
                       TABLE 90 ASIA PACIFIC: MARKET, BY ORGANIZATION SIZE, 2017–2021 (USD MILLION)
                       TABLE 91 ASIA PACIFIC: MARKET, BY ORGANIZATION SIZE, 2022–2027 (USD MILLION)
                       TABLE 92 ASIA PACIFIC: MARKET, BY VERTICAL, 2017–2021 (USD MILLION)
                       TABLE 93 ASIA PACIFIC: MARKET, BY VERTICAL, 2022–2027 (USD MILLION)
                       TABLE 94 ASIA PACIFIC: MARKET, BY COUNTRY, 2017–2021 (USD MILLION)
                       TABLE 95 ASIA PACIFIC: MARKET, BY COUNTRY, 2022–2027 (USD MILLION)
             10.4.2 CHINA
                       TABLE 96 CHINA: ESG REPORTING SOFTWARE MARKET, BY DEPLOYMENT TYPE, 2017–2021 (USD MILLION)
                       TABLE 97 CHINA: MARKET, BY DEPLOYMENT TYPE, 2022–2027 (USD MILLION)
                       TABLE 98 CHINA: MARKET, BY ORGANIZATION SIZE, 2017–2021 (USD MILLION)
                       TABLE 99 CHINA: MARKET, BY ORGANIZATION SIZE, 2022–2027 (USD MILLION)
             10.4.3 JAPAN
                       TABLE 100 JAPAN: MARKET, BY DEPLOYMENT TYPE, 2017–2021 (USD MILLION)
                       TABLE 101 JAPAN: MARKET, BY DEPLOYMENT TYPE, 2022–2027 (USD MILLION)
                       TABLE 102 JAPAN: MARKET, BY ORGANIZATION SIZE, 2017–2021 (USD MILLION)
                       TABLE 103 JAPAN: MARKET, BY ORGANIZATION SIZE, 2022–2027 (USD MILLION)
             10.4.4 REST OF ASIA PACIFIC
                       TABLE 104 REST OF ASIA PACIFIC: MARKET, BY DEPLOYMENT TYPE, 2017–2021 (USD MILLION)
                       TABLE 105 REST OF ASIA PACIFIC: MARKET, BY DEPLOYMENT TYPE, 2022–2027 (USD MILLION)
                       TABLE 106 REST OF ASIA PACIFIC: MARKET, BY ORGANIZATION SIZE, 2017–2021 (USD MILLION)
                       TABLE 107 REST OF ASIA PACIFIC: MARKET, BY ORGANIZATION SIZE, 2022–2027 (USD MILLION)
     10.5 MIDDLE EAST & AFRICA 
             10.5.1 MIDDLE EAST & AFRICA: CLOUD PERFORMANCE MARKET DRIVERS
                       TABLE 108 MIDDLE EAST & AFRICA: ESG REPORTING SOFTWARE MARKET, BY COMPONENT, 2017–2021 (USD MILLION)
                       TABLE 109 MIDDLE EAST & AFRICA: MARKET, BY COMPONENT, 2022–2027 (USD MILLION)
                       TABLE 110 MIDDLE EAST & AFRICA: MARKET, BY DEPLOYMENT TYPE, 2017–2021 (USD MILLION)
                       TABLE 111 MIDDLE EAST & AFRICA: EMARKET, BY DEPLOYMENT TYPE, 2022–2027 (USD MILLION)
                       TABLE 112 MIDDLE EAST & AFRICA: MARKET, BY ORGANIZATION SIZE, 2017–2021 (USD MILLION)
                       TABLE 113 MIDDLE EAST & AFRICA: MARKET, BY ORGANIZATION SIZE, 2022–2027 (USD MILLION)
                       TABLE 114 MIDDLE EAST & AFRICA: MARKET, BY VERTICAL, 2017–2021 (USD MILLION)
                       TABLE 115 MIDDLE EAST & AFRICA: MARKET, BY VERTICAL, 2022–2027 (USD MILLION)
                       TABLE 116 MIDDLE EAST & AFRICA: MARKET, BY COUNTRY, 2017–2021 (USD MILLION)
                       TABLE 117 MIDDLE EAST & AFRICA: MARKET, BY COUNTRY, 2022–2027 (USD MILLION)
             10.5.2 UNITED ARAB EMIRATES
                       TABLE 118 UNITED ARAB EMIRATES: ESG REPORTING SOFTWARE MARKET, BY DEPLOYMENT TYPE, 2017–2021 (USD MILLION)
                       TABLE 119 UNITED ARAB EMIRATES: MARKET, BY DEPLOYMENT TYPE, 2022–2027 (USD MILLION)
                       TABLE 120 UNITED ARAB EMIRATES: MARKET, BY ORGANIZATION SIZE, 2017–2021 (USD MILLION)
                       TABLE 121 UNITED ARAB EMIRATES: MARKET, BY ORGANIZATION SIZE, 2022–2027 (USD MILLION)
             10.5.3 KINGDOM OF SAUDI ARABIA
                       TABLE 122 KINGDOM OF SAUDI ARABIA: MARKET, BY DEPLOYMENT TYPE, 2017–2021 (USD MILLION)
                       TABLE 123 KINGDOM OF SAUDI ARABIA: MARKET, BY DEPLOYMENT TYPE, 2022–2027 (USD MILLION)
                       TABLE 124 KINGDOM OF SAUDI ARABIA: MARKET, BY ORGANIZATION SIZE, 2017–2021 (USD MILLION)
                       TABLE 125 KINGDOM OF SAUDI ARABIA: MARKET, BY ORGANIZATION SIZE, 2022–2027 (USD MILLION)
             10.5.4 REST OF THE MIDDLE EAST & AFRICA
                       TABLE 126 REST OF THE MIDDLE EAST & AFRICA: MARKET, BY DEPLOYMENT TYPE, 2017–2021 (USD MILLION)
                       TABLE 127 REST OF THE MIDDLE EAST & AFRICA: MARKET, BY DEPLOYMENT TYPE, 2022–2027 (USD MILLION)
                       TABLE 128 REST OF THE MIDDLE EAST & AFRICA: MARKET, BY ORGANIZATION SIZE, 2017–2021 (USD MILLION)
                       TABLE 129 REST OF THE MIDDLE EAST & AFRICA: MARKET, BY ORGANIZATION SIZE, 2022–2027 (USD MILLION)
     10.6 LATIN AMERICA 
             10.6.1 LATIN AMERICA: ESG REPORTING SOFTWARE MARKET DRIVERS
                       TABLE 130 LATIN AMERICA: MARKET, BY COMPONENT, 2017–2021 (USD MILLION)
                       TABLE 131 LATIN AMERICA: MARKET, BY COMPONENT, 2022–2027 (USD MILLION)
                       TABLE 132 LATIN AMERICA: MARKET, BY DEPLOYMENT TYPE, 2017–2021 (USD MILLION)
                       TABLE 133 LATIN AMERICA: MARKET, BY DEPLOYMENT TYPE, 2022–2027 (USD MILLION)
                       TABLE 134 LATIN AMERICA: MARKET, BY ORGANIZATION SIZE, 2017–2021 (USD MILLION)
                       TABLE 135 LATIN AMERICA: MARKET, BY ORGANIZATION SIZE, 2022–2027 (USD MILLION)
                       TABLE 136 LATIN AMERICA: MARKET, BY VERTICAL, 2017–2021 (USD MILLION)
                       TABLE 137 LATIN AMERICA: MARKET, BY VERTICAL, 2022–2027 (USD MILLION)
                       TABLE 138 LATIN AMERICA: MARKET, BY COUNTRY, 2017–2021 (USD MILLION)
                       TABLE 139 LATIN AMERICA: MARKET, BY COUNTRY, 2022–2027 (USD MILLION)
             10.6.2 BRAZIL
                       TABLE 140 BRAZIL: ESG REPORTING SOFTWARE MARKET, BY DEPLOYMENT TYPE, 2017–2021 (USD MILLION)
                       TABLE 141 BRAZIL: MARKET, BY DEPLOYMENT TYPE, 2022–2027 (USD MILLION)
                       TABLE 142 BRAZIL: MARKET, BY ORGANIZATION SIZE, 2017–2021 (USD MILLION)
                       TABLE 143 BRAZIL: MARKET, BY ORGANIZATION SIZE, 2022–2027 (USD MILLION)
             10.6.3 REST OF LATIN AMERICA
                       TABLE 144 REST OF LATIN AMERICA: MARKET, BY DEPLOYMENT TYPE, 2017–2021 (USD MILLION)
                       TABLE 145 REST OF LATIN AMERICA: MARKET, BY DEPLOYMENT TYPE, 2022–2027 (USD MILLION)
                       TABLE 146 REST OF LATIN AMERICA: MARKET, BY ORGANIZATION SIZE, 2017–2021 (USD MILLION)
                       TABLE 147 REST OF LATIN AMERICA: MARKET, BY ORGANIZATION SIZE, 2022–2027 (USD MILLION)
 
11 COMPETITIVE LANDSCAPE (Page No. - 130)
     11.1 INTRODUCTION 
               FIGURE 33 MARKET EVALUATION FRAMEWORK, 2020-2022
     11.2 MARKET SHARE OF TOP VENDORS 
               FIGURE 34 ESG REPORTING SOFTWARE MARKET: VENDOR SHARE ANALYSIS
     11.3 HISTORICAL REVENUE ANALYSIS OF TOP FIVE VENDORS 
               FIGURE 35 HISTORICAL REVENUE ANALYSIS OF TOP FIVE VENDORS, 2017–2021
     11.4 KEY MARKET DEVELOPMENTS 
             11.4.1 PRODUCT LAUNCHES AND ENHANCEMENTS
                       TABLE 148 PRODUCT LAUNCHES AND ENHANCEMENTS, 2020–2022
             11.4.2 DEALS
                       TABLE 149 DEALS, 2020-2022
     11.5 COMPANY EVALUATION QUADRANT 
             11.5.1 STARS
             11.5.2 EMERGING LEADERS
             11.5.3 PERVASIVE PLAYERS
             11.5.4 PARTICIPANTS
                       FIGURE 36 MARKET (GLOBAL): COMPANY EVALUATION QUADRANT, 2022
                       TABLE 150 GLOBAL COMPANY FOOTPRINT
                       TABLE 151 COMPANY FOOTPRINT, BY COMPONENT
                       TABLE 152 COMPANY FOOTPRINT, BY VERTICAL (1/2)
                       TABLE 153 COMPANY FOOTPRINT, BY VERTICAL (2/2)
                       TABLE 154 COMPANY FOOTPRINT, BY REGION
     11.6 COMPETITIVE BENCHMARKING 
               TABLE 155 ESG REPORTING SOFTWARE MARKET: DETAILED LIST OF KEY STARTUPS/SMES
               TABLE 156 MARKET: COMPETITIVE BENCHMARKING OF STARTUPS/SMES
 
12 COMPANY PROFILES (Page No. - 142)
     12.1 INTRODUCTION 
(Business overview, Products offered, Recent developments & MnM View)*
     12.2 KEY PLAYERS 
             12.2.1 WOLTERS KLUWER
                       TABLE 157 WOLTERS KLUWER: BUSINESS OVERVIEW
                       FIGURE 37 WOLTERS KLUWER: COMPANY SNAPSHOT
                       TABLE 158 WOLTERS KLUWER: SOLUTIONS/SERVICES/PLATFORMS OFFERED
                       TABLE 159 WOLTERS KLUWER: PRODUCT LAUNCHES
             12.2.2 NASDAQ
                       TABLE 160 NASDAQ: BUSINESS OVERVIEW
                       FIGURE 38 NASDAQ: COMPANY SNAPSHOT
                       TABLE 161 NASDAQ: SOLUTIONS/SERVICES/PLATFORMS OFFERED
                       TABLE 162 NASDAQ: PRODUCT LAUNCHES
                       TABLE 163 NASDAQ: DEALS
             12.2.3 PWC
                       TABLE 164 PWC: BUSINESS OVERVIEW
                       FIGURE 39 PWC: COMPANY SNAPSHOT
                       TABLE 165 PWC: SOLUTIONS/SERVICES/PLATFORMS OFFERED
                       TABLE 166 PWC: DEALS
             12.2.4 WORKIVA
                       TABLE 167 WORKIVA: BUSINESS OVERVIEW
                       FIGURE 40 WORKIVA: COMPANY SNAPSHOT
                       TABLE 168 WORKIVA: SOLUTIONS/SERVICES/PLATFORMS OFFERED
                       TABLE 169 WORKIVA: PRODUCT LAUNCHES
                       TABLE 170 WORKIVA: DEALS
             12.2.5 REFINITIV
                       TABLE 171 REFINITIV: BUSINESS OVERVIEW
                       TABLE 172 REFINITIV: SOLUTIONS/SERVICES/PLATFORMS OFFERED
                       TABLE 173 REFINITIV: PRODUCT LAUNCHES
             12.2.6 GREENSTONE
                       TABLE 174 GREENSTONE: BUSINESS OVERVIEW
                       TABLE 175 GREENSTONE: SOLUTIONS/SERVICES/PLATFORMS OFFERED
                       TABLE 176 GREENSTONE: DEALS
             12.2.7 DILIGENT
                       TABLE 177 DILIGENT: BUSINESS OVERVIEW
                       TABLE 178 DILIGENT: SOLUTIONS/SERVICES/PLATFORMS OFFERED
                       TABLE 179 DILIGENT: PRODUCT LAUNCHES
                       TABLE 180 DILIGENT: DEALS
             12.2.8 SPHERA
                       TABLE 181 SPHERA: BUSINESS OVERVIEW
                       TABLE 182 SPHERA: SOLUTIONS/SERVICES/PLATFORMS OFFERED
                       TABLE 183 SPHERA: PRODUCT LAUNCHES
                       TABLE 184 SPHERA: DEALS
             12.2.9 CORITY
                       TABLE 185 CORITY: BUSINESS OVERVIEW
                       TABLE 186 CORITY: SOLUTIONS/SERVICES/PLATFORMS OFFERED
                       TABLE 187 CORITY: PRODUCT LAUNCHES
                       TABLE 188 CORITY: DEALS
             12.2.10 INTELEX
                       TABLE 189 INTELEX: BUSINESS OVERVIEW
                       TABLE 190 INTELEX: SOLUTIONS/SERVICES/PLATFORMS OFFERED
                       TABLE 191 INTELEX: PRODUCT LAUNCHES
                       TABLE 192 INTELEX: DEALS
*Details on Business overview, Products offered, Recent developments & MnM View might not be captured in case of unlisted companies.
     12.3 OTHER COMPANIES 
             12.3.1 NOVISTO
             12.3.2 EMEX
             12.3.3 ENHELIX
             12.3.4 ANTHESIS
             12.3.5 DIGINEX
             12.3.6 BAIN & COMPANY
             12.3.7 KERAMIDA
             12.3.8 ISOMETRIX
             12.3.9 VERVANTIS
             12.3.10 ACCUVIO (ACQUIRED BY DILIGENT [UK])
 
13 ADJACENT AND RELATED MARKETS (Page No. - 177)
     13.1 INTRODUCTION 
             13.1.1 RELATED MARKETS
             13.1.2 LIMITATIONS
     13.2 DISCLOSURE MANAGEMENT MARKET 
             13.2.1 MARKET DEFINITION
             13.2.2 MARKET OVERVIEW
             13.2.3 DISCLOSURE MANAGEMENT MARKET, BY COMPONENT
                       TABLE 193 DISCLOSURE MANAGEMENT MARKET, BY COMPONENT, 2015–2022 (USD MILLION)
                       TABLE 194 SERVICES: DISCLOSURE MANAGEMENT MARKET, BY TYPE, 2015–2022 (USD MILLION)
                       TABLE 195 SOFTWARE: DISCLOSURE MANAGEMENT MARKET, BY REGION, 2015–2022 (USD MILLION)
                       TABLE 196 SERVICES: DISCLOSURE MANAGEMENT MARKET, BY REGION, 2015–2022 (USD MILLION)
             13.2.4 DISCLOSURE MANAGEMENT MARKET, BY VERTICAL
                       TABLE 197 DISCLOSURE MANAGEMENT MARKET, BY VERTICAL, 2015–2022 (USD MILLION)
                       TABLE 198 BANKING, FINANCIAL SERVICES, AND INSURANCE: DISCLOSURE MANAGEMENT MARKET, BY REGION, 2015–2022 (USD MILLION)
                       TABLE 199 RETAIL AND ECOMMERCE: DISCLOSURE MANAGEMENT MARKET, BY REGION, 2015–2022 (USD MILLION)
                       TABLE 200 GOVERNMENT AND DEFENSE: DISCLOSURE MANAGEMENT MARKET, BY REGION, 2015–2022 (USD MILLION)
                       TABLE 201 HEALTHCARE: DISCLOSURE MANAGEMENT MARKET, BY REGION, 2015–2022 (USD MILLION)
                       TABLE 202 MANUFACTURING: DISCLOSURE MANAGEMENT MARKET, BY REGION, 2015–2022 (USD MILLION)
                       TABLE 203 IT AND TELECOM: DISCLOSURE MANAGEMENT MARKET, BY REGION, 2015–2022 (USD MILLION)
                       TABLE 204 MEDIA AND ENTERTAINMENT: DISCLOSURE MANAGEMENT MARKET, BY REGION, 2015–2022 (USD MILLION)
                       TABLE 205 OTHER VERTICALS: DISCLOSURE MANAGEMENT MARKET, BY REGION, 2015–2022 (USD MILLION)
             13.2.5 DISCLOSURE MANAGEMENT MARKET, BY REGION
                       TABLE 206 DISCLOSURE MANAGEMENT MARKET, BY REGION, 2015–2022 (USD MILLION)
     13.3 PRODUCT STEWARDSHIP MARKET 
             13.3.1 MARKET DEFINITION
             13.3.2 MARKET OVERVIEW
             13.3.3 PRODUCT STEWARDSHIP MARKET, BY TYPE
                       TABLE 207 PRODUCT STEWARDSHIP MARKET, BY TYPE, 2016–2023 (USD MILLION)
                       TABLE 208 SERVICES: PRODUCT STEWARDSHIP MARKET, BY SERVICE TYPE, 2016–2023 (USD MILLION)
                       TABLE 209 SOLUTIONS: PRODUCT STEWARDSHIP MARKET, BY REGION, 2016–2023 (USD MILLION)
                       TABLE 210 SERVICES: PRODUCT STEWARDSHIP MARKET, BY REGION, 2016–2023 (USD MILLION)
             13.3.4 PRODUCT STEWARDSHIP MARKET, BY ORGANIZATION SIZE
                       TABLE 211 PRODUCT STEWARDSHIP MARKET, BY ORGANIZATION SIZE, 2016–2023 (USD MILLION)
                       TABLE 212 SMES: PRODUCT STEWARDSHIP MARKET, BY REGION, 2016–2023 (USD MILLION)
                       TABLE 213 LARGE ENTERPRISES: PRODUCT STEWARDSHIP MARKET, BY REGION, 2016–2023 (USD MILLION)
             13.3.5 PRODUCT STEWARDSHIP MARKET, BY REGION
                       TABLE 214 PRODUCT STEWARDSHIP MARKET, BY REGION, 2016–2023 (USD MILLION)
 
14 APPENDIX (Page No. - 187)
     14.1 DISCUSSION GUIDE 
     14.2 KNOWLEDGESTORE: MARKETSANDMARKETS’ SUBSCRIPTION PORTAL 
     14.3 CUSTOMIZATION OPTIONS 
     14.4 RELATED REPORTS 
     14.5 AUTHOR DETAILS 

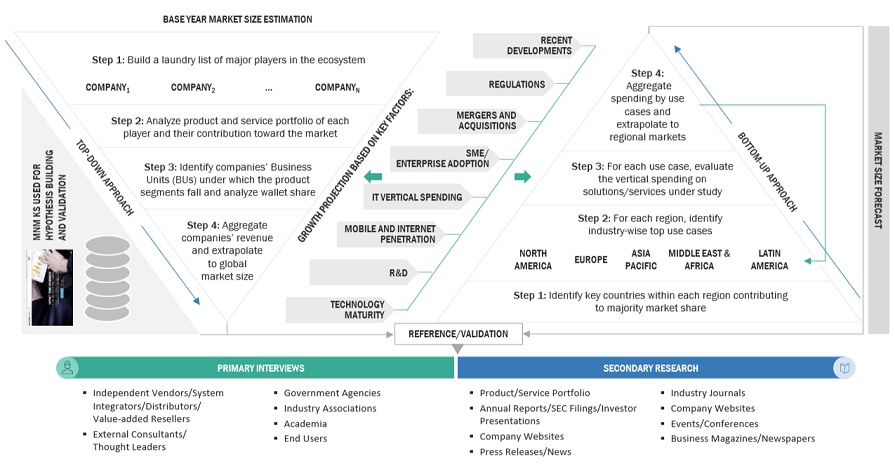
The study involved 4 major activities in estimating the current size of the ESG Reporting software market. Exhaustive secondary research was done to collect information on the market, peer market, and parent market. The next step was to validate these findings, assumptions, and sizing with the industry experts across the value chain through primary research. Both top-down and bottom-up approaches were employed to estimate the complete market size. Thereafter, market breakup and data triangulation were used to estimate the market size of segments and subsegments.

Secondary Research

The market size of companies offering ESG Reporting software was derived based on the secondary data available through paid and unpaid sources by analyzing the product portfolios of major companies in the ecosystem and rating the companies based on their product capabilities and business strategies. In the secondary research process, various sources were referred to for identifying and collecting information for the study. Secondary sources included annual reports, press releases, and investor presentations of companies and product data sheets; white papers; journals; certified publications; and articles from recognized authors, government websites, directories, and databases.

Secondary research was majorly used to obtain the key information related to the industry’s supply chain, the total pool of key players, market classification, and segmentation according to industry trends to the bottom-most level, regional markets, and key developments from the market and technology-oriented perspectives; all of which were further validated by primary sources.

Primary Research

In the primary research process, various primary sources from the supply and demand sides were interviewed to obtain qualitative and quantitative information on the market. The primary sources from the supply side included various industry experts, including Chief Experience Officers (CXOs); Vice Presidents (VPs); directors from business development, marketing, and product development/innovation teams; related key executives from ESG Reporting software vendors, industry associations, and independent consultants; and key opinion leaders.

Primary interviews were conducted to gather insights, such as market statistics, latest trends disrupting the market, new use cases implemented, data of revenue collected from products and services, market breakups, market size estimations, market forecasts, and data triangulation. Primary research also helped in understanding various trends related to technology, component, deployment, and region. Demand-side stakeholders, such as Chief Information Officers (CIOs), Chief Technology Officers (CTOs), Chief Security Officers (CSOs), the installation teams of governments/end users using ESG Reporting software solutions, and digital initiatives project teams, were interviewed to understand the buyer’s perspective on suppliers, products, service providers, and their current use, which would affect the overall ESG Reporting software market.

All possible parameters that affect the market covered in this research study have been accounted for, viewed in extensive detail, verified through primary research, and analyzed to get the final quantitative and qualitative data. Following is the breakup of primary respondents:

ESG Reporting Software Market Size, and Share

To know about the assumptions considered for the study, download the pdf brochure

Market Size Estimation

The top-down and bottom-up approaches were used to estimate and validate the size of the ESG Reporting software market and various other dependent subsegments. The research methodology used to estimate the market size included the following:

  • The key players in the market were identified through secondary research, and their revenue contributions in the respective countries were determined through primary and secondary research.
  • This entire procedure included the study of the annual and financial reports of top market players and extensive interviews for key insights from industry leaders, such as Chief Executive Officers (CEOs), VPs, directors, and marketing executives.
  • All percentage splits and breakups were determined using secondary sources and verified through primary sources.

Data Triangulation

With data triangulation and validation through primary interviews, the exact value of the overall parent market size was determined and confirmed using this study. The overall ESG Reporting software market size was then used in the top-down procedure to estimate the size of other individual markets via percentage splits of the market segmentation.

Report Objectives

  • To describe and forecast the global ESG Reporting software market based on component (solutions and services), business function, organization size, vertical, and region
  • To forecast the market size of regional segments: North America, Europe, Asia Pacific, the Middle East & Africa, and Latin America
  • To strategically analyze the market’s subsegments with respect to individual growth trends, prospects, and contributions to the total market
  • To provide detailed information related to major factors (drivers, restraints, opportunities, and challenges) influencing the growth of the market
  • To analyze the opportunities in the market for stakeholders and provide details of the competitive landscape for major players
  • To comprehensively analyze the core competencies of key players
  • To track and analyze competitive developments, such as mergers and acquisitions, new product developments, and partnerships and collaborations, in the market

Available Customizations

With the given market data, MarketsandMarkets offers customizations as per the company’s specific needs. The following customization options are available for the report:

Company Information

  • Detailed analysis and profiling of additional market players up to 5
Custom Market Research Services

We will customize the research for you, in case the report listed above does not meet with your exact requirements. Our custom research will comprehensively cover the business information you require to help you arrive at strategic and profitable business decisions.

Request Customization

Instant Answers with GPT - Ask Now!

Ask real questions. Get complete answers !
Report Code
TC 8523
Published ON
Dec, 2022
Choose License Type
BUY NOW
  • SHARE
X
Request Customization
Speak to Analyst
Speak to Analyst
OR FACE-TO-FACE MEETING
PERSONALIZE THIS RESEARCH
  • Triangulate with your Own Data
  • Get Data as per your Format and Definition
  • Gain a Deeper Dive on a Specific Application, Geography, Customer or Competitor
  • Any level of Personalization
REQUEST A FREE CUSTOMIZATION
LET US HELP YOU!
  • What are the Known and Unknown Adjacencies Impacting the ESG Reporting Software Market
  • What will your New Revenue Sources be?
  • Who will be your Top Customer; what will make them switch?
  • Defend your Market Share or Win Competitors
  • Get a Scorecard for Target Partners
CUSTOMIZED WORKSHOP REQUEST
+1-888-600-6441
  • Call Us
  • +1-888-600-6441 (Corporate office hours)
  • +1-888-600-6441 (US/Can toll free)
  • +44-800-368-9399 (UK office hours)
CONNECT WITH US
ABOUT TRUST ONLINE
©2024 MarketsandMarkets Research Private Ltd. All rights reserved
DMCA.com Protection Status Website Feedback