EV Charging Connector Market by Type (Type1, CCS, Chademo, GB/T, Tesla), Charging level (Level 1 to Level 4), Charging Speed (Slow, Fast), Voltage (AC, DC), End User (Residential, Commercial), Mounted type, Cable, Component, and Region - Global Forecast to 2025


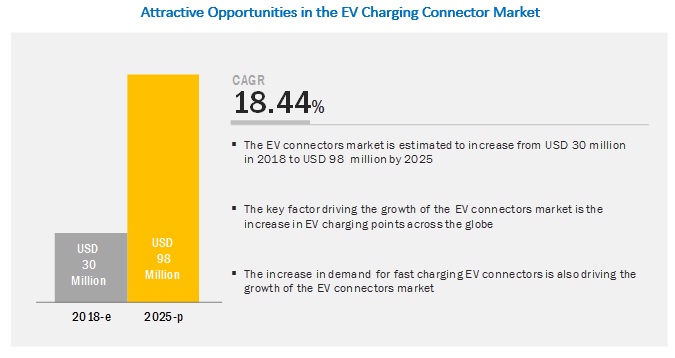
[173 Pages Report] The global EV charging connector market is projected to grow at a CAGR of 18.44% during the forecast period to reach USD 98 million by 2025 from an estimated USD 30 million in 2018. EV connectors act as an EV coupler with charging pole of the station required for power transmission. The connectors help establish the connection of the battery of an EV with the charging point of the station. The EV connectors are designed according to the electrical specifications to synchronize with the features of the battery equipped in an EV.
To know about the assumptions considered for the study, Request for Free Sample Report

By Type Segment: Increased demand for fast EV charging points is expected to drive the EV Charging Connector Market
The GB/T is the largest of all type of charging points followed by type 1 normal charging points of the EV Charging Connector Market and is expected to witness significant growth during the forecast period. The market growth of EV connectors can be attributed to factors such as a shift in demand from AC charging points to DC fast charging points, which would charge EV vehicle rapidly. The ‘by type’ segment is the most promising market for EV connectors as it has huge demand and is expected to drive the future market too.
By Level Type Segment: Level 3 is expected to dominate the EV Charging Connector Market
The charging level depends on the power output of charging stations and the corresponding time required to charge the EV. DC Level 3 requires significant infrastructure and service upgrades and consequently is the most expensive to install as compared to the other two levels. Level 3 EV connectors are predominantly used in the global EV Charging Connector Market. This type of charger has the ability to charge the vehicle from fully drained to 80% in less than 10 minutes. The level 3 EV connectors are appropriate for fast charging and fall in the range from 200 V to 600 V with a typical 45 kW off-board charger. With the shift in demand from AC charging to DC Charging, the market for level 3 EV connectors would rise.
Fast charging EV connector segment is growing at the fastest rate during the forecast period.
The fast charging EV connector is the largest and the fastest growing segment for the EV Charging Connector Market as it offers to charge through a 240 V AC plug and requires the installation of home charging or public charging equipment. Most commercial and public electric car charging stations have now shifted to fast charging. The popular fast charger manufacturers include ClipperCreek, Changepoint, JuiceBox, and Siemens. The increasing sales of EV’s and demand for fast charging in the Asia Pacific region will boost the demand for EV charging connectors in this region.
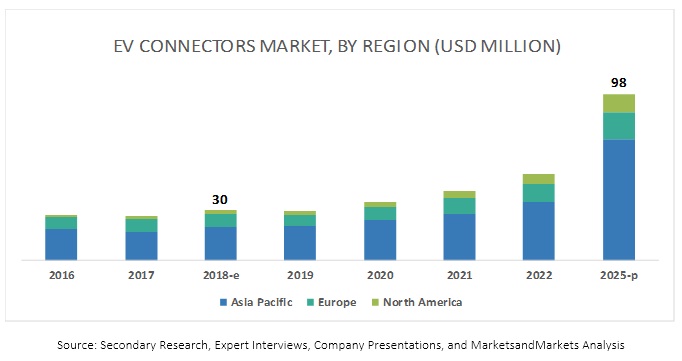
Asia Pacific is expected to account for the largest market size during the forecast period
The Asia Pacific region is estimated to be the largest EV charging connector market in 2018. The region comprises some of the fastest developing economies of the world such as China and India. The Asia Pacific region is the largest market for EVs due to government support in the form of grants, subsidies and tax rebates, and continuously improving charging infrastructure in countries such as Japan and China. Thus, the EV charging infrastructure would grow and drive the market for EV connectors. Continuously improving charging infrastructure and increasing vehicle range are the major factors which have contributed to Asia Pacific being the fastest growing market. Additionally, the alarming pollution levels in economies such as Japan and China have fueled the demand for zero emission vehicles in such countries, thereby creating a huge demand for EVs and EV charging infrastructure.
Key Market Players
The major EV charging connector market players include Yazaki (Japan), TE Connectivity (Switzerland), Sumitomo (Japan), Schneider Electric (France), HUBER+SUHNER (Switzerland), Tesla (US), Bosch (Germany), ITT (US), Amphenol (US), Siemens AG (Germany), ABB (Switzerland), and Fujikura (Japan). These companies have strong distribution networks at the global level. In addition, these companies offer an extensive product range in the OEMs. The key strategies adopted by these companies to sustain their market position are new product developments, collaborations, and contracts & agreements. For Instance, Sumitomo launched the newly developed SEVD-11U high-power charger connector. The company improved power output by 1.9 times from conventional products to cope with the charging of high-capacity BEVs. The rated power is a direct current of 200 A and 600 V. The new power connector follows the design of the existing SEVD Series, ensures operability and safety, and conforms to the CHAdeMO 1.2 standard.
Scope of the Report
|
Report Metric |
Details |
|
Market size available for years |
2016–2025 |
|
Base year considered |
2017 |
|
Forecast period |
2018-2025 |
|
Forecast units |
Value (USD Billion) and Volume (UNITS) |
|
Segments covered |
By Type, Level, Voltage Type, Charging Speed, End User, Station, Cable Type, Component, and Region |
|
Geographies covered |
North America, Asia Pacific, and Europe |
|
Companies covered |
Yazaki (Japan), TE Connectivity (Switzerland), Sumitomo (Japan), Schneider Electric (France), HUBER+SUHNER (Switzerland), Tesla (US), Bosch (Germany), ITT (US), ABB (Switzerland) |
This research report categorizes the EV Charging Connector Market based on type, level, charging type, charging speed, end user, mounted, cable type, component, and region
On the basis of charging type, the EV Charging Connector Market has been segmented as follows:
- Type 1
-
Type 2
- CCS
- CHAdeMO
- GB/T
- Tesla
- Type 3
On the basis of level type, the EV Charging Connector Market has been segmented as follows:
- Level 1
- Level 2
- Level 3
- Level 4
On the basis of voltage type, the EV Charging Connector Market has been segmented as follows:
- AC Charging
- DC Charging
On the basis of charging speed type, the EV Charging Connector Market has been segmented as follows:
- Slow
- Fast
- Rapid
On the basis of region, the EV Charging Connector Market has been segmented as follows:
-
Asia Pacific
- China
- India
- Japan
- South Korea
- Australia
-
North America
- US
- Canada
-
Europe
- France
- Germany
- Spain
- Sweden
- UK
- Austria
- Denmark
- The Netherlands
- Norway
- Switzerland
-
RoW
- Russia
- Brazil
Recent Developments
- In October 2018, ITT showcased an ultra-fast liquid-cooled high-power charging (HPC) solution, its global AC charging portfolio (IEC, SAE and GB/T), and its EV customization expertise. ITT Cannon’s liquid-cooled DC HPC solution enables charging up to 500 A at 1000 V to deliver a 60-mile charge in as little as 3–5 minutes.
- In June 2018, ABB launched its Terra HP which is the world’s fastest EV charger, adding up to 200 km of range to an EV in just 8 minutes. With more than 7,000 DC fast charging stations installed in 60 countries, ABB is a global leader in this segment.
- In October 2017, Tesla updated Model S and Model X designs featuring a new dual connector charge port system to support more than one charging standard on its EVs
- In November 2016, Amphenol introduced plastic power connectors which are designed for the hybrid and electric vehicle markets and featured a lightweight plastic shell and compact design to save both weight and space in the vehicle architecture
Critical Questions:
- Where will the EV sales take the EV Charging Connector Market in the long term?
- Will the market cope with the challenge of high installation costs of EV charging points?
- How do you see the impact of the upcoming fast charging EV connectors on the existing EV charging infrastructure?
- Which type will lead the EV Charging Connector Market (Type1 to Type 3)?
- Which are the industry trends of the EV Charging Connector Market?
To speak to our analyst for a discussion on the above findings, click Speak to Analyst
 Exclusive indicates content/data unique to MarketsandMarkets and not available with any competitors.
Table of Contents
1 Introduction (Page No. - 17)
1.1 Objectives of the Study
1.2 Market Definition
1.3 Market Scope
1.3.1 Years Considered for the Study
1.4 Currency & Pricing
1.5 Package Size
1.6 Limitations
1.7 Stakeholders
2 Research Methodology (Page No. - 21)
2.1 Research Data
2.2 Secondary Data
2.2.1 Key Secondary Sources
2.2.2 Key Data From Secondary Sources
2.3 Primary Data
2.3.1 Sampling Techniques & Data Collection Methods
2.3.2 Primary Participants
2.4 Market Size Estimation
2.4.1 Bottom-Up Approach
2.4.2 Top-Down Approach
2.5 Market Breakdown and Data Triangulation
2.6 Assumptions
3 Executive Summary (Page No. - 31)
4 Premium Insights (Page No. - 34)
4.1 Attractive Opportunities in the EV Connectors Market
4.2 Market Share, By Country
4.3 Market, By Type
4.4 Market, By Level
4.5 Market, By Charging Speed
4.6 Market, By Charging Current Supply
4.7 Market, By End User
4.8 Market, By Region
5 EV Connectors Market Overview (Page No. - 39)
5.1 Introduction
5.2 Market Dynamics
5.2.1 Drivers
5.2.1.1 High Emphasis of Governments on Encouraging the Adoption of EVs
5.2.1.2 Increasing Focus of Automakers on EVs as the Prime Segment
5.2.1.3 Increase in Demand for Fast Charging EV Connectors
5.2.2 Restraints
5.2.2.1 Lack of Standardization for EV Connectors Across the Globe
5.2.3 Opportunities
5.2.3.1 Use of Vehicle-To-Grid (V2G) EV Charging Stations for EVs
5.2.3.2 Collaboration of Governments With Private Companies
5.2.4 Challenges
5.2.4.1 Stringent Regulations and Mandates By Government Authorities for Charging Stations
6 Industry Trends (Page No. - 45)
6.1 Charging Software
6.2 Renewable Charging
7 EV Connectors Market, By Level of Charging (Page No. - 46)
7.1 Introduction
7.2 Level 1 (AC 120 V, 1.4 kW–1.9 kW, 12 A–16 A)
7.2.1 High Adoption Rate of EVs Coupled With the Encouragement By Governments is Fueling the Growth of Level 1 Segment of EV Connectors
7.3 Level 2 (AC 240 V, Upto 19.2 kW, 80 A)
7.3.1 North America is the Fastest Growing Market for Level 2 Segment of EV Connectors
7.4 Level 3 (DC 200 V–600 V, Upto 240 kW, 400 A)
7.4.1 The Rising Demand for Fast-Charging EV Connectors is Fostering the Growth of Level3 Segment Market
7.5 Level 4 (>DC 600 V, Above 240 kW, >400 A)
7.5.1 The Anticipated Growth of EVs in the Coming Years is Likely to Inflate the Growth of Level 4 Segment of Market
8 EV Connectors Market, By Type (Page No. - 56)
8.1 Introduction
8.2 Type 1
8.2.1 Europe is Projected to Be the Largest Market for Type 1 EV Connector
8.3 Type 2
8.3.1 Combine Charging System (CCS)
8.3.2 Chademo
8.3.3 Others
8.4 Type 3
8.4.1 The Rising Demand for Fast Charging EV Connectors is Driving the Demand for Type 3 Segment
9 EV Connectors Market, By End User (Page No. - 67)
9.1 Introduction
9.2 Residential Charging
9.2.1 Europe is Estimated to Be Largest Market for Residential Charging Segment of EV Connectors Market
9.3 Commercial Charging
9.3.1 Collaboration of Government With Private Companies to Encourage Sales of EVs is Fueling the Growth of Commercial Charging Segment of Market
10 EV Connectors Market, By Charging Speed (Page No. - 73)
10.1 Introduction
10.2 Slow Charger
10.2.1 Asia Pacific Region is Expected to Show Fastest Growth for Slow Charing Connectors for EV
10.3 Fast Charger
10.3.1 Asia Pacific Region is Likely to Record Largest Market Share for EV Connectors
10.4 Rapid Charger
10.4.1 Increasing Focus of Automakers Towards EV and Rising Demand for Rapid Charging EV Connectors is Fostering the Growth of Rapid Charger Connectors Market
11 EV Connectors Market, By Current Supply (Page No. - 81)
11.1 Introduction
11.2 AC Charging
11.2.1 Increasing Adoption of EVs is Governing the Growth of AC Charging EV Connectors
11.3 DC Charging
11.3.1 Rapid Development of EV Charging Infrastructure to Power the Rising EV Fleet is Driving the Growth of DC Charging EV Connectors
11.4 Inductive Charging (Wireless)
12 EV Connector Market, By EV Charging Station (Page No. - 88)
12.1 Introduction
12.2 Wall Mounted
12.3 Floor Mounted
13 EV Connectors Market, By Cable Type (Page No. - 90)
13.1 Introduction
13.2 Straight Cable
13.3 Coiled Cables
14 EV Connectors Market, By Component (Page No. - 91)
14.1 Introduction
14.2 Leads
14.3 Adapters
14.4 Wallbox
14.5 Portable Chargers
14.6 Pins
14.7 Delta AC Mini Plus
15 EV Connectors Market, By Region (Page No. - 93)
15.1 Introduction
15.2 Asia Pacific
15.2.1 China
15.2.1.1 Rapid Increase in the Development of EV Charging Infrastructure is Expected to Drive the Chinese Market
15.2.2 India
15.2.2.1 Steady Adoption of EVs and Stable Growth of EV Charging Infrastructure to Drive the Indian Market
15.2.3 Japan
15.2.3.1 Consistent Advancements in EV Connector Technology is Likely to Push the Growth of the Japanese Market
15.2.4 South Korea
15.2.4.1 Increasing Number of EV Charging Stations to Drive the South Korean Market
15.2.5 Australia
15.3 Europe
15.3.1 France
15.3.1.1 Favorable Government Policies to Promote EV Sales is Contributing to the Growth of the French Market
15.3.2 Germany
15.3.2.1 Joining Forces of Government Agencies With Oems to Develop EV Charging Infrastructure is Driving the Growth of the German Market
15.3.3 UK
15.3.3.1 Increasing Focus of Automakers on EVs is Contributing to the Growth of the Market in the Uk
15.3.4 Spain
15.3.4.1 Growing Demand for Fast Charging EV Connectors is Fueling the Growth of the Spanish Market
15.3.5 Sweden
15.3.5.1 Rapidly Increasing EV Charging Stations for the Growing Fleet of EVs is Fostering the Growth of the Swedish EV Connectors
15.3.6 Austria
15.3.6.1 High Adoption Rate of EVs in Austria is Propelling the Demand for EV Connectors
15.3.7 Denmark
15.3.7.1 Favorable Government Policies to Promote EV Sales and EV Charging Infrastructure to Drive the Danish Market
15.3.8 The Netherlands
15.3.8.1 Incredible Growth in the Adoption Rate of EVs in the Netherlands is Fueling the Growth of the Market
15.3.9 Norway
15.3.9.1 Largest Sales Share of EVs is Expected to Continue in the Future and Drive the Norwegian Market
15.3.10 Switzerland
15.3.10.1 Government Focus on Increasing EV Sales to Drive the Swiss Market
15.4 North America
15.4.1 Canada
15.4.1.1 Gradual Growth of the Market is Expected in Canada Because of Steady Adoption Rate of EVs
15.4.2 US
15.4.2.1 Speedy Introduction of Fast-Charging EV Stations is Fueling the Growth of the US Market
15.5 Rest of the World (RoW)
15.5.1 Brazil
15.5.2 Russia
16 Competitive Landscape (Page No. - 123)
16.1 Overview
16.2 Market Ranking Analysis
16.3 Competitive Situations & Trends
16.3.1 New Product Developments
16.3.2 Expansions
16.3.3 Partnerships/Supply Contracts/Collaborations/ Joint Ventures/Agreements/Mergers & Acquisitions
16.4 Competitive Leadership Mapping
16.4.1 Visionary Leaders
16.4.2 Innovators
16.4.3 Dynamic Differentiators
16.4.4 Emerging Companies
17 Company Profiles (Page No. - 131)
(Business Overview, Product Offerings, Recent Developments & SWOT Analysis)*
17.1 YAZAKI Corporation
17.2 TE Connectivity
17.3 Sumitomo Corporation
17.4 Schneider Electric
17.5 Huber+Suhner
17.6 Tesla
17.7 Bosch
17.8 ITT
17.9 Amphenol
17.10 Siemens AG
17.11 ABB
17.12 Fujikura
17.13 Other Key Regional Players
17.13.1 Asia Pacific
17.13.1.1 Besen Group
17.13.1.2 JuicePoint
17.13.1.3 JET Charge
17.13.1.4 Connector-Tech ALS
17.13.1.5 Dostar
17.13.1.6 Dyden Corporation
17.13.2 Europe
17.13.2.1 MENNEKES
17.13.2.2 WallboxOK
17.13.2.3 Raydiall Automotive
17.13.2.4 BP Chargemaster
17.13.2.5 REMA
17.13.2.6 IES
17.13.2.7 PC Electric GmbH
17.13.2.8 Phoenix Contact
17.13.2.9 Fischer Connectors
17.13.2.10 EV Cables
17.13.3 North America
17.13.3.1 Leviton
17.13.3.2 SemaConnect
17.13.3.3 ChargePoint, Inc.
17.13.3.4 Mogile Tech
17.13.3.5 Blink Charging
17.13.3.6 EVgo Services LLC
17.13.3.7 AeroVironment, Inc.
17.13.3.8 Greenlots
17.13.3.9 FLO Services USA Inc.
17.13.3.10 OpConnect, Inc.
17.13.3.11 General Electric Company
17.13.3.12 AddÉnergie inc.
17.13.3.13 myEVroute
17.13.3.14 Sun Country Highway
17.13.3.15 Volta
17.13.3.16 Astria
17.13.3.17 AZRA Canada inc.
17.13.3.18 ClipperCreek
*Details on Business Overview, Product Offerings, Recent Developments & SWOT Analysis Might Not Be Captured in Case of Unlisted Companies.
18 Appendix (Page No. - 166)
18.1 Key Insights of Industry Experts
18.2 Discussion Guide
18.3 Knowledge Store: Marketsandmarkets’ Subscription Portal
18.4 Available Customizations
18.5 Related Reports
18.6 Author Details
List of Tables (87 Tables)
Table 1 Currency Exchange Rates (Per 1 USD)
Table 2 Impact of Market Dynamics
Table 3 EV Connectors Market, By Level of Charging, 2016–2025 (Units)
Table 4 Market, By Level of Charging, 2016–2025 (USD Million)
Table 5 Level 1: Market, By Region, 2016–2025 (‘000 Units)
Table 6 Level 1: Market, By Region, 2016–2025 (USD Thousand)
Table 7 Level 2: Market, By Region, 2016–2025 (‘000 Units)
Table 8 Level 2: Market, By Region, 2016–2025 (USD Thousand)
Table 9 Level 3: Market, By Region, 2016–2025 (‘000 Units)
Table 10 Level 3: Market, By Region, 2016–2025 (USD Thousand)
Table 11 Level 4: Market, By Region, 2016–2025 (‘000 Units)
Table 12 Level 4: Market, By Region, 2016–2025 (USD Thousand)
Table 13 Market, By Type, 2016–2025 (’000 Units)
Table 14 Market, By Type, 2016–2025 (USD Million)
Table 15 Type 1: Market, By Region, 2016–2025 (’000 Units)
Table 16 Type 1: Market, By Region, 2016–2025 (USD Thousand)
Table 17 CCS: Market, By Region, 2016–2025 (’000 Units)
Table 18 CCS: Market, By Region, 2016–2025 (’000 USD)
Table 19 Chademo: Market, By Region, 2016–2025 (’000 Units)
Table 20 Chademo: Market, By Region, 2016–2025 (’000 USD)
Table 21 Others: Market, By Region, 2016–2025 (’000 Units)
Table 22 Others: Market, By Region, 2016–2025 (’000 USD)
Table 23 Type 3: Market, By Region, 2016–2025 (’000 Units)
Table 24 Type 3: Market, By Region, 2016–2025 (’000 USD)
Table 25 EV Connectors Market, By End User, 2016–2025 (‘000 Units)
Table 26 Market, By End User, 2016–2025 (USD Million)
Table 27 Residential Charging: Market, By Region, 2016–2025 (‘000 Units)
Table 28 Residential Charging: Market, By Region, 2016–2025 (USD Million)
Table 29 Commercial Charging: Market, By Region, 2016–2025 (‘000 Units)
Table 30 Commercial Charging: Market, By Region, 2016–2025 (USD Million)
Table 31 Market, By Charging Speed, 2016–2025 (‘000 Units)
Table 32 Market, By Charging Speed, 2016–2025 (USD Million)
Table 33 Slow Charger: Market, By Region, 2016–2025 (‘000 Units)
Table 34 Slow Charger: Market, By Region, 2016–2025 (‘000 USD)
Table 35 Fast Charger: Market, By Region, 2016–2025 (‘000 Units)
Table 36 Fast Charger: Market, By Region, 2016–2025 (‘000 USD)
Table 37 Rapid Charger: Market, By Region, 2016–2025 (‘000 Units)
Table 38 Rapid Charger: Market, By Region, 2016–2025 (‘000 USD)
Table 39 Market, By Current Supply, 2016–2025 (‘000 Units)
Table 40 Market, By Current Supply, 2016–2025 (USD Million)
Table 41 AC Charging: Market, By Region, 2016–2025 (‘000 Units)
Table 42 AC Charging: Market, By Region, 2016–2025 (USD Million)
Table 43 DC Charging: Market, By Region, 2016–2025 (‘000 Units)
Table 44 DC Charging: Market, By Region, 2016–2025 (USD Million)
Table 45 EV Connectors Market, By Region, 2016–2025 (’000 Units)
Table 46 Market, By Region, 2016–2025 (USD Million)
Table 47 Asia Pacific: Market, By Country, 2016–2025 (Units)
Table 48 Asia Pacific: Market, By Country, 2016–2025 (USD Million)
Table 49 China: Market, By Type, 2016–2025 (Units)
Table 50 China: Market, By Type, 2016–2025 (‘000 USD)
Table 51 India: Market, By Type, 2016–2025 (Units)
Table 52 India: Market, By Type, 2016–2025 (‘000 USD)
Table 53 Japan: Market, By Type, 2016–2025 (Units)
Table 54 Japan: Market, By Type, 2016–2025 (‘000 USD)
Table 55 South Korea: Market, By Type, 2016–2025 (Units)
Table 56 South Korea: Market, By Type, 2016–2025 (‘000 USD)
Table 57 Europe: Market, By Country, 2016–2025 (Units)
Table 58 Europe: Market, By Country, 2016–2025 (‘000 USD)
Table 59 France: Market, By Type, 2016–2025 (Units)
Table 60 France: Market, By Type, 2016–2025 (‘000 USD)
Table 61 Germany: Market, By Type, 2016–2025 (Units)
Table 62 Germany: Market, By Type, 2016–2025 (’000 USD)
Table 63 UK: Market, By Type, 2016–2025 (Units)
Table 64 UK: Market, By Type, 2016–2025 (’000 USD)
Table 65 Spain: Market, By Type, 2016–2025 (Units)
Table 66 Spain: Market, By Type, 2016–2025 (’000 USD)
Table 67 Sweden: Market, By Type, 2016–2025 (Units)
Table 68 Sweden: Market, By Type, 2016–2025 (’000 USD)
Table 69 Austria: Market, By Type, 2016–2025 (Units)
Table 70 Austria: Market, By Type, 2016–2025 (’000 USD)
Table 71 Denmark: Market, By Type, 2016–2025 (Units)
Table 72 Denmark: Market, By Type, 2016–2025 (’000 USD)
Table 73 The Netherlands: Market, By Type, 2016–2025 (Units)
Table 74 The Netherlands: Market, By Type, 2016–2025 (’000 USD)
Table 75 Norway: Market, By Type, 2016–2025 (Units)
Table 76 Norway: Market, By Type, 2016–2025 (’000 USD)
Table 77 Switzerland: Market, By Type, 2016–2025 (Units)
Table 78 Switzerland: Market, By Type, 2016–2025 (’000 USD)
Table 79 North America: Market, By Country, 2016–2025 (Units)
Table 80 North America: Market, By Country, 2016–2025 (‘000 USD)
Table 81 Canada: Market, By Type, 2016–2025 (Units)
Table 82 Canada: Market, By Type, 2016–2025 (‘000 USD)
Table 83 US: Market, By Type, 2016–2025 (Units)
Table 84 US: Market, By Type, 2016–2025 (’000 USD)
Table 85 New Product Developments, 2017–2018
Table 86 Expansions, 2017
Table 87 Partnerships/Supply Contracts/Collaborations/Joint Ventures/ Agreements/Mergers & Acquisitions, 2016–2018
List of Figures (67 Figures)
Figure 1 EV Connectors: Markets Covered
Figure 2 EV Connectors Market: Research Design
Figure 3 Research Methodology Model
Figure 4 Breakdown of Primary Interviews
Figure 5 Market Size Estimation Methodology for the EV Connectors: Bottom-Up Approach
Figure 6 Market Size Estimation Methodology for the EV Connectors: Top-Down Approach
Figure 7 Data Triangulation
Figure 8 Market, By Region, 2018–2025 (USD Million)
Figure 9 Market, By Type, 2018 vs 2025 (USD Million)
Figure 10 High Adoption Rate of Electric Vehicles Coupled With Rapid Development of EV Charging Points is Likely to Boost the Growth of Market From 2018 to 2025
Figure 11 India is Estimated to Be the Fastest Growing Market From 2018 to 2025
Figure 12 Type 1 Segment of Market to Have the Largest Market Size By 2025
Figure 13 Level 3 Segment to Have the Largest Share of Market, 2018 vs 2025
Figure 14 Fast Charging Connector Segment to Have the Largest Share of Market, 2018 vs 2025
Figure 15 DC Charging Voltage Segment to Hold the Largest Share of Market, 2018 vs 2025
Figure 16 Residential Charging Segment to Hold the Largest Share of Market, 2018 vs 2025
Figure 17 Asia Pacific to Be the Largest Market, 2018 vs 2025
Figure 18 EV Connectors: Market Dynamics
Figure 19 EV Connectors Market, By Level of Charging, 2018–2025 (USD Million)
Figure 20 Level 1: Market, By Region, 2018 vs 2025 (USD Thousand)
Figure 21 Level 2: Market, By Region, 2018 vs 2025 (USD Thousand)
Figure 22 Level 3: Market, By Region, 2018 vs 2025 (USD Thousand)
Figure 23 Level 4: Market, By Region, 2018 vs 2025 (USD Thousand)
Figure 24 Key Primary Insights
Figure 25 Market, By Type, 2018–2025 (USD Million)
Figure 26 Type 1: Market, By Region, 2018 vs 2025 (’000 USD)
Figure 27 CCS: Market, By Region, 2018 vs 2025 (’000 USD)
Figure 28 Chademo: Market, By Region, 2018 vs 2025 (’000 USD)
Figure 29 Others: Market, By Region, 2018 vs 2025 (’000 USD)
Figure 30 Type 3: Market, By Region, 2018 vs 2025 (’000 USD)
Figure 31 Key Primary Insights
Figure 32 Market, By End User, 2018–2025 (USD Million)
Figure 33 Residential Charging: Market, By Region, 2018 vs 2025 (USD Million)
Figure 34 Commercial Charging: Market, By Region, 2018 vs 2025 (USD Million)
Figure 35 Key Primary Insights
Figure 36 Market, By Charging Speed, 2018–2025 (USD Million)
Figure 37 Slow Charger: Market, By Region, 2018 vs 2025 (‘000 USD)
Figure 38 Fast Charger: Market, By Region, 2018 vs 2025 (‘000 USD)
Figure 39 Rapid Charger: Market, By Region, 2018 vs 2025 (‘000 USD)
Figure 40 EV Connectors Market, By Current Supply, 2018–2025 (USD Million)
Figure 41 AC Charging: Market, By Region, 2018 vs 2025 (‘000 USD)
Figure 42 DC Charging: Market, By Region, 2018 vs 2025 (‘000 USD)
Figure 43 Key Primary Insights
Figure 44 Market, By Region, 2018 vs 2025 (USD Million)
Figure 45 Asia Pacific: Market Snapshot
Figure 46 Europe: Market, By Country, 2018 vs 2025 (USD Million)
Figure 47 North America: Market Snapshot
Figure 48 Key Developments By Leading Players in the Market, 2016–2018
Figure 49 Yazaki Led the Market in 2017
Figure 50 EV Connectors Market (Global): Competitive Leadership Mapping, 2018
Figure 51 Yazaki: Company Snapshot
Figure 52 Yazaki: SWOT Analysis
Figure 53 TE Connectivity: Company Snapshot
Figure 54 TE Connectivity: SWOT Analysis
Figure 55 Sumitomo: Company Snapshot
Figure 56 Sumitomo: SWOT Analysis
Figure 57 Schneider Electric: Company Snapshot
Figure 58 Schneider Electric Se: SWOT Analysis
Figure 59 Huber+Suhner: Company Snapshot
Figure 60 Huber+Suhner: SWOT Analysis
Figure 61 Tesla: Company Snapshot
Figure 62 Bosch: Company Snapshot
Figure 63 ITT: Company Snapshot
Figure 64 Amphenol: Company Snapshot
Figure 65 Siemens AG: Company Snapshot
Figure 66 ABB: Company Snapshot
Figure 67 Fujikura: Company Snapshot
The study involved 4 major activities in estimating the current market size for EV connectors. Exhaustive secondary research was done to collect information on market, peer market, and parent market. The next step was to validate these findings, assumptions, and sizing with industry experts across value chains through primary research. Both top-down and bottom-up approaches were employed to estimate the complete market size. Thereafter, market breakdown and data triangulation were used to estimate the market size of segments and subsegments.
Secondary Research
In the secondary research process, various secondary sources such as company annual reports/presentations, press releases, industry association publications [European Alternative Fuels Observatory (EAFO), Environmental Protection Agency (EPA), ROEV Association, Chademo Association, Electric Vehicle Charging Association (EVCA), European Association for Battery, Hybrid and Fuel Cell Electric Vehicles (AVERE), Alternative Fuels Data Center (AFDC), and China Association Of Automoblie Manufacturers (CAAM)], automotive magazine articles, directories, technical handbooks, World Economic Outlook, trade websites, technical articles, and databases (Marklines and Factiva) have been used to identify and collect information useful for an extensive commercial study of the global EV Charging Connector Market.
Primary Research
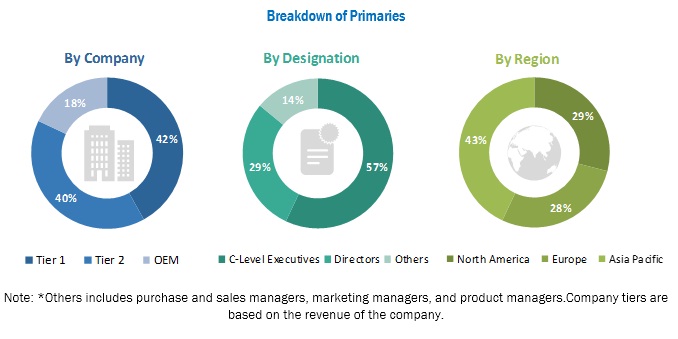
Extensive primary research has been conducted after acquiring an understanding of the EV Charging Connector Market scenario through secondary research. Several primary interviews have been conducted with market experts from the demand- and supply-side OEMs [(in terms of component supply), country-level government associations, and trade associations] and component manufacturers across 3 major regions, namely, North America, Europe, and Asia Pacific. Approximately 23% and 77% of primary interviews have been conducted from the demand and supply side, respectively. Primary data has been collected through questionnaires, emails, and telephonic interviews. In the canvassing of primaries, we have strived to cover various departments within organizations, such as sales, operations, and administration, to provide a holistic viewpoint in our report.
After interacting with industry experts, we have also conducted brief sessions with highly experienced independent consultants to reinforce the findings from our primaries. This, along with the in-house subject-matter expert’s opinions, has led us to the findings as described in the remainder of this report.
Following are the breakdown of primary respondents:
To know about the assumptions considered for the study, download the pdf brochure
Market Size Estimation
Both top-down and bottom-up approaches were used to estimate and validate the total size of the EV Charging Connector Market. These methods were also used extensively to estimate the size of various subsegments in the market. The research methodology used to estimate the market size includes the following:
- The key players in the industry and markets have been identified through extensive secondary research
- The industry’s supply chain and market size, in terms of value, have been determined through primary and secondary research processes
- All percentage shares, splits, and breakdowns have been determined using secondary sources and verified through primary sources
Data Triangulation
After arriving at the overall market size-using the market size estimation processes as explained above-the market was split into several segments and subsegments. To complete the overall market engineering process and arrive at the exact statistics of each market segment and subsegment, data triangulation and market breakdown procedures were employed, wherever applicable. The data was triangulated by studying various factors and trends from both demand and supply sides.
Report Objectives
- To analyze and forecast the EV Charging Connector Market and its size, in terms of volume (units) and value (USD billion), from 2018 to 2025
- To provide detailed information regarding the major factors influencing the growth of the Market (drivers, restraints, opportunities, and industry-specific challenges)
- To analyze the regional markets for growth trends, prospects, and their contribution to the overall Market
- To segment the Market and forecast its size, by volume and value, based on region (Asia Pacific, Europe, and North America)
- To segment the Market and forecast the market size, by volume and value, based on charging levels (level1, level2, level3, and level4)
- To segment the Market and forecast the market size, by volume and value, based on type (type1, type2, and type 3)
- To segment the Market and forecast the market size, by volume and value, based on end-user (residential and commercial)
- To segment the Market and forecast the market size, by volume and value, based on charging speed (slow charge, fast charge, and rapid charge)
- To segment the Market and forecast the market size, based on the station (wall mounted and floor mounted)
- To segment the Market and forecast the market size, by volume and value, based on charging voltage (AC charging and DC charging)
- To segment the Market and forecast the market size, based on cable type (straight cable and coiled cable)
- To segment the Market and forecast the market size, based on components (leads, adapter, portable chargers, wallpod, wallbox, and delta AC mini plus)
- To analyze opportunities for stakeholders and the competitive landscape for market leaders
- To strategically profile key players and comprehensively analyze their respective market share and core competencies
- To track and analyze competitive developments such as joint ventures, mergers & acquisitions, new product launches, expansions, and other activities carried out by the key industry participants
Available Customizations
- EV Charging Connector Market, by type, additional countries (up to 2)
-
Company information
- Profiling of additional market players (up to 5)


Growth opportunities and latent adjacency in EV Charging Connector Market