eVTOL Aircraft Market Size, Share, Revenue Trends and Growth

eVTOL Aircraft Market by Lift Technology (Vectored Thrust, Multirotor, Lift Plus Cruise), Propulsion Type (Fully Electric, Hybrid Electric, Hydrogen Electric), System, Mode of Operation, Application, MTOW, Range and Region - Global Forecast to 2030

Report Code: AS 6984 Jul, 2023, by marketsandmarkets.com

Update:: 27.09.24

eVTOL Aircraft Market Size & Growth

The eVTOL Aircraft market size is projected to grow from USD 1.2 Billion in 2023 to USD 23.4 Billion by 2030, at a CAGR of 52.0% from 2023 to 2030. Electric Vertical Takeoff and Landing (eVTOL) aircraft serve the purpose of providing efficient, sustainable, and versatile transportation solutions for both passengers and cargo. eVTOLs are aircraft that can take off and land vertically, utilizing electric propulsion systems to achieve vertical flight and offering the potential for quiet, emission-free operations. These advanced aircraft are designed to operate in urban environments, overcoming traffic congestion by utilizing vertical space and providing faster point-to-point transportation. With their ability to hover, maneuver in tight spaces, and potentially operate autonomously, eVTOLs have the potential to revolutionize urban air mobility, offering convenient air taxi services and serving as efficient platforms for transportation, emergency response, and aerial logistics. Their electric propulsion systems contribute to reduced noise pollution and lower carbon emissions, aligning with the increasing focus on sustainable transportation solutions.
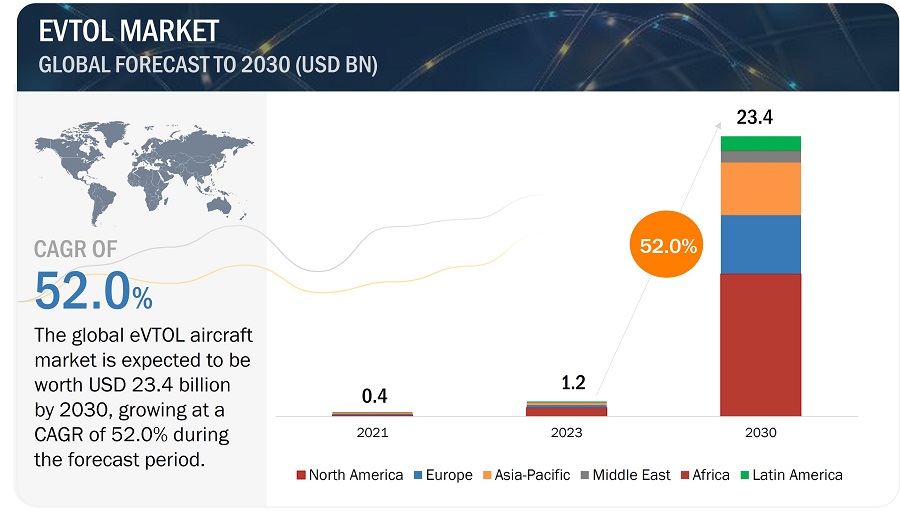
eVTOL  Aircraft Market

eVTOL  Aircraft Market

eVTOL Aircraft Market Forecast to 2030

To know about the assumptions considered for the study, Request for Free Sample Report

eVTOL Aircraft Market Dynamics.

Driver: Improving technologies in batteries, motors, and power electronics

Improving technologies in batteries, motors, and power electronics serve as a catalyst for market growth. The continuous improvement in technologies related to batteries, motors, and power electronics serves as a significant driver for the EVTOL market. Breakthroughs in battery technology, such as advancements in energy density and faster charging capabilities, enable EVTOL aircraft to achieve longer flight ranges and reduced recharge times, enhancing their viability and commercial appeal. Similarly, advancements in electric motors, including higher power-to-weight ratios and increased efficiency, contribute to improved aircraft performance, enabling EVTOLs to take off, hover, and maneuver more effectively. Additionally, developments in power electronics, such as advanced motor controllers and energy management systems, enhance the overall efficiency and reliability of EVTOLs, optimizing energy consumption and extending flight durations. These technological advancements not only enable EVTOLs to meet performance and safety requirements but also contribute to reduced operational costs and environmental impact, fostering their widespread adoption. As battery, motor, and power electronics technologies continue to evolve, the EVTOL market is poised to benefit from increased efficiency, expanded capabilities, and improved overall performance, driving the growth and market potential of EVTOL aircraft.

Driver: Growing need for green energy and noise-free aircraft

The rising concern for clean energy stemming from the increased CO2 emissions is a concern that is growing. According to the (Energy Information Administration International (EIA) Energy Report 2021, the amount of CO2 emissions has increased largely from the growing population. The Air Transport Air Group (ATAG) reported that the global aviation industry produces roughly 2% of all CO^2 emissions. Their latest announcement from ATAG made a commitment to address climate change through a long-term climate action process and targeted a goal of cutting CO2 emissions in half by 2050. Among other technologies, the research and development of hybrid and electric hydrogen (eVTOL) projects may facilitate the transition away from fossil fuel for power and/or toward sustainable aviation fuel for growth in the air transport industry. New improvements to aircraft also add additional pressures to the eVTOL market as the climate changes. Concerns for climate change and sustainability are of priority, while there is a growing need for cleaner and greener transportation solutions. eVTOLs produce zero emissions under their electric propulsion system during the product's journey, thereby decreasing carbon emissions during the flight in comparison to traditional aircraft. Moreover, eVTOLs have better noise conditions than traditional airplanes and helicopters, thereby addressing public consumption noise concerns that arise from the noise made during the flight. The combination of zero carbon footprint and a more sustainable and noise reduction option for air transportation in comparison to traditional aircraft has fueled the global sustainable base for aviation.

Thus, the eVTOL aircraft uses the above sustainable aviation fuel to reduce carbon emissions. As per the US Department of Transportation’s Volpe National Transportation Systems Center, eVTOL manufacturers should use a variety of integrated, simulated, and dual-use aircraft noise models that have been developed over the years by the FAA (Federal Air Aviation), NASA, and the US Department of Défense. Thus, some eVTOL aircraft manufacturers, such as Airbus SE (Netherlands), Bell Textron Inc. (US), EHang Holdings Ltd. (China), and Joby Aviation Inc. (US), have developed various models producing less carbon emission and noise. For example, Airbus has revealed its CityBus next GEN aircraft, the quieter version with zero-emission eVTOL.

Restraint: eVTOL aircraft crash due to failure in software

The occurrence of EVTOL aircraft crashes resulting from software failures serves as a significant restraint for the EVTOL market. The reliance on complex software systems for flight control and autonomous operations introduces a potential vulnerability, where software malfunctions or glitches can lead to catastrophic accidents. Such incidents can undermine public trust in the safety and reliability of EVTOLs, impeding market growth and regulatory approvals. The potential risks associated with software failures necessitate stringent testing, certification processes, and robust safety measures to mitigate these concerns. As EVTOL manufacturers address these challenges and implement robust software development practices, including thorough testing, redundancy, and fail-safe mechanisms, they can enhance the safety and reliability of their aircraft, alleviating concerns and driving market acceptance.

Restraint: Battery failures due to high voltage and thermal issues

In eVTOL aircraft, the size, weight, and power must be carefully balanced. The aircraft needs an energy-dense battery that can accommodate power requirements while still being light and small. eVTOL aircraft is bounded by limitations of electric power. It needs high power during the take-off, landing, and when it flies into crosswinds. Thus, the power density of the battery should be high. The need for increased power requirements can be met by increasing the number of rechargeable batteries, which in turn will increase the payload capacity. As the batteries are designed with high power and fast charging capabilities, the battery gets heated up quickly. This results in a thermal emission of one hundred kilowatts and can also cause the battery to fail or be involved in an accident.

Overcharging, or experiencing high voltage spikes, could entail thermal runoff, cell degradation, and potentially fires in the battery that can affect the safety and reliability of the aircraft. These failures expose the passengers and crew to an elevated risk, as well as can jeopardy and strain public acceptance and regulatory processes.

Thermal-runoff, or the generation of excessive heat generation, is another major hurdle for eVTOL batteries. The high power requirements during eVTOL operations can cause rapid heating of the batteries: if the batteries cannot dissipate excess heat, thermal runaway and cell degradation are the likely outcome, with an adverse effect upon the performance and lifecycle of the battery. The thermal-runoff issue limits the functionality of eVTOL aircraft in terms of flight time and utility, which reduces commercial viability.

As per a battery manufacturer Luminati VTOL LLC (US), almost every major eVTOL aircraft developer witnessed fire incidents due to battery-pack failures. The company reported incidents in US, where a single cell anomaly in a 4,000-cell battery pack produced a chain reaction in December 2019, resulting in damage worth USD 2.4 million. In February 2020, Lilium GmbH suffered a major setback when its first five-seat technology demonstrator Phoenix was destroyed in a ground fire. This incident occurred during the installation of a battery on the ground after the maintenance of a battery module. It was not the battery that had to be used on the serial aircraft. The battery used was a basic battery system without fire protection measures.

Opportunity: Strategic developments serves as an opportunity

Strategic developments serve as opportunities for the EVTOL market. Strategic collaborations and partnerships between aerospace manufacturers, technology companies, and transportation service providers enable the pooling of expertise, resources, and networks, accelerating the development and commercialization of EVTOLs. These partnerships foster innovation, enhance research and development capabilities, and drive advancements in technology, regulatory frameworks, and infrastructure. Additionally, strategic investments in EVTOL start-ups and the establishment of dedicated test sites and vertiports create an ecosystem conducive to EVTOL deployment. The support from governments and regulatory bodies in the form of favorable policies, grants, and incentives further propels market opportunities. Strategic developments foster a collaborative and supportive environment, enabling the EVTOL market to flourish and unlock its full potential as a transformative mode of transportation.

Challenge: Safety Issues

Safety issues pertaining to the eVTOL market pose significant challenges to its growth and widespread adoption. The unique nature of eVTOL aircraft, with their vertical takeoff and landing capabilities, autonomous operations, and integration into urban airspace, introduces complex safety considerations. Ensuring the safety of passengers, crew, and people on the ground is of paramount importance. Challenges arise from multiple fronts. Firstly, the development and certification of autonomous flight systems necessitate robust testing procedures, risk assessment methodologies, and fail-safe mechanisms to ensure reliable and safe operations. This requires addressing potential software glitches, sensor failures, and communication disruptions that could lead to accidents. Secondly, the integration of eVTOLs into existing airspace systems presents challenges related to air traffic management, collision avoidance, and routing protocols. Coordination with air traffic control and other aircraft operators is crucial to ensure seamless and safe operations. Additionally, the eVTOL market must address concerns surrounding the resilience of battery systems, emergency procedures for in-flight contingencies, and the impact of adverse weather conditions on flight operations. Overcoming these safety challenges requires close collaboration between industry stakeholders, regulators, and standards organizations to establish comprehensive safety standards, robust certification processes, and a culture of continuous improvement. Adhering to stringent safety protocols, investing in rigorous testing and simulation, and maintaining transparent reporting of safety incidents is essential to instilling public confidence and addressing the challenges posed by safety in the eVTOL market.

Challenge: Lack of regulatory standards

A key challenge of eVTOL aircraft is the absence of appropriate regulatory standards. Standards developing organizations, like ASTM International, RTCA, SAE International, and the European Organisation for Civil Aviation Equipment (EUROCAE), have been working toward developing standards in support of certification. The General Aviation Manufacturers Association (GAMA) has been working with the US Federal Aviation Administration (FAA), the European Union Aviation Safety Agency (EASA), and other regulators to facilitate standard development for eVTOL certification. According to industry professionals in a panel hosted by Vertical Flight Society’s 2021 Autonomous VTOL Technical Meeting and Electric VTOL Symposium, there are several gaps in current standards that have forced applicants to flood regulatory bodies with proposals on means of compliance to special conditions or rules, and each must be evaluated independently. Thus, it is expected to be challenging to set standards for eVTOL.

Evtol Aircraft Market Ecosystem

The eVTOL market ecosystem comprises aerospace manufacturers, technology firms, and transportation service providers collaborating to drive innovation and commercialization. It involves strategic partnerships, investments, and research efforts to develop advanced propulsion systems, battery technologies, and autonomous flight capabilities. Regulatory bodies, government agencies, and infrastructure developers also play a crucial role in shaping the eVTOL market ecosystem by establishing safety standards, certification processes, and dedicated infrastructure such as vertiports and charging networks. The prominent companies are Jaunt Air Mobility (US), Lilium (Germany), Volocopter (Germany), and EHang (China), among others.
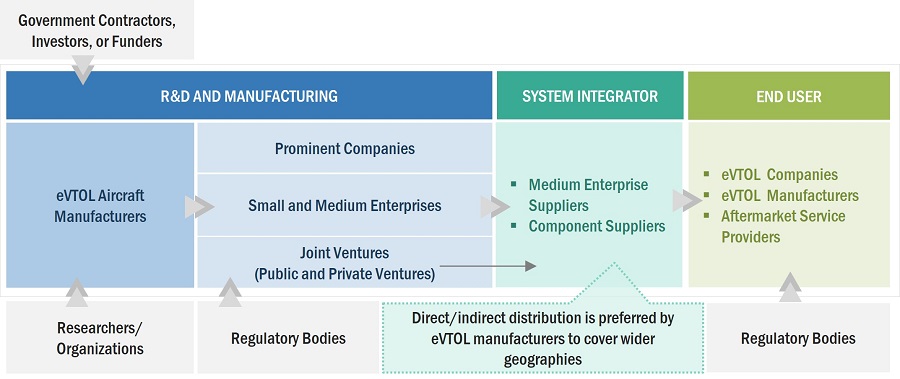
eVTOL  Aircraft Market by Ecosystem

The Vectored Thrust segment accounts for the largest market size during the forecast period.

Based on Lift Technology, the market has been segmented into Vectored Thrust, Multirotor, and Lift Plus Cruise in the eVTOL Aircraft market.

Vectored thrust, as an EVTOL lift technology, commands the largest market share due to its exceptional characteristics. Its capability to manipulate propulsive force direction enhances maneuverability, making it ideal for diverse applications in the urban air mobility sector. With precise control during takeoff, landing, and hover, it offers heightened stability and versatility. Furthermore, its proven performance and established use in conventional aircraft inspire confidence among manufacturers and operators, consolidating its market dominance.

The Piloted segment is projected to have a higher growth rate during the forecast period.

Based on the mode of operation, the eVTOL Aircraft market has been segmented into piloted and autonomous. Among EVTOL modes of operations, piloted operation emerges as the fastest-growing segment. While autonomous holds future potential, piloted operation exhibits advantages that propel its growth. Passengers find reassurance and trust in the presence of human pilots, particularly during the initial stages of EVTOL deployment. Addressing safety concerns and regulatory compliance becomes more streamlined with human oversight. Moreover, seamless integration with existing airspace infrastructure and air traffic management systems simplifies the regulatory framework and accelerates market acceptance.

The > 200 Km segment is projected to have a higher growth rate during the forecast period.

Based on the range, the eVTOL Aircraft market has been segmented into <= 200 km and > 200 km. The >200 km range category demonstrates the highest growth rate within the EVTOL market. This extended range capability unlocks diverse opportunities, enabling EVTOLs to cater to regional air transportation requirements and efficiently connect distant locations. Suitable for intercity connections and longer-distance travel, this range meets the demands of a broader customer base. Leveraging advancements in battery efficiency and energy storage, this category strikes an optimal balance between payload capacity and energy efficiency. The expansion of this range fuels its faster compound growth, establishing it as a prominent segment within the EVTOL market.

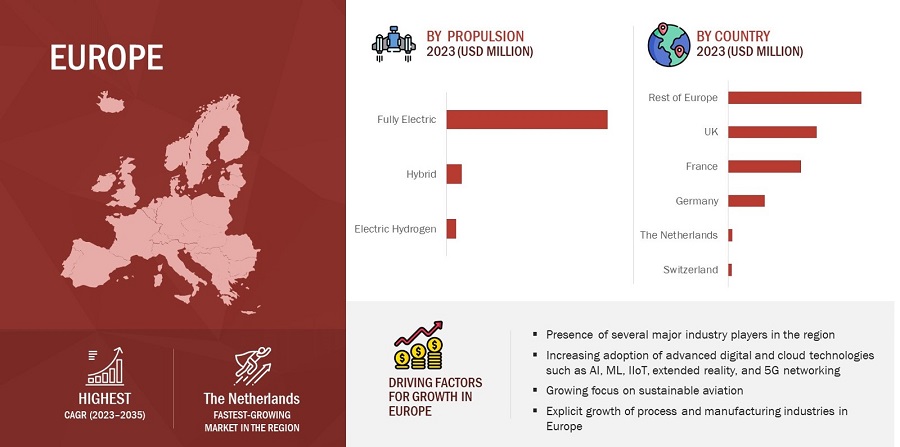
Europe is projected to grow at the highest CAGR during the forecast period.

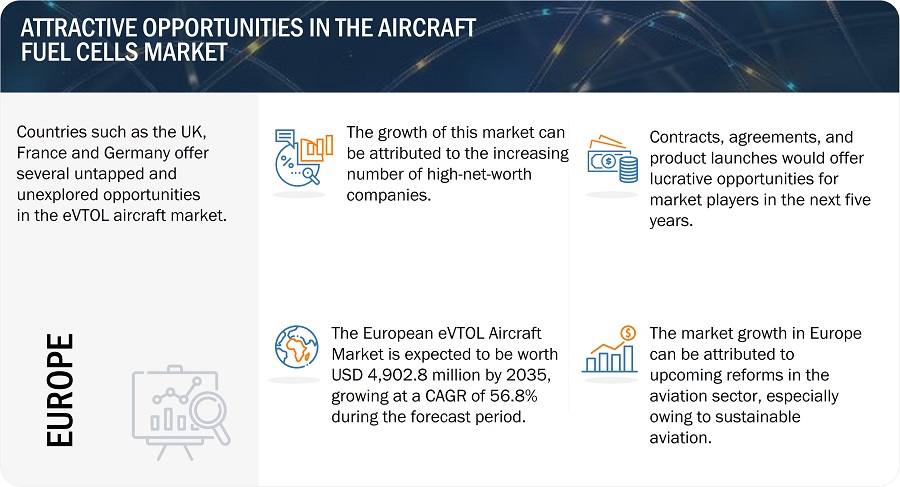
Europe is projected to be the fastest-growing region in the eVTOL Aircraft market during the forecast period, owing to a number of variables that support the region's growth potential. The region has witnessed significant economic development, which has resulted in greater air travel demand and a rising commercial aviation sector. The rising emphasis on sustainable aviation practices and the emergence of urban air mobility and advanced air mobility solutions will drive the demand for eVTOL Aircraft. Numerous growing economies, like France, the UK, and Germany, have made significant investments in their aerospace sectors in Europe. The presence of important aircraft manufacturers and suppliers in the region has contributed to Europe's market leadership in eVTOL Aircraft.

eVTOL  Aircraft Market by Region

eVTOL Aircraft Market by Region

To know about the assumptions considered for the study, download the pdf brochure

Asia Pacific is projected to grow at the second highest CAGR during the forecast period.

China, India, Japan, Australia, South Korea, and the Rest of Asia Pacific are covered in this region for market analysis. The eVTOL aircraft market in the Asia Pacific region is growing rapidly and is characterized by substantial urban congestion and accelerated urbanization. As per the forecast, the GDP is expected to rise during the next ten years, and emerging countries such as China and India offer significant potential for market growth. Due to stable growth and robust economic development, China has attracted significant foreign investments. The expansion of this evolving market is largely attributed to government assistance in terms of supportive legislation, collaboration, funding, and partnerships. The region also has a strong technological ecosystem adjacent to eVTOL development that includes examples of AI and 5G, as well as advances in battery technology.

Latin America is projected to grow at the third highest CAGR during the forecast period.

Brazil, Mexico, and the Rest of Latin America, which includes Chile, Argentina, Paraguay, and Peru, are covered under Latin America. Brazil is the world’s fourth-largest market for civil helicopters. Several Brazilian companies are investing in the manufacturing of eVTOL.Eve Urban Air Mobility Solutions (US) is an independent company established by Embraer engaged in developing the urban air mobility ecosystem. Currently, the eVTOL aircraft market in Mexico is very nascent, but we expect this growth to spark an uptick in the coming years. Mexico has several factors that favor the market, including a growing middle class, a rising demand for urban air mobility, and a supportive government.

Key Market Players

Major players operating in the eVTOL Aircraft companies are Jaunt Air Mobility (US), Lilium (Germany), Volocopter (Germany), and EHang (China), among others.  

eVTOL Aircraft Market Report Scope

Report Metric

Details

Estimated Market Size

USD 1.2 Billion in 2023

Projected Market Size

USD 23.4 Billion by 2030

eVTOL Aircraft Market Growth Rate (CAGR)

52.0%

Market size available for years

2019-2030

Base year considered

2022

Forecast period

2023-2030

Forecast units

Value (USD Million/Billion)

Segments  Covered

Lift Technology, Propulsion Type, System, Mode of Operation, Application, Mtow, Range and Region

Geographies Covered

North America, Europe, Asia-Pacific, Latin America, Middle East, and Africa

Companies Covered

Airbus SE (Netherlands), Elbit Systems Ltd.(Israel), Bell Textron, Inc. (US), Ehang Holdings Ltd. (China), Embraer SA (Brazil), Israel Aerospace Industries (Israel),

eVTOL Aircraft Market Highlights

This research report categorizes the eVTOL Aircraft market based on Lift Technology, Propulsion Type(, System, Mode of Operation, Application, Mtow, Range, and Region.

Segment

Subsegment

By Lift Technology

  • Vectored Thrust
  •  Multirotor
  • Lift plus Cruise

By Propulsion Type

  • Fully Electric
  • Hybrid
  • Electric hydrogen

By System

  • Batteries & Cells
  •  Electric motors/Engines
  • Aerostructures
  • Avionics
  • Software
  • Others

By Mode Of Operation

  • autonomous
  •  piloted  

By Application

  • Air Taxis
  • Air Shuttles & Air Metro
  • Private Transport
  • Cargo Transport
  • Air Ambulance & Medical Emergency
  • Last Mile Delivery
  • Inspection & Monitoring
  • Surveying & Mapping
  • Surveillance
  • Special Mission
  • Others

By Mtow

  • <100 kg
  • 100-1,000 kg
  • 1,000-2,000 kg
  • >2,000 kg

By Range

  • <=200 km
  • >200 km

By Region

  • North America
  • Europe
  • Asia Pacific
  • Middle East
  • Africa
  • Latin America

Recent Developments

  • AutoFlight, a Shanghai-based R&D specialist in autonomous flight and eVTOL technology, has secured a significant purchase commitment from EVFLY, an advanced air mobility services provider. Following AutoFlight's successful completion of the longest eVTOL flight to date with its Prosperity I all-electric aircraft, the deal entails over 200 eVTOL cargo and passenger aircraft that will form part of one of the world's first commercially available global fleets. Over the years, AutoFlight has been a focal point of our coverage, diligently working to develop and launch its flagship Prosperity I eVTOL, showcasing its commitment to advancing the field of autonomous flight and vertical take-off and landing technology.PowerCell, a leading fuel cell technology company, has achieved a groundbreaking milestone by signing a historic contract with ZeroAvia, a pioneering zero-emission aviation company. This contract marks the world's first-ever agreement for the serial delivery of hydrogen fuel stacks to the aviation industry. The agreement, valued at up to SEK 1.51 billion, is contingent on ZeroAvia obtaining the necessary certifications and entails the supply of 5,000 hydrogen fuel cell stacks. The deliveries are scheduled to commence in 2024. ZeroAvia, known for its focus on hydrogen-electric aviation solutions, aims to launch a 19-seat aircraft with a range of 300 miles by 2025.
  • Lilium, a prominent player in the eVTOL market, has signed agreements with both Air-Dynamic SA and ASL Group. The agreement with Air-Dynamic involves pre-delivery payments for up to five Lilium eVTOL aircraft. Air-Dynamic, a Switzerland-based private jet and helicopter company, intends to operate these aircraft for customers in Switzerland and Italy. Additionally, Lilium has announced an agreement with ASL Group, a European business jet operator, for the purchase of six Pioneer Edition Jets. This agreement follows a previous Memorandum of Understanding (MoU) between ASL Group and Lilium, signed in July 2022. As part of the MoU, the companies have agreed to establish a network of landing sites spanning Belgium, Netherlands, Luxembourg, and Western Germany. These recent agreements highlight Lilium's expanding partnerships and growing presence in the eVTOL market, facilitating their vision of providing efficient and sustainable air transportation solutions across Europe.
  • Volocopter and Safran Electrical & Power have signed an agreement at the Paris Air Show 2023 to collaborate on developing a next-generation powertrain for eVTOL aircraft. The collaboration aims to explore commercial and engineering partnerships, focusing on the entire electric powertrain, including the electrical propulsion system, battery units, and power distribution system. This strategic partnership signifies a significant step forward in advancing sustainable and efficient electric propulsion systems for the rapidly evolving urban air mobility sector.

Frequently Asked Questions (FAQ):

To speak to our analyst for a discussion on the above findings, click Speak to Analyst

TABLE OF CONTENTS
 
1 INTRODUCTION (Page No. - 34)
    1.1 STUDY OBJECTIVES 
    1.2 MARKET DEFINITION 
    1.3 MARKET SCOPE 
           1.3.1 MARKETS COVERED
                    FIGURE 1 EVTOL AIRCRAFT MARKET SEGMENTATION
           1.3.2 YEARS CONSIDERED
           1.3.3 REGIONAL SCOPE
    1.4 INCLUSIONS AND EXCLUSIONS 
           TABLE 1 INCLUSIONS AND EXCLUSIONS IN EVTOL AIRCRAFT MARKET
    1.5 CURRENCY CONSIDERED 
    1.6 LIMITATIONS 
    1.7 MARKET STAKEHOLDERS 
    1.8 SUMMARY OF CHANGES 
 
2 RESEARCH METHODOLOGY (Page No. - 39)
    2.1 RESEARCH DATA 
           FIGURE 2 REPORT PROCESS FLOW
           FIGURE 3 RESEARCH DESIGN
           2.1.1 SECONDARY DATA
           2.1.2 PRIMARY DATA
                    2.1.2.1 Key primary sources
                    2.1.2.2 Key primary insights
    2.2 MARKET SIZE ESTIMATION 
           2.2.1 SEGMENTS AND SUBSEGMENTS
    2.3 RESEARCH APPROACH AND METHODOLOGY 
           2.3.1 BOTTOM-UP APPROACH
                    2.3.1.1 Market size estimation
                               FIGURE 4 MARKET SIZE ESTIMATION METHODOLOGY: BOTTOM-UP APPROACH (DEMAND-SIDE)
                               FIGURE 5 MARKET SIZE ESTIMATION METHODOLOGY: BOTTOM-UP APPROACH (SUPPLY-SIDE)
           2.3.2 TOP-DOWN APPROACH
                    FIGURE 6 MARKET SIZE ESTIMATION METHODOLOGY: TOP-DOWN APPROACH
    2.4 DATA TRIANGULATION AND VALIDATION 
           FIGURE 7 DATA TRIANGULATION
           2.4.1 TRIANGULATION THROUGH PRIMARY AND SECONDARY RESEARCH
    2.5 GROWTH RATE FACTORS 
    2.6 RISKS 
    2.7 RESEARCH ASSUMPTIONS 
 
3 EXECUTIVE SUMMARY (Page No. - 48)
    FIGURE 8 BATTERIES AND CELLS TO ACCOUNT FOR LARGEST MARKET SHARE IN 2023
    FIGURE 9 EVTOL AIRCRAFT, BY LIFT TECHNOLOGY, 2023
    FIGURE 10 FULLY ELECTRIC SEGMENT TO DOMINATE MARKET IN 2023
    FIGURE 11 EVTOL AIRCRAFT MARKET IN LATIN AMERICA TO GROW AT HIGHEST CAGR DURING FORECAST PERIOD
 
4 PREMIUM INSIGHTS (Page No. - 51)
    4.1 OVERVIEW OF ATTRACTIVE OPPORTUNITIES IN EVTOL AIRCRAFT MARKET 
           FIGURE 12 GROWING NEED FOR CLEANER AND QUIETER AIRCRAFT TO DRIVE MARKET DURING FORECAST PERIOD
    4.2 EVTOL AIRCRAFT MARKET, BY MODE OF OPERATION 
           FIGURE 13 AUTONOMOUS SEGMENT PROJECTED TO LEAD MARKET FROM 2023 TO 2030
    4.3 EVTOL AIRCRAFT MARKET, BY MTOW 
           FIGURE 14 100-1,000 KG SEGMENT PROJECTED TO HAVE HIGHEST SHARE DURING FORECAST PERIOD
    4.4 EVTOL AIRCRAFT MARKET, BY RANGE 
           FIGURE 15 <=200 KM SEGMENT PROJECTED TO ACCOUNT FOR HIGHEST MARKET SHARE DURING FORECAST PERIOD
    4.5 EVTOL AIRCRAFT MARKET, BY TOP COUNTRIES 
           FIGURE 16 EVTOL AIRCRAFT MARKET IN NETHERLANDS TO GROW AT HIGHEST CAGR DURING FORECAST PERIOD
 
5 MARKET OVERVIEW (Page No. - 54)
    5.1 INTRODUCTION 
    5.2 MARKET DYNAMICS 
           FIGURE 17 EVTOL AIRCRAFT MARKET DYNAMICS
           5.2.1 DRIVERS
                    5.2.1.1 Growing need for green energy and noise-free aircraft
                    5.2.1.2 Increasing demand for alternative mode of transport
                               FIGURE 18 GROWING POPULATION ACROSS REGIONS TO INCREASE DEMAND FOR ALTERNATIVE MODE OF TRANSPORTATION
                    5.2.1.3 Improving technologies in batteries, motors, and power electronics
           5.2.2 RESTRAINTS
                    5.2.2.1 Battery failures due to high voltage and thermal issues
                    5.2.2.2 Crash due to software failures
                    5.2.2.3 Certification issues
                               FIGURE 19 EVTOL CERTIFICATION ECOSYSTEM
           5.2.3 OPPORTUNITIES
                    5.2.3.1 Strategic developments
                    5.2.3.2 Upcoming application areas
           5.2.4 CHALLENGES
                    5.2.4.1 Safety issues
                    5.2.4.2 Lack of regulatory standards
    5.3 VALUE CHAIN ANALYSIS 
           FIGURE 20 EVTOL AIRCRAFT MARKET: VALUE CHAIN ANALYSIS
           5.3.1 RAW MATERIALS
           5.3.2 R&D
           5.3.3 COMPONENT MANUFACTURING
           5.3.4 OEMS
           5.3.5 END USERS
    5.4 EVTOL AIRCRAFT MARKET ECOSYSTEM 
           5.4.1 PROMINENT COMPANIES
           5.4.2 PRIVATE AND SMALL ENTERPRISES
           5.4.3 END USERS
           FIGURE 21 EVTOL AIRCRAFT MARKET ECOSYSTEM
           TABLE 2 MARKET ECOSYSTEM
    5.5 DISRUPTION IMPACTING CUSTOMER’S BUSINESS 
           FIGURE 22 EVTOL AIRCRAFT MARKET ECOSYSTEM
    5.6 TRADE DATA ANALYSIS 
    5.7 PORTER’S FIVE FORCES ANALYSIS 
           TABLE 3 PORTER’S FIVE FORCES ANALYSIS
           5.7.1 THREAT OF NEW ENTRANTS
           5.7.2 THREAT OF SUBSTITUTES
           5.7.3 BARGAINING POWER OF SUPPLIERS
           5.7.4 BARGAINING POWER OF BUYERS
           5.7.5 INTENSITY OF COMPETITIVE RIVALRY
    5.8 AVERAGE SELLING PRICE 
           TABLE 4 AVERAGE SELLING PRICE: EVTOL MARKET, BY LIFT TECHNOLOGY
    5.9 VOLUME ANALYSIS 
           TABLE 5 EVTOL AIRCRAFT MARKET, BY VOLUME, 2020–2022 (USD MILLION)
           TABLE 6 MARKET, BY VOLUME, 2020–2030 (USD MILLION)
    5.10 TECHNOLOGY ANALYSIS 
           5.10.1 LITHIUM-SULFUR BATTERIES
           5.10.2 HYDROGEN FUEL CELLS
    5.11 TARIFF AND REGULATORY LANDSCAPE 
           5.11.1 THE EUROPEAN UNION AVIATION SAFETY AGENCY (EASA) REGULATION
           5.11.2 FEDERAL AVIATION ADMINISTRATION (FAA) REGULATION
    5.12 KEY CONFERENCES AND EVENTS, 2023–2024 
           TABLE 7 EVTOL AIRCRAFT MARKET: DETAILED LIST OF CONFERENCES AND EVENTS
 
6 INDUSTRY TRENDS (Page No. - 74)
    6.1 INTRODUCTION 
    6.2 EMERGING TRENDS 
           6.2.1 ARTIFICIAL INTELLIGENCE (AI)
           6.2.2 BIG DATA ANALYTICS
           6.2.3 INTERNET OF THINGS (IOT)
           6.2.4 CYCLOROTOR EVTOL
           6.2.5 URBAN AIR MOBILITY
           6.2.6 ENERGY HARVESTING
    6.3 CASE STUDIES 
           6.3.1 BETA TECHNOLOGIES DEVELOPED EVTOL AIRCRAFT WITH MICROSTRAIN SENSORS BY PARKER LORD
           6.3.2 JOBY AEROSPACE COMPLETED ALL-ELECTRIC FLIGHT WITH ELECTRIC VERTICAL TAKE-OFF AIR TAXI
    6.4 SUPPLY CHAIN ANALYSIS 
           FIGURE 23 SUPPLY CHAIN ANALYSIS
    6.5 IMPACT OF MEGATREND 
    6.6 INNOVATIONS AND PATENT ANALYSIS 
           TABLE 8 INNOVATION AND PATENT REGISTRATIONS, 2019–2023
 
7 EVTOL AIRCRAFT MARKET, BY LIFT TECHNOLOGY (Page No. - 81)
    7.1 INTRODUCTION 
           FIGURE 24 VECTORED THRUST SEGMENT PROJECTED TO LEAD EVTOL AIRCRAFT MARKET DURING FORECAST PERIOD
           TABLE 9 MARKET, BY LIFT TECHNOLOGY, 2020–2022 (USD MILLION)
           TABLE 10 MARKET, BY LIFT TECHNOLOGY, 2023–2030 (USD MILLION)
    7.2 VECTORED THRUST 
           7.2.1 BETTER EVTOL MANEUVERABILITY FOR OPTIMAL BUSINESS APPLICATIONS TO DRIVE MARKET
    7.3 MULTIROTOR 
           7.3.1 UTILIZATION IN SHORT-RANGE OPERATIONS TO FUEL GROWTH
    7.4 LIFT PLUS CRUISE 
           7.4.1 INCREASING ADOPTION BY LEADING EVTOL MANUFACTURERS TO DRIVE MARKET
 
8 EVTOL AIRCRAFT MARKET, BY PROPULSION TYPE (Page No. - 85)
    8.1 INTRODUCTION 
           FIGURE 25 FULLY ELECTRIC SEGMENT PROJECTED TO LEAD MARKET FOR EVTOL AIRCRAFT DURING FORECAST PERIOD
           TABLE 11 EVTOL AIRCRAFT MARKET, BY PROPULSION TYPE, 2020–2022 (USD MILLION)
           TABLE 12 MARKET, BY PROPULSION TYPE, 2023–2030 (USD MILLION)
    8.2 FULLY ELECTRIC 
           8.2.1 SILENT AND EMISSION-FREE PROPULSION TO DRIVE MARKET
    8.3 HYBRID ELECTRIC 
           8.3.1 LONGER RANGE AND LARGER TAKE-OFF WEIGHT CAPABILITIES TO BOOST MARKET
    8.4 HYDROGEN ELECTRIC 
           8.4.1 HIGH EFFICIENCY, LOW NOISE, AND LOW VIBRATION TO FUEL GROWTH
 
9 EVTOL AIRCRAFT MARKET, BY SYSTEM (Page No. - 89)
    9.1 INTRODUCTION 
           FIGURE 26 BATTERIES AND CELLS SEGMENT TO LEAD EVTOL MARKET DURING FORECAST PERIOD
           TABLE 13 EVTOL AIRCRAFT MARKET, BY SYSTEM, 2020–2022 (USD MILLION)
           TABLE 14 MARKET, BY SYSTEM, 2023–2030 (USD MILLION)
    9.2 BATTERIES AND CELLS 
           9.2.1 ADVANCEMENTS OFFERING HIGH POWER DENSITY TO FUEL MARKET
    9.3 ELECTRIC MOTORS/ENGINES 
           9.3.1 BETTER POWER DENSITY AND LONGER RANGE TO DRIVE MARKET
    9.4 AEROSTRUCTURES 
           9.4.1 ENHANCED PERFORMANCE AND ENERGY AND LOWER COSTS TO BOOST MARKET
    9.5 AVIONICS 
           9.5.1 ADVANCED AVIONICS FOR URBAN AIR TO DRIVE MARKET
    9.6 SOFTWARE 
           9.6.1 INCREASED USAGE IN EVTOL AIRCRAFT TO DRIVE MARKET
    9.7 OTHER SOLUTIONS 
           9.7.1 LOWER WEIGHT AND BETTER RELIABILITY TO DRIVE MARKET
 
10 EVTOL AIRCRAFT MARKET, BY MODE OF OPERATION (Page No. - 94)
     10.1 INTRODUCTION 
             FIGURE 27 PILOTED SEGMENT PROJECTED TO LEAD MARKET DURING FORECAST PERIOD
             TABLE 15 EVTOL AIRCRAFT MARKET, BY MODE OF OPERATION, 2020–2022 (USD MILLION)
             TABLE 16 MARKET, BY MODE OF OPERATION, 2023–2030 (USD MILLION)
     10.2 PILOTED 
             10.2.1 NEED FOR QUICK TRANSPORTATION TO DRIVE MARKET
     10.3 AUTONOMOUS 
             10.3.1 ADVANCED ALGORITHMS AND REAL-TIME SITUATIONAL AWARENESS TO INCREASE ADOPTION
 
11 EVTOL AIRCRAFT MARKET, BY APPLICATION (Page No. - 97)
     11.1 INTRODUCTION 
             FIGURE 28 LAST MILE DELIVERY SEGMENT PROJECTED TO GROW AT HIGHEST CAGR DURING FORECAST PERIOD
             TABLE 17 EVTOL AIRCRAFT MARKET, BY APPLICATION, 2020–2022 (USD MILLION)
             TABLE 18 MARKET, BY APPLICATION, 2023–2030 (USD MILLION)
     11.2 AIR TAXIS 
             11.2.1 RAPIDLY EXPANDING MEGACITIES TO INCREASE DEMAND
     11.3 AIR SHUTTLES AND AIR METROS 
             11.3.1 RAPID TRANSPORTATION BETWEEN LARGE METROPOLITAN AREAS TO FUEL MARKET
     11.4 PRIVATE TRANSPORT 
             11.4.1 SPEED AND ROUTING EFFICIENCIES TO BOOST MARKET
     11.5 CARGO TRANSPORT 
             11.5.1 DEVELOPMENT OF CARGO TRANSPORT URBAN AIR MOBILITY APPLICATIONS TO DRIVE MARKET
     11.6 AIR AMBULANCE AND MEDICAL EMERGENCY 
             11.6.1 ORGAN TRANSPORT AND EMERGENCY MEDICAL SERVICES TO DRIVE MARKET
     11.7 LAST MILE DELIVERY 
             11.7.1 INCREASED DEMAND FOR CONTACTLESS DELIVERIES TO DRIVE MARKET
     11.8 INSPECTION AND MONITORING 
             11.8.1 DRONES EQUIPPED WITH MULTISPECTRAL SENSORS USED ACROSS INDUSTRIES TO BOOST MARKET
     11.9 SURVEYING AND MAPPING 
             11.9.1 FASTER COLLECTION OF TOPOGRAPHIC DATA WITH LOWER WORKFORCE TO FUEL MARKET
     11.10 SURVEILLANCE 
             11.10.1 HI-TECH EVTOLS WITH HIGHLY ADVANCED SURVEILLANCE CAPABILITIES TO DRIVE MARKET
     11.11 SPECIAL MISSION 
             11.11.1 INCREASED ADOPTION FOR CRITICAL MISSIONS TO DRIVE MARKET
     11.12 OTHER APPLICATIONS 
             11.12.1 RECREATIONAL APPLICATIONS TO DRIVE MARKET
 
12 EVTOL AIRCRAFT MARKET, BY MTOW (Page No. - 104)
     12.1 INTRODUCTION 
             FIGURE 29 EVTOL AIRCRAFT WITH MTOW OF 1,001-2,000 KG TO GROW AT HIGHEST RATE DURING FORECAST PERIOD
             TABLE 19 EVTOL AIRCRAFT MARKET, BY MTOW, 2020–2022 (USD MILLION)
             TABLE 20 MARKET, BY MTOW, 2023–2030 (USD MILLION)
     12.2 <100 KG 
             12.2.1 SHORT MILE APPLICATIONS TO DRIVE MARKET
     12.3 100–1,000 KG 
             12.3.1 INCREASED CARGO TRANSPORTATION TO BOOST MARKET
     12.4 1,001–2,000 KG 
             12.4.1 INTERCITY TRANSPORT OF PASSENGERS AND CARGO TO FUEL MARKET
     12.5 >2,000 KG 
             12.5.1 DEMAND FOR INTRACITY TRANSPORTATION OF HEAVY CARGO TO DRIVE MARKET
 
13 EVTOL AIRCRAFT MARKET, BY RANGE (Page No. - 108)
     13.1 INTRODUCTION 
             FIGURE 30 >200 KM SEGMENT PROJECTED TO LEAD MARKET DURING FORECAST PERIOD
             TABLE 21 EVTOL AIRCRAFT MARKET, BY RANGE, 2020–2022 (USD MILLION)
             TABLE 22 MARKET, BY RANGE, 2023–2030 (USD MILLION)
     13.2 <=200 KM 
             13.2.1 INTRACITY TRAVEL USING URBAN AIR MOBILITY SERVICES TO DRIVE MARKET
     13.3 >200 KM 
             13.3.1 HIGHER BATTERY CAPACITY TO BOOST DEMAND
 
14 EVTOL AIRCRAFT MARKET, REGIONAL ANALYSIS (Page No. - 111)
     14.1 INTRODUCTION 
             FIGURE 31 EVTOL AIRCRAFT MARKET: REGIONAL SNAPSHOT
             TABLE 23 MARKET, BY REGION, 2020–2022 (USD MILLION)
             TABLE 24 MARKET, BY REGION, 2023–2030 (USD MILLION)
     14.2 NORTH AMERICA 
             FIGURE 32 NORTH AMERICA: EVTOL AIRCRAFT MARKET SNAPSHOT
             14.2.1 NORTH AMERICA: PESTLE ANALYSIS
                        TABLE 25 NORTH AMERICA: MARKET, BY COUNTRY, 2020–2022 (USD MILLION)
                        TABLE 26 NORTH AMERICA: MARKET, BY COUNTRY, 2023–2030 (USD MILLION)
                        TABLE 27 NORTH AMERICA: MARKET, BY LIFT TECHNOLOGY, 2020–2022 (USD MILLION)
                        TABLE 28 NORTH AMERICA: MARKET, BY LIFT TECHNOLOGY, 2023–2030 (USD MILLION)
                        TABLE 29 NORTH AMERICA: MARKET, BY PROPULSION TYPE, 2020–2022 (USD MILLION)
                        TABLE 30 NORTH AMERICA: MARKET, BY PROPULSION TYPE, 2023–2030 (USD MILLION)
             14.2.2 US
                        14.2.2.1 Presence of leading OEMs to drive market
                                     TABLE 31 US: EVTOL AIRCRAFT MARKET, BY LIFT TECHNOLOGY, 2020–2022 (USD MILLION)
                                     TABLE 32 US: MARKET, BY LIFT TECHNOLOGY, 2023–2030 (USD MILLION)
                                     TABLE 33 US: MARKET, BY PROPULSION TYPE, 2020–2022 (USD MILLION)
                                     TABLE 34 US: MARKET, BY PROPULSION TYPE, 2023–2030 (USD MILLION)
             14.2.3 CANADA
                        14.2.3.1 Aircraft modernization programs to boost market
                                     TABLE 35 CANADA: EVTOL AIRCRAFT MARKET, BY LIFT TECHNOLOGY, 2020–2022 (USD MILLION)
                                     TABLE 36 CANADA: MARKET, BY LIFT TECHNOLOGY, 2023–2030 (USD MILLION)
                                     TABLE 37 CANADA: MARKET, BY PROPULSION TYPE, 2020–2022 (USD MILLION)
                                     TABLE 38 CANADA: MARKET, BY PROPULSION TYPE, 2023–2030 (USD MILLION)
     14.3 EUROPE 
             FIGURE 33 EUROPE: EVTOL AIRCRAFT MARKET SNAPSHOT
             14.3.1 EUROPE: PESTLE ANALYSIS
                        TABLE 39 EUROPE: MARKET, BY COUNTRY, 2020–2022 (USD MILLION)
                        TABLE 40 EUROPE: MARKET, BY COUNTRY, 2023–2030 (USD MILLION)
                        TABLE 41 EUROPE: MARKET, BY LIFT TECHNOLOGY, 2020–2022 (USD MILLION)
                        TABLE 42 EUROPE: MARKET, BY LIFT TECHNOLOGY, 2023–2030 (USD MILLION)
                        TABLE 43 EUROPE: MARKET, BY PROPULSION TYPE, 2020–2022 (USD MILLION)
                        TABLE 44 EUROPE: MARKET, BY PROPULSION TYPE, 2023–2030 (USD MILLION)
             14.3.2 UK
                        14.3.2.1 Technological advancements in air travel to drive market
                                     TABLE 45 UK: EVTOL AIRCRAFT MARKET, BY LIFT TECHNOLOGY, 2020–2022 (USD MILLION)
                                     TABLE 46 UK: MARKET, BY LIFT TECHNOLOGY, 2023–2030 (USD MILLION)
                                     TABLE 47 UK: MARKET, BY PROPULSION TYPE, 2020–2022 (USD MILLION)
                                     TABLE 48 UK: MARKET, BY PROPULSION TYPE, 2023–2030 (USD MILLION)
             14.3.3 FRANCE
                        14.3.3.1 Significant investments in aviation industry to boost market
                                     TABLE 49 FRANCE: EVTOL AIRCRAFT MARKET, BY LIFT TECHNOLOGY, 2020–2022 (USD MILLION)
                                     TABLE 50 FRANCE: MARKET, BY LIFT TECHNOLOGY, 2023–2030 (USD MILLION)
                                     TABLE 51 FRANCE: MARKET, BY PROPULSION TYPE, 2020–2022 (USD MILLION)
                                     TABLE 52 FRANCE: MARKET, BY PROPULSION TYPE, 2023–2030 (USD MILLION)
             14.3.4 GERMANY
                        14.3.4.1 Rising investments in air travel and connectivity to fuel market
                                     TABLE 53 GERMANY: EVTOL AIRCRAFT MARKET, BY LIFT TECHNOLOGY, 2020–2022 (USD MILLION)
                                     TABLE 54 GERMANY: MARKET, BY LIFT TECHNOLOGY, 2023–2030 (USD MILLION)
                                     TABLE 55 GERMANY: MARKET, BY PROPULSION TYPE, 2020–2022 (USD MILLION)
                                     TABLE 56 GERMANY: MARKET, BY PROPULSION TYPE, 2023–2030 (USD MILLION)
             14.3.5 SWITZERLAND
                        14.3.5.1 Increasing development toward zero-carbon emission goal to fuel market
                                     TABLE 57 SWITZERLAND: EVTOL AIRCRAFT MARKET, BY LIFT TECHNOLOGY, 2020–2022 (USD MILLION)
                                     TABLE 58 SWITZERLAND: MARKET, BY LIFT TECHNOLOGY, 2023–2030 (USD MILLION)
                                     TABLE 59 SWITZERLAND: MARKET, BY PROPULSION TYPE, 2020–2022 (USD MILLION)
                                     TABLE 60 SWITZERLAND: MARKET, BY PROPULSION TYPE, 2023–2030 (USD MILLION)
             14.3.6 NETHERLANDS
                        14.3.6.1 Strategic partnerships in UAM ecosystem to boost market
                                     TABLE 61 NETHERLANDS: EVTOL AIRCRAFT MARKET, BY LIFT TECHNOLOGY, 2020–2022 (USD MILLION)
                                     TABLE 62 NETHERLANDS: MARKET, BY LIFT TECHNOLOGY, 2023–2030 (USD MILLION)
                                     TABLE 63 NETHERLANDS: MARKET, BY PROPULSION TYPE, 2020–2022 (USD MILLION)
                                     TABLE 64 NETHERLANDS: MARKET, BY PROPULSION TYPE, 2023–2030 (USD MILLION)
             14.3.7 REST OF EUROPE
                        14.3.7.1 Presence of leading manufacturers and need to reduce carbon footprint to drive market
                                     TABLE 65 REST OF EUROPE: EVTOL AIRCRAFT MARKET, BY LIFT TECHNOLOGY, 2020–2022 (USD MILLION)
                                     TABLE 66 REST OF EUROPE: MARKET, BY LIFT TECHNOLOGY, 2023–2030 (USD MILLION)
                                     TABLE 67 REST OF EUROPE: MARKET, BY PROPULSION TYPE, 2020–2022 (USD MILLION)
                                     TABLE 68 REST OF EUROPE: MARKET, BY PROPULSION TYPE, 2023–2030 (USD MILLION)
     14.4 MIDDLE EAST 
             FIGURE 34 MIDDLE EAST: EVTOL AIRCRAFT MARKET SNAPSHOT
             14.4.1 MIDDLE EAST: PESTLE ANALYSIS
                        TABLE 69 MIDDLE EAST: MARKET, BY COUNTRY, 2020–2022 (USD MILLION)
                        TABLE 70 MIDDLE EAST: MARKET, BY COUNTRY, 2023–2030 (USD MILLION)
                        TABLE 71 MIDDLE EAST: MARKET, BY LIFT TECHNOLOGY, 2020–2022 (USD MILLION)
                        TABLE 72 MIDDLE EAST: MARKET, BY LIFT TECHNOLOGY, 2023–2030 (USD MILLION)
                        TABLE 73 MIDDLE EAST: MARKET, BY PROPULSION TYPE, 2020–2022 (USD MILLION)
                        TABLE 74 MIDDLE EAST: MARKET, BY PROPULSION TYPE, 2023–2030 (USD MILLION)
             14.4.2 ISRAEL
                        14.4.2.1 Increased spending on R&D for UAVs for military and commercial applications to drive market
                                     TABLE 75 ISRAEL: EVTOL AIRCRAFT MARKET, BY LIFT TECHNOLOGY, 2020–2022 (USD MILLION)
                                     TABLE 76 ISRAEL: MARKET, BY LIFT TECHNOLOGY, 2023–2030 (USD MILLION)
                                     TABLE 77 ISRAEL: MARKET, BY PROPULSION TYPE, 2020–2022 (USD MILLION)
                                     TABLE 78 ISRAEL: MARKET, BY PROPULSION TYPE, 2023–2030 (USD MILLION)
             14.4.3 UAE
                        14.4.3.1 Increased focus on efficient urban air mobility ecosystem to boost market
                                     TABLE 79 UAE: EVTOL AIRCRAFT MARKET, BY LIFT TECHNOLOGY, 2020–2022 (USD MILLION)
                                     TABLE 80 UAE: MARKET, BY LIFT TECHNOLOGY, 2023–2030 (USD MILLION)
                                     TABLE 81 UAE: MARKET, BY PROPULSION TYPE, 2020–2022 (USD MILLION)
                                     TABLE 82 UAE: MARKET, BY PROPULSION TYPE, 2023–2030 (USD MILLION)
             14.4.4 SAUDI ARABIA
                        14.4.4.1 Increased investments in eVTOL technology to boost market
                                     TABLE 83 SAUDI ARABIA: EVTOL AIRCRAFT MARKET, BY LIFT TECHNOLOGY, 2020–2022 (USD MILLION)
                                     TABLE 84 SAUDI ARABIA: MARKET, BY LIFT TECHNOLOGY, 2023–2030 (USD MILLION)
                                     TABLE 85 SAUDI ARABIA: MARKET, BY PROPULSION TYPE, 2020–2022 (USD MILLION)
                                     TABLE 86 SAUDI ARABIA: MARKET, BY PROPULSION TYPE, 2023–2030 (USD MILLION)
             14.4.5 TURKEY
                        14.4.5.1 Increased spending on technologically advanced UAVs and eVTOL aircraft to boost market
                                     TABLE 87 TURKEY: EVTOL AIRCRAFT MARKET, BY LIFT TECHNOLOGY, 2020–2022 (USD MILLION)
                                     TABLE 88 TURKEY: MARKET, BY LIFT TECHNOLOGY, 2023–2030 (USD MILLION)
                                     TABLE 89 TURKEY: MARKET, BY PROPULSION TYPE, 2020–2022 (USD MILLION)
                                     TABLE 90 TURKEY: MARKET, BY PROPULSION TYPE, 2023–2030 (USD MILLION)
             14.4.6 REST OF MIDDLE EAST
                        14.4.6.1 Increasing military spending to fuel market
                                     TABLE 91 REST OF MIDDLE EAST: EVTOL AIRCRAFT MARKET, BY LIFT TECHNOLOGY, 2020–2022 (USD MILLION)
                                     TABLE 92 REST OF MIDDLE EAST: MARKET, BY LIFT TECHNOLOGY, 2023–2030 (USD MILLION)
                                     TABLE 93 REST OF MIDDLE EAST: MARKET, BY PROPULSION TYPE, 2020–2022 (USD MILLION)
                                     TABLE 94 REST OF MIDDLE EAST: MARKET, BY PROPULSION TYPE, 2023–2030 (USD MILLION)
     14.5 ASIA PACIFIC 
             FIGURE 35 ASIA PACIFIC: EVTOL AIRCRAFT MARKET SNAPSHOT
             14.5.1 ASIA PACIFIC: PESTLE ANALYSIS
                        TABLE 95 ASIA PACIFIC: MARKET, BY COUNTRY, 2020–2022 (USD MILLION)
                        TABLE 96 ASIA PACIFIC: MARKET, BY COUNTRY, 2023–2030 (USD MILLION)
                        TABLE 97 ASIA PACIFIC: MARKET, BY LIFT TECHNOLOGY, 2020–2022 (USD MILLION)
                        TABLE 98 ASIA PACIFIC: MARKET, BY LIFT TECHNOLOGY, 2023–2030 (USD MILLION)
                        TABLE 99 ASIA PACIFIC: MARKET, BY PROPULSION TYPE, 2020–2022 (USD MILLION)
                        TABLE 100 ASIA PACIFIC: MARKET, BY PROPULSION TYPE, 2023–2030 (USD MILLION)
             14.5.2 CHINA
                        14.5.2.1 Increasing domestic travel and air traffic to drive market
                                     TABLE 101 CHINA: EVTOL AIRCRAFT MARKET, BY LIFT TECHNOLOGY, 2020–2022 (USD MILLION)
                                     TABLE 102 CHINA: MARKET, BY LIFT TECHNOLOGY, 2023–2030 (USD MILLION)
                                     TABLE 103 CHINA: MARKET, BY PROPULSION TYPE, 2020–2022 (USD MILLION)
                                     TABLE 104 CHINA: MARKET, BY PROPULSION TYPE, 2023–2030 (USD MILLION)
             14.5.3 INDIA
                        14.5.3.1 Five-year modernization plan for armed forces to boost market
                                     TABLE 105 INDIA: EVTOL AIRCRAFT MARKET, BY LIFT TECHNOLOGY, 2020–2022 (USD MILLION)
                                     TABLE 106 INDIA: MARKET, BY LIFT TECHNOLOGY, 2023–2030 (USD MILLION)
                                     TABLE 107 INDIA: MARKET, BY PROPULSION TYPE, 2020–2022 (USD MILLION)
                                     TABLE 108 INDIA: MARKET, BY PROPULSION TYPE, 2023–2030 (USD MILLION)
             14.5.4 JAPAN
                        14.5.4.1 In-house development of eVTOL aircraft to drive market
                                     TABLE 109 JAPAN: EVTOL AIRCRAFT MARKET, BY LIFT TECHNOLOGY, 2020–2022 (USD MILLION)
                                     TABLE 110 JAPAN: MARKET, BY LIFT TECHNOLOGY, 2023–2030 (USD MILLION)
                                     TABLE 111 JAPAN: MARKET, BY PROPULSION TYPE, 2020–2022 (USD MILLION)
                                     TABLE 112 JAPAN: MARKET, BY PROPULSION TYPE, 2023–2030 (USD MILLION)
             14.5.5 AUSTRALIA
                        14.5.5.1 Increased air traffic and new aircraft deliveries to fuel market
                                     TABLE 113 AUSTRALIA: EVTOL AIRCRAFT MARKET, BY LIFT TECHNOLOGY, 2020–2022 (USD MILLION)
                                     TABLE 114 AUSTRALIA: MARKET, BY LIFT TECHNOLOGY, 2023–2030 (USD MILLION)
                                     TABLE 115 AUSTRALIA: MARKET, BY PROPULSION TYPE, 2020–2022 (USD MILLION)
                                     TABLE 116 AUSTRALIA: MARKET, BY PROPULSION TYPE, 2023–2030 (USD MILLION)
             14.5.6 SOUTH KOREA
                        14.5.6.1 Growing commercialization of urban taxis and fully autonomous UAM to drive market
                                     TABLE 117 SOUTH KOREA: EVTOL AIRCRAFT MARKET, BY LIFT TECHNOLOGY, 2020–2022 (USD MILLION)
                                     TABLE 118 SOUTH KOREA: MARKET, BY LIFT TECHNOLOGY, 2023–2030 (USD MILLION)
                                     TABLE 119 SOUTH KOREA: MARKET, BY PROPULSION TYPE, 2020–2022 (USD MILLION)
                                     TABLE 120 SOUTH KOREA: MARKET, BY PROPULSION TYPE, 2023–2030 (USD MILLION)
             14.5.7 REST OF ASIA PACIFIC
                        14.5.7.1 Increased UAM investment and military spending to drive market
                                     TABLE 121 REST OF ASIA PACIFIC: EVTOL AIRCRAFT MARKET, BY LIFT TECHNOLOGY, 2020–2022 (USD MILLION)
                                     TABLE 122 REST OF ASIA PACIFIC: MARKET, BY LIFT TECHNOLOGY, 2023–2030 (USD MILLION)
                                     TABLE 123 REST OF ASIA PACIFIC: MARKET, BY PROPULSION TYPE, 2020–2022 (USD MILLION)
                                     TABLE 124 REST OF ASIA PACIFIC: MARKET, BY PROPULSION TYPE, 2023–2030 (USD MILLION)
     14.6 LATIN AMERICA 
             FIGURE 36 LATIN AMERICA: EVTOL AIRCRAFT MARKET SNAPSHOT
             14.6.1 LATIN AMERICA: PESTLE ANALYSIS
                        TABLE 125 LATIN AMERICA: MARKET, BY COUNTRY, 2020–2022 (USD MILLION)
                        TABLE 126 LATIN AMERICA: MARKET, BY COUNTRY, 2023–2030 (USD MILLION)
                        TABLE 127 LATIN AMERICA: MARKET, BY LIFT TECHNOLOGY, 2020–2022 (USD MILLION)
                        TABLE 128 LATIN AMERICA: MARKET, BY LIFT TECHNOLOGY, 2023–2030 (USD MILLION)
                        TABLE 129 LATIN AMERICA: MARKET, BY PROPULSION TYPE, 2020–2022 (USD MILLION)
                        TABLE 130 LATIN AMERICA: MARKET, BY PROPULSION TYPE, 2023–2030 (USD MILLION)
             14.6.2 BRAZIL
                        14.6.2.1 Huge investments from manufacturing companies to drive market
                                     TABLE 131 BRAZIL: EVTOL AIRCRAFT MARKET, BY LIFT TECHNOLOGY, 2020–2022 (USD MILLION)
                                     TABLE 132 BRAZIL: MARKET, BY LIFT TECHNOLOGY, 2023–2030 (USD MILLION)
                                     TABLE 133 BRAZIL: MARKET, BY PROPULSION TYPE, 2020–2022 (USD MILLION)
                                     TABLE 134 BRAZIL: MARKET, BY PROPULSION TYPE, 2023–2030 (USD MILLION)
             14.6.3 MEXICO
                        14.6.3.1 Growing demand for urban air mobility to fuel market
                                     TABLE 135 MEXICO: EVTOL AIRCRAFT MARKET, BY LIFT TECHNOLOGY, 2020–2022 (USD MILLION)
                                     TABLE 136 MEXICO: MARKET, BY LIFT TECHNOLOGY, 2023–2030 (USD MILLION)
                                     TABLE 137 MEXICO: MARKET, BY PROPULSION TYPE, 2020–2022 (USD MILLION)
                                     TABLE 138 MEXICO: MARKET, BY PROPULSION TYPE, 2023–2030 (USD MILLION)
             14.6.4 REST OF LATIN AMERICA
                        14.6.4.1 Favorable government policies and regulatory developments to boost market
                                     TABLE 139 REST OF LATIN AMERICA: EVTOL AIRCRAFT MARKET, BY LIFT TECHNOLOGY, 2020–2022 (USD MILLION)
                                     TABLE 140 REST OF LATIN AMERICA: MARKET, BY LIFT TECHNOLOGY, 2023–2030 (USD MILLION)
                                     TABLE 141 REST OF LATIN AMERICA: MARKET, BY PROPULSION TYPE, 2020–2022 (USD MILLION)
                                     TABLE 142 REST OF LATIN AMERICA: MARKET, BY PROPULSION TYPE, 2023–2030 (USD MILLION)
     14.7 AFRICA 
             FIGURE 37 AFRICA: EVTOL AIRCRAFT MARKET SNAPSHOT
             TABLE 143 AFRICA: MARKET, BY LIFT TECHNOLOGY, 2020–2022 (USD MILLION)
             TABLE 144 AFRICA: MARKET, BY LIFT TECHNOLOGY, 2023–2030 (USD MILLION)
             TABLE 145 AFRICA: MARKET, BY PROPULSION TYPE, 2020–2022 (USD MILLION)
             TABLE 146 AFRICA: MARKET, BY PROPULSION TYPE, 2023–2030 (USD MILLION)
             14.7.1 SOUTH AFRICA
                        14.7.1.1 Government support and investment in infrastructure development to drive market
             14.7.2 NIGERIA
                        14.7.2.1 Growing demand for innovative mobility solutions to drive market
             14.7.3 REST OF AFRICA
                        14.7.3.1 Rising awareness and interest in sustainable mobility solutions to boost market
 
15 COMPETITIVE LANDSCAPE (Page No. - 163)
     15.1 INTRODUCTION 
     15.2 RANKING OF LEADING PLAYERS, 2023 
             FIGURE 38 MARKET RANKING OF LEADING PLAYERS IN EVTOL AIRCRAFT MARKET, 2023
     15.3 MARKET SHARE ANALYSIS, 2022 
             FIGURE 39 MARKET SHARE OF TOP PLAYERS IN EVTOL AIRCRAFT MARKET, 2022
             FIGURE 40 REVENUE ANALYSIS OF TOP 5 MARKET PLAYERS, 2022
     15.4 COMPETITIVE OVERVIEW 
             TABLE 147 KEY DEVELOPMENTS BY LEADING PLAYERS IN EVTOL AIRCRAFT MARKET (2021–2023)
     15.5 COMPANY PRODUCT FOOTPRINT ANALYSIS 
             TABLE 148 COMPANY FOOTPRINT
             TABLE 149 APPLICATION FOOTPRINT
             TABLE 150 RANGE FOOTPRINT
             TABLE 151 SYSTEM FOOTPRINT
             TABLE 152 REGIONAL FOOTPRINT
     15.6 COMPANY EVALUATION MATRIX 
             15.6.1 STARS
             15.6.2 EMERGING LEADERS
             15.6.3 PERVASIVE PLAYERS
             15.6.4 PARTICIPANTS
                        FIGURE 41 EVTOL AIRCRAFT MARKET: COMPANY EVALUATION MATRIX, 2023
     15.7 STARTUP/SME EVALUATION MATRIX 
             15.7.1 PROGRESSIVE COMPANIES
             15.7.2 RESPONSIVE COMPANIES
             15.7.3 DYNAMIC COMPANIES
             15.7.4 STARTING BLOCKS
                        FIGURE 42 EVTOL AIRCRAFT MARKET: STARTUP/SME EVALUATION MATRIX, 2023
             15.7.5 COMPETITIVE BENCHMARKING
                        TABLE 153 EVTOL AIRCRAFT MARKET: DETAILED LIST OF KEY STARTUP/SMES
     15.8 COMPETITIVE SCENARIO 
             15.8.1 DEALS
                        TABLE 154 EVTOL AIRCRAFT MARKET: DEALS, 2021–2023
             15.8.2 OTHER DEVELOPMENTS
                        TABLE 155 EVTOL AIRCRAFT MARKET: OTHER DEVELOPMENTS, 2021–2023
             15.8.3 PRODUCT LAUNCHES
 
16 COMPANY PROFILES (Page No. - 180)
(Business Overview, Products Offered, Recent Developments, MnM View Right to win, Strategic choices made, Weaknesses and competitive threats) *  
     16.1 KEY PLAYERS 
             16.1.1 AIRBUS SE
                        TABLE 156 AIRBUS SE: COMPANY OVERVIEW
                        FIGURE 43 AIRBUS SE: COMPANY SNAPSHOT
                        TABLE 157 AIRBUS SE: PRODUCTS OFFERED?
                        TABLE 158 AIRBUS SE: DEALS
             16.1.2 ELBIT SYSTEMS LTD.
                        TABLE 159 ELBIT SYSTEMS LTD.: COMPANY OVERVIEW
                        FIGURE 44 ELBIT SYSTEMS LTD.: COMPANY SNAPSHOT
                        TABLE 160 ELBIT SYSTEMS LTD.: PRODUCTS OFFERED?
                        TABLE 161 ELBIT SYSTEMS LTD.: DEALS
             16.1.3 BELL TEXTRON INC.
                        TABLE 162 BELL TEXTRON INC.: COMPANY OVERVIEW
                        FIGURE 45 BELL TEXTRON INC.: COMPANY SNAPSHOT
                        TABLE 163 BELL TEXTRON INC.: PRODUCTS OFFERED?
             16.1.4 EHANG HOLDINGS LTD.
                        TABLE 164 EHANG HOLDINGS LTD.: COMPANY OVERVIEW
                        FIGURE 46 EHANG HOLDINGS LTD.: COMPANY SNAPSHOT
                        TABLE 165 EHANG HOLDINGS LTD.: PRODUCTS OFFERED?
                        TABLE 166 EHANG HOLDINGS LTD.: DEALS
             16.1.5 EMBRAER SA
                        TABLE 167 EMBRAER SA: COMPANY OVERVIEW
                        FIGURE 47 EMBRAER SA: COMPANY SNAPSHOT
                        TABLE 168 EMBRAER SA: PRODUCTS OFFERED?
                        TABLE 169 EMBRAER SA: DEALS
             16.1.6 ISRAEL AEROSPACE INDUSTRIES
                        TABLE 170 ISRAEL AEROSPACE INDUSTRIES: COMPANY OVERVIEW
                        FIGURE 48 ISRAEL AEROSPACE INDUSTRIES: COMPANY SNAPSHOT
                        TABLE 171 ISRAEL AEROSPACE INDUSTRIES: PRODUCTS OFFERED?
             16.1.7 PIPISTREL
                        TABLE 172 PIPISTREL: COMPANY OVERVIEW
                        TABLE 173 PIPISTREL: PRODUCTS OFFERED?
                        TABLE 174 PIPISTREL: DEALS
             16.1.8 ELROY AIR
                        TABLE 175 ELROY AIR: COMPANY OVERVIEW
                        TABLE 176 ELROY AIR: PRODUCTS OFFERED?
                        TABLE 177 ELROY AIR: DEALS
             16.1.9 LILIUM GMBH
                        TABLE 178 LILIUM GMBH: COMPANY OVERVIEW
                        TABLE 179 LILIUM GMBH: PRODUCTS OFFERED?
                        TABLE 180 LILIUM GMBH: DEALS
             16.1.10 JOBY AVIATION, INC.
                        TABLE 181 JOBY AVIATION, INC.: COMPANY OVERVIEW
                        TABLE 182 JOBY AVIATION, INC.: PRODUCTS OFFERED?
                        TABLE 183 JOBY AVIATION, INC.: DEALS
             16.1.11 ARCHER AVIATION INC.
                        TABLE 184 ARCHER AVIATION INC.: COMPANY OVERVIEW
                        TABLE 185 ARCHER AVIATION INC.: PRODUCTS OFFERED?
                        TABLE 186 ARCHER AVIATION INC.: DEALS
             16.1.12 VOLOCOPTER GMBH
                        TABLE 187 VOLOCOPTER GMBH: COMPANY OVERVIEW
                        TABLE 188 VOLOCOPTER GMBH: PRODUCTS OFFERED?
                        TABLE 189 VOLOCOPTER GMBH: DEALS
             16.1.13 SZ DJI TECHNOLOGY CO., LTD.
                        TABLE 190 SZ DJI TECHNOLOGY CO., LTD.: COMPANY OVERVIEW
                        TABLE 191 SZ DJI TECHNOLOGY CO., LTD.: PRODUCTS OFFERED?
             16.1.14 SAMAD AEROSPACE
                        TABLE 192 SAMAD AEROSPACE: COMPANY OVERVIEW
                        TABLE 193 SAMAD AEROSPACE: PRODUCTS OFFERED?
             16.1.15 AURORA FLIGHT SCIENCES
                        TABLE 194 AURORA FLIGHT SCIENCES: COMPANY OVERVIEW
                        TABLE 195 AURORA FLIGHT SCIENCES: PRODUCTS OFFERED?
                        TABLE 196 AURORA FLIGHT SCIENCES: DEALS
             16.1.16 VERTICAL AEROSPACE GROUP LTD.
                        TABLE 197 VERTICAL AEROSPACE GROUP LTD.: COMPANY OVERVIEW
                        TABLE 198 VERTICAL AEROSPACE GROUP LTD.: PRODUCTS OFFERED?
                        TABLE 199 VERTICAL AEROSPACE GROUP LTD.: DEALS
             16.1.17 URBAN AERONAUTICS LTD.
                        TABLE 200 URBAN AERONAUTICS LTD.: COMPANY OVERVIEW
                        TABLE 201 URBAN AERONAUTICS LTD.: PRODUCTS OFFERED?
                        TABLE 202 URBAN AERONAUTICS LTD.: DEALS
     16.2 OTHER PLAYERS 
             16.2.1 JAUNT AIR MOBILITY
             16.2.2 OVERAIR
             16.2.3 BETA TECHNOLOGIES
             16.2.4 DELOREAN AEROSPACE
             16.2.5 SKYDRIVE INC.
             16.2.6 TERRAFUGIA
             16.2.7 WISK AERO LLC
             16.2.8 OPENER, INC.
*Details on Business Overview, Products Offered, Recent Developments, MnM View, Right to win, Strategic choices made, Weaknesses and competitive threats might not be captured in case of unlisted companies.  
 
17 APPENDIX (Page No. - 223)
     17.1 DISCUSSION GUIDE 
     17.2 KNOWLEDGESTORE: MARKETSANDMARKETS’ SUBSCRIPTION PORTAL 
     17.3 CUSTOMIZATION OPTIONS 
     17.4 RELATED REPORTS 
     17.5 AUTHOR DETAILS 


The study involved four major activities in estimating the current market size for the eVTOL Aircraft market. Exhaustive secondary research was conducted to collect information on the market, the peer markets, and the parent market. The next step was to validate these findings, assumptions, and sizing with industry experts across the value chain through primary research. Both top-down and bottom-up approaches were employed to estimate the complete market size. Thereafter, market breakdown and data triangulation procedures were used to estimate the market size of segments and subsegments.

Secondary Research

In the secondary research process, various secondary sources, such as D&B Hoovers, Bloomberg, BusinessWeek, Dow Jones Factiva, and different magazines, were referred to identify and collect information for this study. Secondary sources also included annual reports, press releases & investor presentations of companies, certified publications, articles by recognized authors, and simulator databases. Secondary sources referred for this research study included General Aviation Manufacturers Association (GAMA); International Air Transport Association (IATA) publications, corporate filings (such as annual reports, investor presentations, and financial statements); Federal Aviation Administration (FAA) and trade, business, and professional associations. Secondary data was collected and analyzed to arrive at the overall market size, which was further validated by primary respondents.

Primary Research

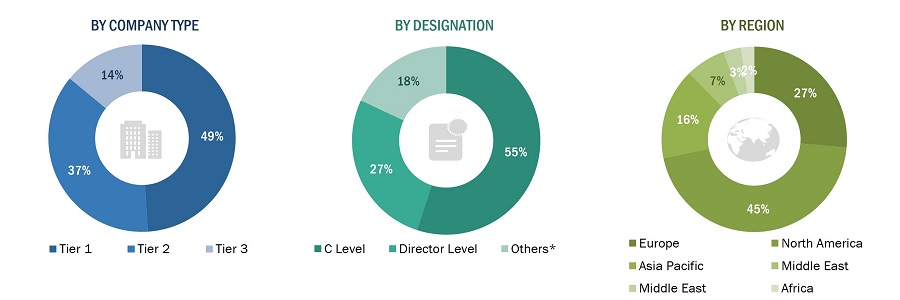
The eVTOL Aircraft Market comprises several stakeholders, such as raw material providers, eVTOL Aircraft manufacturers and suppliers, and regulatory organizations in the supply chain. While the demand side of this market is characterized by various end users, the supply side is characterized by technological advancements in sensors and wireless connected systems. Various primary sources from both the supply and demand sides of the market were interviewed to obtain qualitative and quantitative information. Following is the breakdown of primary respondents:
eVTOL  Aircraft Market Size, and Share

To know about the assumptions considered for the study, download the pdf brochure

Market Size Estimation

Both top-down and bottom-up approaches were used to estimate and validate the total size of the eVTOL  Aircraft market. These methods were also used extensively to estimate the size of various subsegments of the market. The research methodology used to estimate the market size includes the following:

  • Key players in the industry and markets were identified through extensive secondary research.
  • The industry’s supply chain and market size, in terms of value, were determined through primary and secondary research processes.
  • All percentage shares, splits, and breakdowns were determined using secondary sources and verified through primary sources.

Market size estimation methodology: Bottom-up Approach

The bottom-up approach was employed to arrive at the overall size of the eVTOL aircraft market from the revenues of key players and their shares in the market. Calculations based on the revenues of key players identified in the market led to the overall market size. The bottom-up approach was also implemented for data extracted from secondary research to validate the market segment revenues obtained. The market shares were then estimated for each company to verify the revenue shares used earlier in the bottom-up approach. With the data triangulation procedure and validation of data through primaries, the overall parent market size and each individual market size were determined and confirmed in this study.

eVTOL  Aircraft Market Size, and Bottom-up Approach

Market size estimation methodology: Top-down Approach

In the top-down approach, eVTOL aircraft manufacturers were identified, and their revenue specific to the eVTOL aircraft market was identified. The base market number for each player was arrived at by assigning a weightage to the eVTOL aircraft contracts received by the eVTOL manufacturers with respect to the application, range, and scope undertaken (for example, integration, design, manufacturing, and platform deployment).

eVTOL  Aircraft Market Size, and Top-down Approach

Data Triangulation

After arriving at the overall size of the eVTOL aircraft market from the estimation process explained above, the total market was split into several segments and subsegments. The data triangulation and market breakdown procedures explained below were implemented, wherever applicable, to complete the overall market engineering process and arrive at the exact statistics for various market segments and subsegments. The data was triangulated by studying various factors and trends. Along with this, the market size was validated using the top-down and bottom-up approaches.

In the bottom-up approach, the size of the eVTOL aircraft market was arrived at by calculating the regional-level data. In the top-down approach, the market size was derived by estimating the revenues of key companies operating in the market and validating the data acquired from primary research.

Report Objectives

  • To identify and analyze key drivers, restraints, challenges, and opportunities influencing the growth of the eVTOL Aircraftmarket
  • To analyze the impact of macro and micro indicators on the market
  • To forecast the market size of segments for five regions, namely, North America, Europe, Asia Pacific, Latin America, Middle East, and Africa. Along with major countries in each of these regions
  • To strategically analyze micro markets with respect to individual technological trends, prospects, and their contribution to the overall market
  • To strategically profile key market players and comprehensively analyze their market ranking and core competencies
  • To provide a detailed competitive landscape of the market, along with an analysis of business and corporate strategies, such as contracts, agreements, partnerships, and expansions.
  • To identify detailed financial positions, key products, unique selling points, and key developments of leading companies in the market

Available Customizations

Along with the market data, MarketsandMarkets offers customizations as per the specific needs of companies. The following customization options are available for the report:

Product Analysis

  • Product matrix, which gives a detailed comparison of the product portfolio of each company

Regional Analysis

  • Further breakdown of the market segments at country-level

Company Information

  • Detailed analysis and profiling of additional market players (up to 6)
Custom Market Research Services

We will customize the research for you, in case the report listed above does not meet with your exact requirements. Our custom research will comprehensively cover the business information you require to help you arrive at strategic and profitable business decisions.

Request Customization

Instant Answers with GPT - Ask Now!

Ask real questions. Get complete answers !
Report Code
AS 6984
Published ON
Jul, 2023
Choose License Type
BUY NOW
  • SHARE
X
Request Customization
Speak to Analyst
Speak to Analyst
OR FACE-TO-FACE MEETING
PERSONALIZE THIS RESEARCH
  • Triangulate with your Own Data
  • Get Data as per your Format and Definition
  • Gain a Deeper Dive on a Specific Application, Geography, Customer or Competitor
  • Any level of Personalization
REQUEST A FREE CUSTOMIZATION
LET US HELP YOU!
  • What are the Known and Unknown Adjacencies Impacting the eVTOL Aircraft Market
  • What will your New Revenue Sources be?
  • Who will be your Top Customer; what will make them switch?
  • Defend your Market Share or Win Competitors
  • Get a Scorecard for Target Partners
CUSTOMIZED WORKSHOP REQUEST
  • Call Us
  • +1-888-600-6441 (Corporate office hours)
  • +1-888-600-6441 (US/Can toll free)
  • +44-800-368-9399 (UK office hours)
CONNECT WITH US
ABOUT TRUST ONLINE
©2024 MarketsandMarkets Research Private Ltd. All rights reserved
DMCA.com Protection Status
Website Feedback