Exposure Management Market

Exposure Management Market by Component (Solutions and Services), Deployment Mode (Cloud and On-premises), Application (Vulnerability Management, Threat Intelligence, Attack Surface Management), End-user Industry and Region - Global Forecast to 2029

Report Code: TC 8973 Mar, 2024, by marketsandmarkets.com

[269 Pages Report] The global Exposure Management market size is projected to grow from USD 2.2 billion in 2024 to USD 7.6 billion by 2029 at a CAGR of 28.3% during the forecast period.   
The escalating frequency and sophistication of cyber threats heightened regulatory compliance demands for data protection, and the growing adoption of digital technologies like cloud computing and the IoT drive the exposure management market. Additionally, increasing awareness of exposure management risks among businesses and consumers and the need for robust protection in the face of expanding remote work and digital transactions significantly fuel the market's growth.

The exposure management market is witnessing significant opportunities, driven by the rising demand for advanced security solutions due to the increasing incidence of cyberattacks. Opportunities are emerging in areas like AI and ML for threat detection and response and cloud security services due to the shift towards cloud computing and IoT devices. The market is also seeing growth in MSS and the need for skilled professionals, offering substantial prospects for service providers and job seekers in the exposure management field.

Exposure Management Market

To know about the assumptions considered for the study, Request for Free Sample Report

Exposure Management Market Opportunities

To know about the assumptions considered for the study, download the pdf brochure

The Exposure Management market is showing resilience in the face of economic downturns. Despite general budget constraints, cybersecurity remains a growing business priority due to the ongoing cyber talent shortage and increasing cyber threats. Companies continue to recognize the critical importance of security, keeping it high on their agenda. However, security professionals must be flexible in their roles and locations, as the job market could see an influx of professionals from other fields due to declining job security in their previous positions.

Regarding budget, exposure management might see some constraints, but the demand for cloud-based security services and AI and ML technologies is expected to rise. These technologies help automate repetitive tasks and increase efficiency, vital during staff shortages and budget cuts. The overall outlook suggests that while no field is entirely immune to economic downturns, exposure management and cybersecurity are relatively recession-proof due to their critical nature and the ongoing demand for skilled professionals.

Exposure Management Market Dynamics

Driver: Increased target-based attacks to draw operational disruptions

The growth of the exposure management market is primarily driven by the increasing sophistication and frequency of cyber-attacks, which have escalated significantly over the past decade. The rise in cybercrimes, including targeted attacks on networks, endpoints, and cloud-based applications, has led to substantial business disruptions and losses. For instance, in 2022, there was a 41.5% increase in the number of individuals affected by data breaches, reaching over 422 million. These attacks often aim to steal critical and sensitive information, causing significant damage to businesses regarding operational disruption, financial loss, and the compromise of sensitive customer data. The growing threat landscape has prompted businesses globally to invest more in advanced information security technologies to bolster their security infrastructures. Cyber espionage groups like Dragonfly, Thrip, and Chafer, known for targeted cyber-attacks on various sectors, including aviation, defense, and telecom, exemplify the advanced nature of these threats. The need to defend against such sophisticated attacks is a key factor driving organizations worldwide to adopt comprehensive exposure management solutions.

Restraint: Integration, compatibility issues, and user-friendliness

A major restraint in the exposure management market stems from the intricate issues of integrating new exposure management solutions with existing cybersecurity frameworks. Many organizations rely on various security tools and systems designed with specific functionalities and compatibility requirements. Such heterogeneity often leads to issues when integrating new exposure management solutions, hindering their effective implementation. Such integration issues create security gaps and decrease the efficiency in detecting and addressing potential exposures.

Additionally, many advanced exposure management tools' complexity and ease of use present further restraints. Despite their potential to comprehensively protect digital assets, the complexity of these tools can involve a significant learning curve, making them easier for security teams to adopt and effectively use with extensive training. The lack of intuitiveness and user-friendly interfaces in some solutions may result in their underutilization or incorrect application, undermining the effectiveness of sophisticated exposure management strategies. The intertwined issues of integration, compatibility, and user-friendliness represent a substantial restraint for organizations aiming to improve their cybersecurity defenses.

Opportunity: Advancing exposure management through education and certification programs

The exposure management market is transforming quickly due to the escalating complexity of global business landscapes, technological advancements, and increased regulatory scrutiny. In response to these, there is a growing need for professionals adept in navigating exposure management's complexities, creating a prime opportunity for both organizations and educational institutions to bridge the critical skills gap by offering targeted educational programs and certifications in exposure management.

Developing these educational initiatives is crucial in cultivating a well-rounded workforce in both the theoretical foundations and practical applications of exposure management. Such programs encompass a broad spectrum of subjects, including risk identification and assessment, mitigation tactics, compliance with regulations, and applying technological tools in managing exposures. A curriculum blending academic depth with practical relevance equips learners with a comprehensive understanding of the field, enabling them to lead in the implementation of sophisticated exposure management strategies.

Moreover, certification programs serve a dual purpose. For individuals, they provide a verifiable testament to their expertise, enhancing their employability and career progression prospects. For organizations, employing certified professionals enhances their reputation and trust with various stakeholders, such as customers, regulatory bodies, and investors, possibly opening up new business avenues. On a larger scale, fostering a well-educated and skilled professional community significantly raises the bar for exposure management practices across sectors, contributing to more robust businesses and economies.

Challenge:Deployment and implementation challenges

Implementing exposure management solutions within new and existing infrastructures poses significant challenges, necessitating a departure from traditional, perimeter-centric security approaches towards models prioritizing users and applications. This transition demands extensive redesign and redeployment efforts, especially for web and mobile applications, as most networks were not originally conceived with exposure management as a priority. Moving to an exposure management framework involves thoroughly analyzing the network to precisely identify all users, devices, applications, and resources. Furthermore, adopting exposure management strategies must go beyond just providing role-based access and analytics; it also needs to tackle the susceptibility of resources to various threats, such as human error and system misconfigurations.

Exposure Management Market Ecosystem

Top Companies in Exposure Management Market

By deployment mode, the cloud segment accounts for the highest CAGR during the forecast period.

The cloud deployment mode is poised to account for the highest CAGR in the exposure management market, primarily due to its scalability, cost-effectiveness, and flexibility. The cloud deployment model allows organizations to adapt quickly to changing security needs without the upfront costs associated with traditional on-premises infrastructure. The cloud's inherent capacity for rapid deployment and easy updates ensures exposure management solutions remain at the forefront of cybersecurity technology, equipped with the latest updates and threat intelligence. Moreover, the shift towards remote work and digital transformation initiatives across industries has underscored the need for accessible, scalable security solutions protecting assets regardless of location. Cloud deployment meets these requirements by allowing organizations to manage and mitigate exposures efficiently across distributed environments, making it an increasingly preferred option for businesses seeking to enhance their cybersecurity posture in a dynamic threat landscape.

By application, the attack surface management segment accounts for the largest market size during the forecast period.

The attack surface management accounts for the largest market size in the exposure management market segmented by application due to the escalating complexity of digital ecosystems and the proliferation of endpoints resulting from widespread digital transformation initiatives. As organizations increasingly adopt cloud technologies, IoT devices, and mobile solutions, their attack surfaces represent all the points where an unauthorized user could enter or extract data and expand dramatically. The rapid expansion necessitates a comprehensive approach to identify, assess, and mitigate vulnerabilities across an ever-widening array of assets. Attack surface management solutions offer holistic visibility, enabling organizations to manage and secure their digital footprints against potential breaches proactively. The critical need to safeguard sensitive data and maintain operational continuity amidst rising cyber threats has made attack surface management an essential component of modern cybersecurity strategies, driving its dominance in market size within the exposure management market.

By region, North America accounts for the largest market size during the forecast period.

The North American region is anticipated to have the largest market size in the exposure management market. North America has many leading exposure management companies and technology giants, particularly in the US. The concentration of technology firms results in a higher adoption rate of exposure management solutions. Moreover, the region faces many cyber threats and attacks, necessitating robust exposure management measures. As a result, both private and public sectors invest heavily in advanced cybersecurity solutions. Additionally, North America has stringent data protection and privacy regulatory requirements, such as the GDPR and the CCPA. Compliance with these regulations drives the demand for exposure management solutions. The combination of a technologically advanced landscape, regulatory pressures, high incidence of cyber threats, and significant investment in exposure management solutions positions North America as a global market leader.

North American Exposure Management Market Size, and Share

Key Market Players

Some of the well-established and key market players in the exposure management market include Tenable (US), CrowdStrike (US), Palo Alto Networks (US), Forescout (US), EY (UK), VIAVI (US), Verisk (US), IBM (US), eSentire (Canada), Mandiant (US), CyCognito (US), Censys (US), XM Cyber (Israel), Cymulate (Israel), Skybox Security (US), Armis (US), Picus Security (US), Adarma (Scotland),  IONIX (Israel), Outpost24 (Sweden), ResilientX (UK), Ridge Security (US), Redhunt Labs (UK), Brandefense (US), and Risk Profiler (US).

Get online access to the report on the World's First Market Intelligence Cloud

  • Easy to Download Historical Data & Forecast Numbers
  • Company Analysis Dashboard for high growth potential opportunities
  • Research Analyst Access for customization & queries
  • Competitor Analysis with Interactive dashboard
  • Latest News, Updates & Trend analysis
Request Sample

Scope of the Report

Report Metrics

Details

Market size available for years

  • 2021-2029

Base year considered

  • 2023

Forecast period

  • 2024–2029

Forecast units

  • Value (USD Million/Billion)

Segments Covered

  • Component, Deployment Mode, Application, End-User Industry, and Region

Geographies covered

  • North America, Europe, Asia Pacific, Middle East and Africa, and Latin America

Companies covered

  • Major vendors in the global exposure management market include Tenable (US), CrowdStrike (US), Palo Alto Networks (US), Forescout (US), EY (UK), VIAVI (US), Verisk (US), IBM (US), eSentire (Canada), Mandiant (US), CyCognito (US), Censys (US), XM Cyber (Israel), Cymulate (Israel), Skybox Security (US), Armis (US), Picus Security (US), Adarma (Scotland),  IONIX (Israel), Outpost24 (Sweden), ResilientX (UK), Ridge Security (US), Redhunt Labs (UK), Brandefense (US), and Risk Profiler (US).   

Exposure Management Market Scope Region

The study categorizes the exposure management market based on Component, Deployment Mode, Application, End-User Industry, and Region.

By Component
  • Solution
  • Services
By Deployment Mode
  • On-premises
  • Cloud
By Application
  • Vulnerability Management
  • Threat Intelligence
  • Penetration Testing
  • Attack Surface management
  • Assets Management
  • Other Applications
By End-User Industry
  • BFSI
  • Healthcare
  • Retail and eCommerce
  • Government
  • Energy and Utilities
  • IT and ITeS
  • Others
By Region
  • North America
  • Europe
  • Asia Pacific
  • Middle East & Africa
  • Latin America

Recent Developments

  • In January 2024, VIAVI enhanced its Observer Platform, introducing significant enhancements targeting exposure management, notably through enhanced application recognition and digital certificate analysis. These features aim to mitigate security risks by enabling precise application detection and proactive management of digital certificates, thus safeguarding networks against compliance issues and security threats.
  • In October 2023, Forescout partnered with Secior. The partnership aims to enhance their customers' cybersecurity by offering advantages such as real-time visibility, risk management, continuous threat monitoring, and NIS2 compliance services across various enterprise environments, including campus, data center, remote workforce, cloud, mobile, IoT, OT, and IoT endpoints. 
  • In August 2023, Tenable introduced a new solution, ExposureAI, featuring generative AI capabilities and services integrated into the Tenable One Exposure Management Platform. Tenable Exposure Graph, a scalable data lake powered by Snowflake, has also been introduced and designed to fuel the ExposureAI engine. With a unified data platform representing over one trillion unique exposures, IT assets, and security findings across various environments, Tenable aims to make exposure management more accessible and efficient by turning all analysts into expert defenders.
  • In April 2023, Palo Alto Networks and Accenture announced a collaboration to deliver SASE solutions powered by Palo Alto Networks' AI-powered Prisma SASE. This initiative aims to enhance cyber resilience and support business transformation by addressing complexities in IT environments and ensuring business resilience.
  • In March 2022, Verisk acquired Opta to reshape risk management by integrating Opta into Verisk’s insurance ecosystem, which offers solutions across rating, underwriting, policy administration, claims, exposure management, and reinsurance. It aligns with Verisk’s strategy to expand its market reach and leverage complementary technologies to improve decision-making and operational efficiency for insurers and financial services companies.

Frequently Asked Questions (FAQ):

To speak to our analyst for a discussion on the above findings, click Speak to Analyst

TABLE OF CONTENTS
 
1 INTRODUCTION (Page No. - 24)
    1.1 STUDY OBJECTIVES 
    1.2 MARKET DEFINITION 
           1.2.1 INCLUSIONS AND EXCLUSIONS
    1.3 STUDY SCOPE 
           1.3.1 EXPOSURE MANAGEMENT MARKET SEGMENTATION
           1.3.2 REGIONS COVERED
    1.4 YEARS CONSIDERED 
    1.5 CURRENCY CONSIDERED 
           TABLE 1 USD EXCHANGE RATES, 2019–2023
    1.6 STAKEHOLDERS 
    1.7 IMPACT OF RECESSION 
 
2 RESEARCH METHODOLOGY (Page No. - 29)
    2.1 RESEARCH DATA 
           FIGURE 1 MARKET: RESEARCH DESIGN
           2.1.1 SECONDARY DATA
           2.1.2 PRIMARY DATA
                    2.1.2.1 Breakdown of primary profiles
                               FIGURE 2 BREAKDOWN OF PRIMARY INTERVIEWS: BY COMPANY TYPE, DESIGNATION, AND REGION
                    2.1.2.2 Key insights from industry experts
    2.2 DATA TRIANGULATION 
           FIGURE 3 MARKET: DATA TRIANGULATION
           FIGURE 4 EXPOSURE MANAGEMENT MARKET ESTIMATION: RESEARCH FLOW
    2.3 MARKET SIZE ESTIMATION 
           2.3.1 REVENUE ESTIMATES
                    2.3.1.1 Top-down Approach
                               FIGURE 5 APPROACH 1 (SUPPLY-SIDE): REVENUE FROM HARDWARE, SOFTWARE SOLUTIONS AND SERVICES OF EXPOSURE MANAGEMENT VENDORS
                               FIGURE 6 APPROACH 1 (SUPPLY-SIDE) ANALYSIS
                    2.3.1.2 Bottom-up Approach
                               FIGURE 7 APPROACH 2: BOTTOM-UP (DEMAND-SIDE): EXPOSURE MANAGEMENT MARKET
    2.4 MARKET FORECAST 
                    TABLE 2 FACTOR ANALYSIS
    2.5 RECESSION IMPACT AND ASSUMPTIONS 
           2.5.1 RECESSION IMPACT
           2.5.2 ASSUMPTIONS
    2.6 LIMITATIONS 
           FIGURE 8 STUDY LIMITATIONS
 
3 EXECUTIVE SUMMARY (Page No. - 40)
    TABLE 3 EXPOSURE MANAGEMENT MARKET AND GROWTH RATE, 2024–2029 (USD MILLION, Y-O-Y) 
    FIGURE 9 GLOBAL MARKET SIZE AND Y-O-Y GROWTH RATE 
    FIGURE 10 MARKET SHARE OF SEGMENTS WITH HIGH GROWTH RATES DURING FORECAST PERIOD 
    FIGURE 11 NORTH AMERICA TO ACCOUNT FOR LARGEST MARKET SHARE IN 2023 
 
4 PREMIUM INSIGHTS (Page No. - 44)
    4.1 ATTRACTIVE OPPORTUNITIES FOR MARKET PLAYERS 
           FIGURE 12 GROWTH IN DIGITALIZATION AND CLOUD ADOPTION, REGULATORY COMPLIANCE AND DATA PROTECTION LAWS, AND GROWING AWARENESS OF CYBERSECURITY HYGIENE TO BOOST MARKET GROWTH
    4.2 EXPOSURE MANAGEMENT MARKET, BY COMPONENT 
           FIGURE 13 SOLUTIONS SEGMENT TO ACCOUNT FOR LARGER MARKET DURING FORECAST PERIOD
    4.3 MARKET, BY DEPLOYMENT MODE 
           FIGURE 14 CLOUD SEGMENT TO ACCOUNT FOR LARGER MARKET DURING FORECAST PERIOD
    4.4 MARKET, BY APPLICATION 
           FIGURE 15 ATTACK SURFACE MANAGEMENT TO HAVE HIGHEST CAGR DURING FORECAST PERIOD
    4.5 MARKET, BY END-USE INDUSTRY 
           FIGURE 16 BFSI INDUSTRY TO ACCOUNT FOR LARGEST MARKET DURING FORECAST PERIOD
    4.6 MARKET INVESTMENT SCENARIO 
           FIGURE 17 ASIA PACIFIC TO EMERGE AS BEST MARKET FOR INVESTMENTS IN NEXT FIVE YEARS
 
5 EXPOSURE MANAGEMENT MARKET OVERVIEW AND INDUSTRY TRENDS (Page No. - 48)
    5.1 INTRODUCTION 
    5.2 MARKET DYNAMICS 
           FIGURE 18 MARKET: DRIVERS, RESTRAINTS, OPPORTUNITIES, AND CHALLENGES
           5.2.1 DRIVERS
                    5.2.1.1 Rising cybersecurity threats and targeted attacks
                    5.2.1.2 Growth in digitalization and cloud adoption
                    5.2.1.3 Regulatory compliance and data protection laws
                    5.2.1.4 Growing awareness of cybersecurity hygiene
           5.2.2 RESTRAINTS
                    5.2.2.1 Integration, compatibility issues, and user-friendliness
                    5.2.2.2 Financial and talent barriers in deploying exposure management solutions
           5.2.3 OPPORTUNITIES
                    5.2.3.1 Enhancing security with AI, ML, and automation in exposure management
                    5.2.3.2 Elevating exposure management through comprehensive education and certification programs
           5.2.4 CHALLENGES
                    5.2.4.1 Deploying and implementing exposure management solutions
                    5.2.4.2 Complexities of vendor overload and diversity of technologies
                    5.2.4.3 Difficulties in addressing intricacies of advanced threats
    5.3 CASE STUDY ANALYSIS 
           5.3.1 CYMULATE BOLSTERED EXPOSURE MANAGEMENT FOR PREMIER BRAZILIAN INSURER WITH IN-DEPTH SECURITY VALIDATION
           5.3.2 AMOUN PHARMACEUTICAL ADVANCED PROACTIVE SECURITY WITH PICUS SECURITY'S COMPREHENSIVE VALIDATION PLATFORM
           5.3.3 AXONIUS’ CYBERSECURITY ASSET MANAGEMENT HELPED SAFEBREACH ENHANCE ITS OVERALL SECURITY PROGRAM
           5.3.4 CENSYS ASSISTED SWISS LIFE IN ACHIEVING COMPREHENSIVE ASSET VISIBILITY AND ENHANCED CYBERSECURITY MANAGEMENT
           5.3.5 RIDGE SECURITY ENHANCED CYBER RESILIENCE FOR MAJOR TELECOM COMPANY WITH AUTOMATED PENETRATION TESTING
    5.4 VALUE CHAIN ANALYSIS 
           FIGURE 19 EXPOSURE MANAGEMENT MARKET: VALUE CHAIN ANALYSIS
           5.4.1 COMPONENT PROVIDERS
           5.4.2 PLANNING AND DESIGNING
           5.4.3 INFRASTRUCTURE DEPLOYMENT
           5.4.4 SYSTEM INTEGRATION
           5.4.5 END-USER VERTICALS
    5.5 ECOSYSTEM/MARKET MAP 
           FIGURE 20 KEY PLAYERS IN MARKET ECOSYSTEM
           TABLE 4 EXPOSURE MANAGEMENT MARKET: ECOSYSTEM
    5.6 PORTER’S FIVE FORCES ANALYSIS 
           FIGURE 21 PORTER’S FIVE FORCES ANALYSIS: MARKET
           TABLE 5 PORTER’S FIVE FORCES’ IMPACT ON MARKET
           5.6.1 THREAT OF NEW ENTRANTS
           5.6.2 BARGAINING POWER OF SUPPLIERS
           5.6.3 BARGAINING POWER OF BUYERS
           5.6.4 THREAT OF SUBSTITUTES
           5.6.5 INTENSITY OF COMPETITIVE RIVALRY
    5.7 PRICING ANALYSIS 
           5.7.1 AVERAGE SELLING PRICE TRENDS OF KEY PLAYERS, BY COMPONENT
                    FIGURE 22 AVERAGE SELLING PRICE TRENDS OF KEY PLAYERS, BY COMPONENT
                    TABLE 6 AVERAGE SELLING PRICE TRENDS OF KEY PLAYERS, BY COMPONENT
           5.7.2 INDICATIVE PRICING ANALYSIS, BY SOLUTION
                    TABLE 7 INDICATIVE PRICING LEVELS OF EXPOSURE MANAGEMENT SOLUTIONS
    5.8 TECHNOLOGY ANALYSIS 
           5.8.1 KEY TECHNOLOGIES
                    5.8.1.1 AI and ML
                               5.8.1.1.1 Generative AI
           5.8.2 COMPLEMENTARY TECHNOLOGIES
                    5.8.2.1 Cloud Computing
                    5.8.2.2 Big data and analytics
           5.8.3 ADJACENT TECHNOLOGIES
                    5.8.3.1 Blockchain
                    5.8.3.2 IoT
                    5.8.3.3 Quantum Computing
    5.9 PATENT ANALYSIS 
           FIGURE 23 PATENTS GRANTED FOR EXPOSURE MANAGEMENT, 2013–2023
           FIGURE 24 REGIONAL ANALYSIS OF PATENTS GRANTED FOR MARKET
           5.9.1 LIST OF MAJOR PATENTS
    5.10 TRENDS/DISRUPTIONS IMPACTING BUYERS 
           FIGURE 25 EXPOSURE MANAGEMENT MARKET: TRENDS/DISRUPTIONS IMPACTING CUSTOMERS’ BUSINESSES
    5.11 REGULATORY LANDSCAPE 
           5.11.1 REGULATORY BODIES, GOVERNMENT AGENCIES, AND OTHER ORGANIZATIONS
                    TABLE 8 NORTH AMERICA: LIST OF REGULATORY BODIES, GOVERNMENT AGENCIES, AND OTHER ORGANIZATIONS
                    TABLE 9 EUROPE: LIST OF REGULATORY BODIES, GOVERNMENT AGENCIES, AND OTHER ORGANIZATIONS
                    TABLE 10 ASIA PACIFIC: LIST OF REGULATORY BODIES, GOVERNMENT AGENCIES, AND OTHER ORGANIZATIONS
                    TABLE 11 MIDDLE EAST & AFRICA: LIST OF REGULATORY BODIES, GOVERNMENT AGENCIES, AND OTHER ORGANIZATIONS
                    TABLE 12 LATIN AMERICA: LIST OF REGULATORY BODIES, GOVERNMENT AGENCIES, AND OTHER ORGANIZATIONS
    5.12 KEY STAKEHOLDERS AND BUYING CRITERIA 
           5.12.1 KEY STAKEHOLDERS ON BUYING PROCESS
                    FIGURE 26 INFLUENCE OF STAKEHOLDERS ON BUYING PROCESS FOR TOP THREE APPLICATIONS
                    TABLE 13 INFLUENCE OF STAKEHOLDERS ON BUYING PROCESS FOR TOP THREE APPLICATIONS
           5.12.2 BUYING CRITERIA
                    FIGURE 27 KEY BUYING CRITERIA FOR KEY APPLICATIONS
                    TABLE 14 KEY BUYING CRITERIA FOR TOP APPLICATIONS
    5.13 KEY CONFERENCES & EVENTS 
                    TABLE 15 EXPOSURE MANAGEMENT MARKET: DETAILED LIST OF CONFERENCES AND EVENTS, 2024
    5.14 INVESTMENT & FUNDING SCENARIO 
                    FIGURE 28 LEADING GLOBAL EXPOSURE MANAGEMENT STARTUPS/SMES, BY NUMBER OF INVESTORS AND FUNDING ROUNDS
    5.15 EXPOSURE MANAGEMENT LIFECYCLE 
                    FIGURE 29 FOUR-PHASE APPROACH TO STRATEGIC EXPOSURE MANAGEMENT
                    FIGURE 30 ORGANIZATIONS’ POTENTIAL EXPOSURE AREAS
    5.16 CONTINUOUS THREAT EXPOSURE MANAGEMENT AND EXPOSURE MANAGEMENT: STRATEGIC OVERVIEW 
           5.16.1 FIVE-STEP BLUEPRINT FOR EFFECTIVE CONTINUOUS THREAT EXPOSURE MANAGEMENT IMPLEMENTATION
                    FIGURE 31 FIVE-STEP CYCLE OF CONTINUOUS THREAT EXPOSURE MANAGEMENT
                    5.16.1.1 Comprehensive scoping for cybersecurity exposure
                    5.16.1.2 Asset discovery and risk profiling
                    5.16.1.3 Prioritizing threats for efficient resource allocation
                    5.16.1.4 Attack validation and response planning
                    5.16.1.5 Mobilizing people and processes for CTEM
 
6 EXPOSURE MANAGEMENT MARKET, BY COMPONENT (Page No. - 89)
    6.1 INTRODUCTION 
           6.1.1 COMPONENT: MARKET DRIVERS
                    FIGURE 32 EXPOSURE MANAGEMENT SOLUTIONS TO LEAD MARKET DURING FORECAST PERIOD
                    TABLE 16 MARKET, BY COMPONENT, 2021–2029 (USD MILLION)
    6.2 SOLUTIONS 
           6.2.1 ANALYTICAL SOLUTIONS AND CYBERSECURITY INSIGHTS TO ASSESS AND MANAGE EXPOSURES
                    TABLE 17 EXPOSURE MANAGEMENT SOLUTIONS MARKET, BY REGION, 2021–2029 (USD MILLION)
    6.3 SERVICES 
           6.3.1 EXPERTISE AND SUPPORT SERVICES ENHANCE MARKET THROUGH IMPLEMENTATION, OPTIMIZATION, AND MANAGED SOLUTIONS
                    TABLE 18 EXPOSURE MANAGEMENT SERVICES MARKET, BY REGION, 2021–2029 (USD MILLION)
 
7 EXPOSURE MANAGEMENT MARKET, BY DEPLOYMENT MODE (Page No. - 94)
    7.1 INTRODUCTION 
           7.1.1 DEPLOYMENT MODE: MARKET DRIVERS
                    FIGURE 33 CLOUD DEPLOYMENT OF EXPOSURE MANAGEMENT SOLUTIONS AND SERVICES TO LEAD MARKET DURING FORECAST PERIOD
                    TABLE 19 MARKET, BY DEPLOYMENT MODE, 2021–2029 (USD MILLION)
    7.2 CLOUD 
           7.2.1 SCALABILITY, FLEXIBILITY, AND COST-EFFICIENCY OF CLOUD SOLUTIONS
                    TABLE 20 CLOUD-BASED MARKET, BY REGION, 2021–2029 (USD MILLION)
    7.3 ON-PREMISES 
           7.3.1 TIGHTER INTEGRATION WITH EXISTING INFRASTRUCTURE AND MORE GRANULAR CONTROL OVER SECURITY DATA
                    TABLE 21 ON-PREMISE MARKET, BY REGION, 2021–2029 (USD MILLION)
 
8 EXPOSURE MANAGEMENT MARKET, BY APPLICATION (Page No. - 98)
    8.1 INTRODUCTION 
           8.1.1 APPLICATION: MARKET DRIVERS
                    FIGURE 34 ATTACK SURFACE MANAGEMENT TO WITNESS FASTER GROWTH DURING FORECAST PERIOD
                    TABLE 22 MARKET, BY APPLICATION, 2021–2029 (USD MILLION)
    8.2 VULNERABILITY MANAGEMENT 
           8.2.1 NEED FOR ADVANCED DETECTION OF SECURITY GAPS AND PRIORITIZATION OF RISKS
                    TABLE 23 MARKET IN VULNERABILITY MANAGEMENT, BY REGION, 2021–2029 (USD MILLION)
    8.3 THREAT INTELLIGENCE 
           8.3.1 PLATFORMS FOR ACTIONABLE INSIGHTS AND ADVANCED THREAT DETECTION
                    TABLE 24 MARKET IN THREAT INTELLIGENCE, BY REGION, 2021–2029 (USD MILLION)
    8.4 PENETRATION TESTING 
           8.4.1 PROACTIVE VULNERABILITY IDENTIFICATION AND SECURITY ENHANCEMENT MEASURES
                    TABLE 25 MARKET IN PENETRATION TESTING, BY REGION, 2021–2029 (USD MILLION)
    8.5 ATTACK SURFACE MANAGEMENT 
           8.5.1 MINIMIZING VULNERABILITIES IN DYNAMIC IT ENVIRONMENTS
                    TABLE 26 MARKET IN ATTACK SURFACE MANAGEMENT, BY REGION, 2021–2029 (USD MILLION)
    8.6 ASSETS MANAGEMENT 
           8.6.1 COMPREHENSIVE SECURITY AND LIFECYCLE MANAGEMENT OF DIGITAL AND PHYSICAL ASSETS
                    TABLE 27 MARKET IN ASSET MANAGEMENT, BY REGION, 2021–2029 (USD MILLION)
    8.7 OTHER APPLICATIONS 
           TABLE 28 MARKET IN OTHER APPLICATIONS, BY REGION, 2021–2029 (USD MILLION)
           8.7.1 WEB APPLICATION SECURITY
           8.7.2 END POINT SECURITY
           8.7.3 SECURITY COMPLIANCE MANAGEMENT
 
9 EXPOSURE MANAGEMENT MARKET, BY END-USER INDUSTRY (Page No. - 107)
    9.1 INTRODUCTION 
           9.1.1 END-USER INDUSTRY: MARKET DRIVERS
                    FIGURE 35 HEALTHCARE INDUSTRY TO WITNESS FASTER GROWTH DURING FORECAST PERIOD
                    TABLE 29 MARKET, BY END-USER INDUSTRY, 2021–2029 (USD MILLION)
    9.2 BANKING, FINANCIAL SERVICES, AND INSURANCE (BFSI) 
           9.2.1 ADVANCED SECURITY AND COMPLIANCE SOLUTIONS TO MITIGATE CYBER THREATS AND REGULATORY RISKS
                    TABLE 30 EXPOSURE MANAGEMENT IN BFSI INDUSTRY, BY REGION, 2021–2029 (USD MILLION)
    9.3 HEALTHCARE 
           9.3.1 SPECIALIZED SOLUTIONS FOR DATA PROTECTION, COMPLIANCE, AND CYBER THREAT MITIGATION
                    TABLE 31 EXPOSURE MANAGEMENT IN HEALTHCARE INDUSTRY, BY REGION, 2021–2029 (USD MILLION)
    9.4 RETAIL & ECOMMERCE 
           9.4.1 COMPREHENSIVE CYBERSECURITY MEASURES AND COMPLIANCE STRATEGIES
                    TABLE 32 EXPOSURE MANAGEMENT IN RETAIL & ECOMMERCE INDUSTRY, BY REGION, 2021–2029 (USD MILLION)
    9.5 GOVERNMENT 
           9.5.1 SPECIALIZED CYBERSECURITY AND COMPLIANCE SOLUTIONS FOR SENSITIVE DATA PROTECTION
                    TABLE 33 EXPOSURE MANAGEMENT IN GOVERNMENT INDUSTRY, BY REGION, 2021–2029 (USD MILLION)
    9.6 ENERGY & UTILITIES 
           9.6.1 SPECIALIZED IT AND OT SECURITY SOLUTIONS FOR CRITICAL INFRASTRUCTURE PROTECTION
                    TABLE 34 EXPOSURE MANAGEMENT IN ENERGY & UTILITIES INDUSTRY, BY REGION, 2021–2029 (USD MILLION)
    9.7 IT & ITES 
           9.7.1 ADVANCED CYBERSECURITY, COMPLIANCE, AND DATA PROTECTION STRATEGIES IN COMPLEX REGULATORY LANDSCAPE
                    TABLE 35 EXPOSURE MANAGEMENT IN IT & ITES INDUSTRY, BY REGION, 2021–2029 (USD MILLION)
    9.8 OTHER END-USER INDUSTRIES 
           TABLE 36 EXPOSURE MANAGEMENT IN OTHER INDUSTRIES, BY REGION, 2021–2029(USD MILLION)
           9.8.1 EDUCATION
           9.8.2 MANUFACTURING
 
10 EXPOSURE MANAGEMENT MARKET, BY REGION (Page No. - 118)
     10.1 INTRODUCTION 
               FIGURE 36 ASIA PACIFIC TO GROW AT HIGHEST CAGR DURING FORECAST PERIOD
               TABLE 37 MARKET, BY REGION, 2021–2029 (USD MILLION)
     10.2 NORTH AMERICA 
             10.2.1 NORTH AMERICA: MARKET DRIVERS
             10.2.2 NORTH AMERICA: RECESSION IMPACT
             10.2.3 NORTH AMERICA: REGULATORY LANDSCAPE
                       FIGURE 37 NORTH AMERICA: MARKET SNAPSHOT
                       TABLE 38 NORTH AMERICA: EXPOSURE MANAGEMENT MARKET, BY COMPONENT, 2021–2029 (USD MILLION)
                       TABLE 39 NORTH AMERICA: MARKET, BY DEPLOYMENT MODE, 2021–2029 (USD MILLION)
                       TABLE 40 NORTH AMERICA: MARKET, BY APPLICATION, 2021–2029 (USD MILLION)
                       TABLE 41 NORTH AMERICA: MARKET, BY END-USER INDUSTRY, 2021–2029 (USD MILLION)
                       TABLE 42 NORTH AMERICA: MARKET, BY COUNTRY, 2021–2029 (USD MILLION)
             10.2.4 US
                       10.2.4.1 Rapid technological innovations, rise in cyber threats, and strategic cybersecurity initiatives
                       TABLE 43 US: MARKET, BY COMPONENT, 2021–2029 (USD MILLION)
                       TABLE 44 US: EXPOSURE MANAGEMENT MARKET, BY DEPLOYMENT MODE, 2021–2029 (USD MILLION)
                       TABLE 45 US: MARKET, BY APPLICATION, 2021–2029 (USD MILLION)
                       TABLE 46 US: MARKET, BY END-USER INDUSTRY, 2021–2029 (USD MILLION)
             10.2.5 CANADA
                       10.2.5.1 Advanced security technology adoption, increased cyberattacks, and government cybersecurity initiatives to propel demand
                       TABLE 47 CANADA: MARKET, BY COMPONENT, 2021–2029 (USD MILLION)
                       TABLE 48 CANADA: MARKET, BY DEPLOYMENT MODE, 2021–2029 (USD MILLION)
                       TABLE 49 CANADA: MARKET, BY APPLICATION, 2021–2029 (USD MILLION)
                       TABLE 50 CANADA: MARKET, BY END-USER INDUSTRY, 2021–2029 (USD MILLION)
     10.3 EUROPE 
             10.3.1 EUROPE: EXPOSURE MANAGEMENT MARKET DRIVERS
             10.3.2 EUROPE: RECESSION IMPACT
             10.3.3 EUROPE: REGULATORY LANDSCAPE
                       TABLE 51 EUROPE: MARKET, BY COMPONENT, 2021–2029 (USD MILLION)
                       TABLE 52 EUROPE: MARKET, BY DEPLOYMENT MODE, 2021–2029 (USD MILLION)
                       TABLE 53 EUROPE: MARKET, BY APPLICATION, 2021–2029 (USD MILLION)
                       TABLE 54 EUROPE: MARKET, BY END-USER INDUSTRY, 2021–2029 (USD MILLION)
                       TABLE 55 EUROPE: MARKET, BY COUNTRY, 2021–2029 (USD MILLION)
             10.3.4 UK
                       10.3.4.1 Digital transformation, proactive government cybersecurity initiatives, and advanced cybersecurity
                                   TABLE 56 UK: EXPOSURE MANAGEMENT MARKET, BY COMPONENT, 2021–2029 (USD MILLION)
                                   TABLE 57 UK: MARKET, BY DEPLOYMENT MODE, 2021–2029 (USD MILLION)
                                   TABLE 58 UK: MARKET, BY APPLICATION, 2021–2029 (USD MILLION)
                                   TABLE 59 UK: MARKET, BY END-USER INDUSTRY, 2021–2029 (USD MILLION)
             10.3.5 GERMANY
                       10.3.5.1 Advanced cybersecurity frameworks and strategic government cybersecurity initiatives necessitated by security gaps
                                   TABLE 60 GERMANY: MARKET, BY COMPONENT, 2021–2029 (USD MILLION)
                                   TABLE 61 GERMANY: MARKET, BY DEPLOYMENT MODE, 2021–2029 (USD MILLION)
                                   TABLE 62 GERMANY: MARKET, BY APPLICATION, 2021–2029 (USD MILLION)
                                   TABLE 63 GERMANY: MARKET, BY END-USER INDUSTRY, 2021–2029 (USD MILLION)
             10.3.6 ITALY
                       10.3.6.1 Rising cybercrime incidents, government cyber resilience efforts, and private sector engagement
                                   TABLE 64 ITALY: EXPOSURE MANAGEMENT MARKET, BY COMPONENT, 2021–2029 (USD MILLION)
                                   TABLE 65 ITALY: MARKET, BY DEPLOYMENT MODE, 2021–2029 (USD MILLION)
                                   TABLE 66 ITALY: MARKET, BY APPLICATION, 2021–2029 (USD MILLION)
                                   TABLE 67 ITALY: MARKET, BY END-USER INDUSTRY, 2021–2029 (USD MILLION)
             10.3.7 REST OF EUROPE
                       TABLE 68 REST OF EUROPE: MARKET, BY COMPONENT, 2021–2029 (USD MILLION)
                       TABLE 69 REST OF EUROPE: MARKET, BY DEPLOYMENT MODE, 2021–2029 (USD MILLION)
                       TABLE 70 REST OF EUROPE: MARKET, BY APPLICATION, 2021–2029 (USD MILLION)
                       TABLE 71 REST OF EUROPE: EXPOSURE MANAGEMENT MARKET, BY END-USER INDUSTRY, 2021–2029 (USD MILLION)
     10.4 ASIA PACIFIC 
             10.4.1 ASIA PACIFIC: MARKET DRIVERS
             10.4.2 ASIA PACIFIC: RECESSION IMPACT
             10.4.3 ASIA PACIFIC: REGULATORY LANDSCAPE
                       FIGURE 38 ASIA PACIFIC: MARKET SNAPSHOT
                       TABLE 72 ASIA PACIFIC: MARKET, BY COMPONENT, 2021–2029 (USD MILLION)
                       TABLE 73 ASIA PACIFIC: MARKET, BY DEPLOYMENT MODE, 2021–2029 (USD MILLION)
                       TABLE 74 ASIA PACIFIC: MARKET, BY APPLICATION, 2021–2029 (USD MILLION)
                       TABLE 75 ASIA PACIFIC: MARKET, BY END-USER INDUSTRY, 2021–2029 (USD MILLION)
                       TABLE 76 ASIA PACIFIC: EXPOSURE MANAGEMENT MARKET, BY COUNTRY, 2021–2029 (USD MILLION)
             10.4.4 CHINA
                       10.4.4.1 Emphasis on cybersecurity amid rising hacking threats and legislative developments
                                   TABLE 77 CHINA: MARKET, BY COMPONENT, 2021–2029 (USD MILLION)
                                   TABLE 78 CHINA: MARKET, BY DEPLOYMENT MODE, 2021–2029 (USD MILLION)
                                   TABLE 79 CHINA: MARKET, BY APPLICATION, 2021–2029 (USD MILLION)
                                   TABLE 80 CHINA: MARKET, BY END-USER INDUSTRY, 2021–2029 (USD MILLION)
             10.4.5 JAPAN
                       10.4.5.1 Increase in cybercrime and need for threat prioritization and coordination
                                   TABLE 81 JAPAN: MARKET, BY COMPONENT, 2021–2029 (USD MILLION)
                                   TABLE 82 JAPAN: MARKET, BY DEPLOYMENT MODE, 2021–2029 (USD MILLION)
                                   TABLE 83 JAPAN: MARKET, BY APPLICATION, 2021–2029 (USD MILLION)
                                   TABLE 84 JAPAN: MARKET, BY END-USER INDUSTRY, 2021–2029 (USD MILLION)
             10.4.6 INDIA
                       10.4.6.1 Cybersecurity policy updates, increasing cyber threat complexity, and proactive cyber defense initiatives to boost growth
                                   TABLE 85 INDIA: EXPOSURE MANAGEMENT MARKET, BY COMPONENT, 2021–2029 (USD MILLION)
                                   TABLE 86 INDIA: MARKET, BY DEPLOYMENT MODE, 2021–2029 (USD MILLION)
                                   TABLE 87 INDIA: MARKET, BY APPLICATION, 2021–2029 (USD MILLION)
                                   TABLE 88 INDIA: MARKET, BY END-USER INDUSTRY, 2021–2029 (USD MILLION)
             10.4.7 REST OF ASIA PACIFIC
                       TABLE 89 REST OF ASIA PACIFIC: MARKET, BY COMPONENT, 2021–2029 (USD MILLION)
                       TABLE 90 REST OF ASIA PACIFIC: MARKET, BY DEPLOYMENT MODE, 2021–2029 (USD MILLION)
                       TABLE 91 REST OF ASIA PACIFIC: MARKET, BY APPLICATION, 2021–2029 (USD MILLION)
                       TABLE 92 REST OF ASIA PACIFIC: MARKET, BY END-USER INDUSTRY, 2021–2029 (USD MILLION)
     10.5 MIDDLE EAST & AFRICA 
             10.5.1 MIDDLE EAST & AFRICA: EXPOSURE MANAGEMENT MARKET DRIVERS
             10.5.2 MIDDLE EAST & AFRICA: RECESSION IMPACT
             10.5.3 MIDDLE EAST & AFRICA: REGULATORY LANDSCAPE
                       TABLE 93 MIDDLE EAST & AFRICA: MARKET, BY COMPONENT, 2021–2029 (USD MILLION)
                       TABLE 94 MIDDLE EAST & AFRICA: MARKET, BY DEPLOYMENT MODE, 2021–2029 (USD MILLION)
                       TABLE 95 MIDDLE EAST & AFRICA: MARKET, BY APPLICATION, 2021–2029 (USD MILLION)
                       TABLE 96 MIDDLE EAST & AFRICA: MARKET, BY END-USER INDUSTRY, 2021–2029 (USD MILLION)
                       TABLE 97 MIDDLE EAST & AFRICA: MARKET, BY COUNTRY, 2021–2029 (USD MILLION)
             10.5.4 GULF COOPERATION COUNCIL (GCC)
                       TABLE 98 GCC: EXPOSURE MANAGEMENT MARKET, BY COMPONENT, 2021–2029 (USD MILLION)
                       TABLE 99 GCC: MARKET, BY DEPLOYMENT MODE, 2021–2029 (USD MILLION)
                       TABLE 100 GCC: MARKET, BY APPLICATION, 2021–2029 (USD MILLION)
                       TABLE 101 GCC: MARKET, BY END-USER INDUSTRY, 2021–2029 (USD MILLION)
                       TABLE 102 GCC: MARKET, BY COUNTRY, 2021–2029 (USD MILLION)
                       10.5.4.1 KSA
                                   10.5.4.1.1 Vision 2030’s digital transformation and regulatory enhancement strategies
                                   TABLE 103 KSA: MARKET, BY COMPONENT, 2021–2029 (USD MILLION)
                                   TABLE 104 KSA:  MARKET, BY DEPLOYMENT MODE, 2021–2029 (USD MILLION)
                                   TABLE 105 KSA: MARKET, BY APPLICATION, 2021–2029 (USD MILLION)
                                   TABLE 106 KSA: MARKET, BY END-USER INDUSTRY, 2021–2029 (USD MILLION)
                       10.5.4.2 UAE
                                   10.5.4.2.1 Heightened development, state-sponsored attacks, and need for robust solutions to drive market
                                   TABLE 107 UAE: MARKET, BY COMPONENT, 2021–2029 (USD MILLION)
                                   TABLE 108 UAE: MARKET, BY DEPLOYMENT MODE, 2021–2029 (USD MILLION)
                                   TABLE 109 UAE: EXPOSURE MANAGEMENT MARKET, BY APPLICATION, 2021–2029 (USD MILLION)
                                   TABLE 110 UAE: MARKET, BY END-USER INDUSTRY, 2021–2029 (USD MILLION)
                       10.5.4.3 Rest of GCC countries
                                   TABLE 111 REST OF GCC: MARKET, BY COMPONENT, 2021–2029 (USD MILLION)
                                   TABLE 112 REST OF GCC: MARKET, BY DEPLOYMENT MODE, 2021–2029 (USD MILLION)
                                   TABLE 113 REST OF GCC: MARKET, BY APPLICATION, 2021–2029 (USD MILLION)
                                   TABLE 114 REST OF GCC: MARKET, BY END-USER INDUSTRY, 2021–2029 (USD MILLION)
             10.5.5 SOUTH AFRICA
                       10.5.5.1 Telecom and financial sector security concerns
                                   TABLE 115 SOUTH AFRICA: MARKET, BY COMPONENT, 2021–2029 (USD MILLION)
                                   TABLE 116 SOUTH AFRICA: MARKET, BY DEPLOYMENT MODE, 2021–2029 (USD MILLION)
                                   TABLE 117 SOUTH AFRICA: EXPOSURE MANAGEMENT MARKET, BY APPLICATION, 2021–2029 (USD MILLION)
                                   TABLE 118 SOUTH AFRICA: MARKET, BY END-USER INDUSTRY, 2021–2029 (USD MILLION)
             10.5.6 REST OF MIDDLE EAST & AFRICA
                       TABLE 119 REST OF MIDDLE EAST & AFRICA: MARKET, BY COMPONENT, 2021–2029 (USD MILLION)
                       TABLE 120 REST OF MIDDLE EAST & AFRICA: MARKET, BY DEPLOYMENT MODE, 2021–2029 (USD MILLION)
                       TABLE 121 REST OF MIDDLE EAST & AFRICA: MARKET, BY APPLICATION, 2021–2029 (USD MILLION)
                       TABLE 122 REST OF MIDDLE EAST & AFRICA: MARKET, BY END-USER INDUSTRY, 2021–2029 (USD MILLION)
     10.6 LATIN AMERICA 
             10.6.1 LATIN AMERICA: MARKET DRIVERS
             10.6.2 LATIN AMERICA: RECESSION IMPACT
             10.6.3 LATIN AMERICA: REGULATORY LANDSCAPE
                       TABLE 123 LATIN AMERICA: MARKET, BY COMPONENT, 2021–2029 (USD MILLION)
                       TABLE 124 LATIN AMERICA: EXPOSURE MANAGEMENT MARKET, BY DEPLOYMENT MODE, 2021–2029 (USD MILLION)
                       TABLE 125 LATIN AMERICA: MARKET, BY APPLICATION, 2021–2029 (USD MILLION)
                       TABLE 126 LATIN AMERICA: MARKET, BY END-USER INDUSTRY, 2021–2029 (USD MILLION)
                       TABLE 127 LATIN AMERICA: MARKET, BY COUNTRY, 2021–2029 (USD MILLION)
             10.6.4 BRAZIL
                       10.6.4.1 Government investment, data protection legislation, and innovative partnerships to spur market expansion
                                   TABLE 128 BRAZIL: MARKET, BY COMPONENT, 2021–2029 (USD MILLION)
                                   TABLE 129 BRAZIL: MARKET, BY DEPLOYMENT MODE, 2021–2029 (USD MILLION)
                                   TABLE 130 BRAZIL: MARKET, BY APPLICATION, 2021–2029 (USD MILLION)
                                   TABLE 131 BRAZIL: MARKET, BY END-USER INDUSTRY, 2021–2029 (USD MILLION)
             10.6.5 MEXICO
                       10.6.5.1 Rise in digitalization and cybercriminal activities to persuade adoption exposure management solutions
                                   TABLE 132 MEXICO: MARKET, BY COMPONENT, 2021–2029 (USD MILLION)
                                   TABLE 133 MEXICO: MARKET, BY DEPLOYMENT MODE, 2021–2029 (USD MILLION)
                                   TABLE 134 MEXICO: MARKET, BY APPLICATION, 2021–2029 (USD MILLION)
                                   TABLE 135 MEXICO: EXPOSURE MANAGEMENT MARKET, BY END-USER INDUSTRY, 2021–2029 (USD MILLION)
             10.6.6 REST OF LATIN AMERICA
                       TABLE 136 REST OF LATIN AMERICA: MARKET, BY COMPONENT, 2021–2029 (USD MILLION)
                       TABLE 137 REST OF LATIN AMERICA: MARKET, BY DEPLOYMENT MODE, 2021–2029 (USD MILLION)
                       TABLE 138 REST OF LATIN AMERICA: MARKET, BY APPLICATION, 2021–2029 (USD MILLION)
                       TABLE 139 REST OF LATIN AMERICA: MARKET, BY END-USER INDUSTRY, 2021–2029 (USD MILLION)
 
11 COMPETITIVE LANDSCAPE (Page No. - 176)
     11.1 OVERVIEW 
     11.2 KEY PLAYER STRATEGIES/RIGHT TO WIN 
               TABLE 140 OVERVIEW OF STRATEGIES ADOPTED BY KEY EXPOSURE MANAGEMENT VENDORS
     11.3 HISTORICAL REVENUE ANALYSIS 
               FIGURE 39 HISTORICAL REVENUE ANALYSIS OF KEY EXPOSURE MANAGEMENT VENDORS, 2021–2023 (USD MILLION)
     11.4 VALUATION AND FINANCIAL METRICS OF KEY EXPOSURE MANAGEMENT VENDORS 
               FIGURE 40 VALUATION AND FINANCIAL METRICS OF KEY EXPOSURE MANAGEMENT VENDORS, 2022
     11.5 MARKET SHARE ANALYSIS 
               FIGURE 41 MARKET SHARE, 2023
               TABLE 141 EXPOSURE MANAGEMENT MARKET: DEGREE OF COMPETITION
     11.6 PRODUCT/BRAND COMPARISON 
               FIGURE 42 BRAND COMPARISON/VENDOR PRODUCT LANDSCAPE
     11.7 COMPANY EVALUATION MATRIX: KEY PLAYERS 
             11.7.1 STARS
             11.7.2 EMERGING LEADERS
             11.7.3 PERVASIVE PLAYERS
             11.7.4 PARTICIPANTS
                       FIGURE 43 EXPOSURE MANAGEMENT MARKET: COMPANY EVALUATION MATRIX FOR KEY PLAYERS, 2023
             11.7.5 COMPANY FOOTPRINT
                       FIGURE 44 MARKET: OVERALL COMPANY FOOTPRINT
                       TABLE 142 MARKET: COMPANY COMPONENT FOOTPRINT
                       TABLE 143 MARKET: COMPANY APPLICATION FOOTPRINT
                       TABLE 144 MARKET: COMPANY INDUSTRY FOOTPRINT
                       TABLE 145 MARKET: COMPANY REGION FOOTPRINT
     11.8 COMPANY EVALUATION MATRIX: STARTUPS/SMES 
             11.8.1 PROGRESSIVE COMPANIES
             11.8.2 RESPONSIVE COMPANIES
             11.8.3 DYNAMIC COMPANIES
             11.8.4 STARTING BLOCKS
                       FIGURE 45 EXPOSURE MANAGEMENT MARKET: COMPANY EVALUATION MATRIX FOR STARTUPS/SMES, 2023
             11.8.5 COMPETITIVE BENCHMARKING
                       TABLE 146 MARKET: KEY STARTUPS/SMES
                       TABLE 147 MARKET: VERTICAL FOOTPRINT OF STARTUPS/SMES
                       TABLE 148 MARKET: REGIONAL FOOTPRINT OF STARTUPS/SMES
     11.9 COMPETITIVE SCENARIO AND TRENDS 
             11.9.1 PRODUCT LAUNCHES
                       TABLE 149 MARKET: PRODUCT LAUNCHES, JANUARY 2021–FEBRUARY 2024
             11.9.2 DEALS
                       TABLE 150 EXPOSURE MANAGEMENT MARKET: DEALS, JANUARY 2021–FEBRUARY 2024
 
12 COMPANY PROFILES (Page No. - 200)
(Business overview, Products/Solutions/Services offered, Recent developments & MnM View)*
     12.1 KEY PLAYERS 
             12.1.1 TENABLE
                       TABLE 151 TENABLE: BUSINESS OVERVIEW
                       FIGURE 46 TENABLE: COMPANY SNAPSHOT
                       TABLE 152 TENABLE: PRODUCTS/SOLUTIONS/SERVICES OFFERED
                       TABLE 153 TENABLE: PRODUCT LAUNCHES
                       TABLE 154 TENABLE: DEALS
             12.1.2 CROWDSTRIKE
                       TABLE 155 CROWDSTRIKE: BUSINESS OVERVIEW
                       FIGURE 47 CROWDSTRIKE: COMPANY SNAPSHOT
                       TABLE 156 CROWDSTRIKE: PRODUCTS/SOLUTIONS/SERVICES OFFERED
                       TABLE 157 CROWDSTRIKE: PRODUCT LAUNCHES
                       TABLE 158 CROWDSTRIKE: DEALS
             12.1.3 PALO ALTO NETWORKS
                       TABLE 159 PALO ALTO NETWORKS: BUSINESS OVERVIEW
                       FIGURE 48 PALO ALTO NETWORKS: COMPANY SNAPSHOT
                       TABLE 160 PALO ALTO NETWORKS: PRODUCTS/SOLUTIONS/SERVICES OFFERED
                       TABLE 161 PALO ALTO NETWORKS: PRODUCT LAUNCHES
                       TABLE 162 PALO ALTO NETWORKS: DEALS
             12.1.4 FORESCOUT
                       TABLE 163 FORESCOUT: BUSINESS OVERVIEW
                       TABLE 164 FORESCOUT: PRODUCTS/SOLUTIONS/SERVICES OFFERED
                       TABLE 165 FORESCOUT: PRODUCT LAUNCHES
                       TABLE 166 FORESCOUT: DEALS
             12.1.5 EY
                       TABLE 167 EY: BUSINESS OVERVIEW
                       TABLE 168 EY: PRODUCTS/SOLUTIONS/SERVICES OFFERED
             12.1.6 VIAVI
                       TABLE 169 VIAVI: BUSINESS OVERVIEW
                       FIGURE 49 VIAVI: COMPANY SNAPSHOT
                       TABLE 170 VIAVI: PRODUCTS/SOLUTIONS/SERVICES OFFERED
                       TABLE 171 VIAVI: PRODUCT LAUNCHES
             12.1.7 VERISK
                       TABLE 172 VERISK: BUSINESS OVERVIEW
                       FIGURE 50 VERISK: COMPANY SNAPSHOT
                       TABLE 173 VERISK: PRODUCTS/SOLUTIONS/SERVICES OFFERED
                       TABLE 174 VERISK: PRODUCT LAUNCHES
                       TABLE 175 VERISK: DEALS
             12.1.8 IBM
                       TABLE 176 IBM: BUSINESS OVERVIEW
                       FIGURE 51 IBM: COMPANY SNAPSHOT
                       TABLE 177 IBM: PRODUCTS/SOLUTIONS/SERVICES OFFERED
                       TABLE 178 IBM: DEALS
             12.1.9 ESENTIRE
                       TABLE 179 ESENTIRE: BUSINESS OVERVIEW
                       TABLE 180 ESENTIRE: PRODUCTS/SOLUTIONS/SERVICES OFFERED
                       TABLE 181 ESENTIRE: DEALS
             12.1.10 MANDIANT (GOOGLE)
                                   TABLE 182 MANDIANT (GOOGLE): BUSINESS OVERVIEW
                                   FIGURE 52 MANDIANT (GOOGLE): COMPANY SNAPSHOT
                                   TABLE 183 MANDIANT (GOOGLE): PRODUCTS/SOLUTIONS/SERVICES OFFERED
                                   TABLE 184 MANDIANT (GOOGLE): PRODUCT LAUNCHES
                                   TABLE 185 MANDIANT (GOOGLE): DEALS
*Details on Business overview, Products/Solutions/Services offered, Recent developments & MnM View might not be captured in case of unlisted companies.
     12.2 OTHER KEY PLAYERS 
             12.2.1 CYCOGNITO
             12.2.2 CENSYS
             12.2.3 XM CYBER
             12.2.4 CYMULATE
             12.2.5 SKYBOX SECURITY
             12.2.6 ARMIS
             12.2.7 PICUS SECURITY
             12.2.8 ADARMA
             12.2.9 IONIX
             12.2.10 OUTPOST24
             12.2.11 RESILIENTX SECURITY
             12.2.12 RIDGE SECURITY
             12.2.13 REDHUNT LABS
             12.2.14 BRANDEFENSE
             12.2.15 RISK PROFILER
 
13 ADJACENT MARKETS (Page No. - 250)
     13.1 INTRODUCTION 
               TABLE 186 ADJACENT MARKETS AND FORECASTS
     13.2 LIMITATIONS 
     13.3 SECURITY AND VULNERABILITY MANAGEMENT MARKET 
             13.3.1 INCLUSIONS AND EXCLUSIONS
                       TABLE 187 SECURITY AND VULNERABILITY MANAGEMENT MARKET, BY COMPONENT, 2016–2020 (USD MILLION)
                       TABLE 188 SECURITY AND VULNERABILITY MANAGEMENT MARKET, BY COMPONENT, 2021–2026 (USD MILLION)
                       TABLE 189 SECURITY AND VULNERABILITY MANAGEMENT MARKET, BY TARGET, 2016–2020 (USD MILLION)
                       TABLE 190 SECURITY AND VULNERABILITY MANAGEMENT MARKET, BY TARGET, 2021–2026 (USD MILLION)
                       TABLE 191 SECURITY AND VULNERABILITY MANAGEMENT MARKET, BY DEPLOYMENT MODE, 2016–2020 (USD MILLION)
                       TABLE 192 SECURITY AND VULNERABILITY MANAGEMENT MARKET, BY DEPLOYMENT MODE, 2021–2026 (USD MILLION)
                       TABLE 193 SECURITY AND VULNERABILITY MANAGEMENT MARKET, BY ORGANIZATION SIZE, 2016–2020 (USD MILLION)
                       TABLE 194 SECURITY AND VULNERABILITY MANAGEMENT MARKET, BY ORGANIZATION SIZE, 2021–2026 (USD MILLION)
                       TABLE 195 SECURITY AND VULNERABILITY MANAGEMENT MARKET, BY VERTICAL, 2016–2020 (USD MILLION)
                       TABLE 196 SECURITY AND VULNERABILITY MANAGEMENT MARKET, BY VERTICAL, 2021–2026 (USD MILLION)
                       TABLE 197 SECURITY AND VULNERABILITY MANAGEMENT MARKET, BY REGION, 2016–2020 (USD MILLION)
                       TABLE 198 SECURITY AND VULNERABILITY MANAGEMENT MARKET, BY REGION, 2021–2026 (USD MILLION)
     13.4 SECURITY INFORMATION AND EVENT MANAGEMENT (SIEM) MARKET 
             13.4.1 INCLUSIONS AND EXCLUSIONS
                       TABLE 199 SECURITY INFORMATION AND EVENT MANAGEMENT MARKET, BY COMPONENT, 2018–2025 (USD MILLION)
                       TABLE 200 SECURITY INFORMATION AND EVENT MANAGEMENT MARKET, BY APPLICATION, 2018–2025 (USD MILLION)
                       TABLE 201 SECURITY INFORMATION AND EVENT MANAGEMENT MARKET, BY DEPLOYMENT MODE, 2018–2025 (USD MILLION)
                       TABLE 202 SECURITY INFORMATION AND EVENT MANAGEMENT MARKET, BY ORGANIZATION SIZE, 2018–2025 (USD MILLION)
                       TABLE 203 SECURITY INFORMATION AND EVENT MANAGEMENT MARKET, BY VERTICAL, 2018–2025 (USD MILLION)
                       TABLE 204 SECURITY INFORMATION AND EVENT MANAGEMENT MARKET, BY REGION, 2018–2025 (USD MILLION)
 
14 APPENDIX (Page No. - 259)
     14.1 DISCUSSION GUIDE 
     14.2 KNOWLEDGESTORE: MARKETSANDMARKETS’ SUBSCRIPTION PORTAL 
     14.3 CUSTOMIZATION OPTIONS 
     14.4 RELATED REPORTS 
     14.5 AUTHOR DETAILS 

The study involved significant activities in estimating the current market size for Exposure Management. Intensive secondary research was conducted to collect information about exposure management and related ecosystems. The industry executives validated these findings, assumptions, and sizing across the value chain using a primary research process as a next step. Top-down and bottom-up market estimation approaches were used to estimate the market size globally, followed by the market breakup and data triangulation procedures to assess the market segment and sub-segments in exposure management.

Secondary Research Process:

In the secondary research process, various sources were referred to to identify and collect exposure management information. These sources include annual reports, press releases, exposure management software and service vendor investor presentations, forums, vendor-certified publications, and industry/association white papers. These secondary sources were utilized to obtain critical information about exposure management’s solutions and services supply & value chain, a list of 100+ key players and SMEs, market classification, and segmentation per the industry trends and regional markets. The secondary research also gives us insights into the key developments from market and technology perspectives, which primary respondents further validated.

The factors considered for estimating the regional market size include technological initiatives undertaken by governments of different countries, GDP growth, ICT spending, recent market developments, and market ranking analysis of primary exposure management solutions and service vendors.

Primary Research Process:

We have conducted primary research with industry executives from both the supply and demand sides. The primary sources from the supply side include chief executive officers (CEOs), vice presidents (VPs), marketing directors, and technology and innovation executives of key companies operating in the exposure management market. We have conducted primary interviews with the executives to obtain qualitative and quantitative information for exposure management.

The market engineering process implemented the top-down and bottom-up approaches and various data triangulation methods to estimate and forecast the market segments and subsegments. During the post-market engineering process, we conducted primary research to verify and validate the critical numbers we arrived at. The primary analysis was also undertaken to identify the segmentation types, industry trends, the competitive landscape of the exposure management market players, and fundamental market dynamics, such as drivers, restraints, opportunities, challenges, industry trends, and key strategies.

Following is the breakup of the primary research:

Exposure Management  Market Size, and Share

To know about the assumptions considered for the study, download the pdf brochure

Market Size Estimation Process:

Both top-down and bottom-up approaches were implemented for market size estimation to estimate, project, and forecast the size of the global and other dependent sub-segments in the overall exposure management market.

The research methodology used to estimate the market size includes these steps:

  • The key players, SMEs, and startups were identified through secondary sources. Their revenue contributions in the market were determined through primary and secondary sources.
  • Annual and financial reports of the publicly listed market players were considered for the company’s revenue details, and,
  • Primary interviews were also conducted with industry leaders to collect information about their companies, competitors, and key players in the market.
  • All percentage splits and breakups were determined using secondary sources and verified through primary sources. 

Top-down and Bottom-up Approach-

Exposure Management Market Top Down annd Bottom Up Approach

To know about the assumptions considered for the study, Request for Free Sample Report

Data Triangulation

Data triangulation is a crucial step in the market engineering process for exposure management. It involves utilizing multiple data sources and methodologies to validate and cross-reference findings, thereby enhancing the reliability and accuracy of the market segment and subsegment statistics. To conduct data triangulation, various factors and trends related to the exposure management market are studied from both the demand and supply sides. It includes analyzing data from diverse sources such as market research reports, industry publications, regulatory bodies, financial institutions, and technology providers. By examining data from different perspectives and sources, data triangulation helps mitigate potential biases and discrepancies. It provides a more comprehensive understanding of the market dynamics, including the size, growth rate, market trends, and customer preferences.

Furthermore, data triangulation aids in identifying any inconsistencies or outliers in the data, enabling researchers to refine their analysis and make informed decisions. It strengthens the credibility of the market engineering process by ensuring the conclusions drawn are based on robust and corroborated data. Data triangulation is a rigorous and systematic approach enhancing the reliability and validity of market segment and subsegment statistics in exposure management. It provides a solid foundation for informed decision-making and strategic planning within the industry.

Market Definition

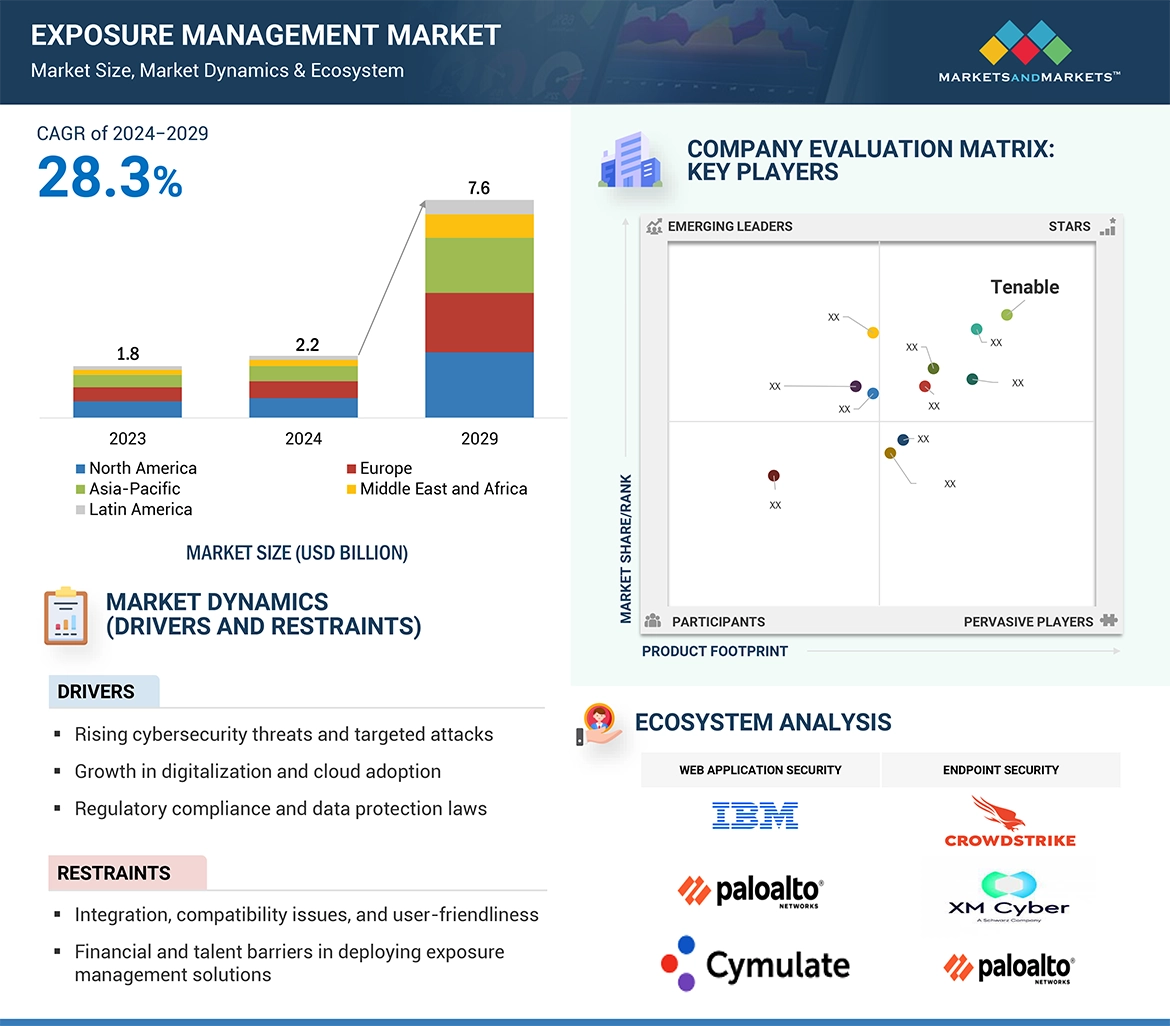
Exposure management is a security practice used to map a company's digital attack surface and create and execute plans to mitigate these security threats. Exposure management includes identifying, assessing, and managing possible risks and vulnerabilities before attackers take advantage of them. the exposure management process involves scoping, discovery, prioritization, validation, and mobilization.

Key Stakeholders

  • Chief Technology and Data Officers
  • Certified Information Systems Auditor
  • Business Analysts
  • Information Technology (IT) Professionals
  • Government Agencies
  • Small and Medium-Sized Enterprises (SMEs) And Large Enterprises
  • Consultants/ Consultancies/ Advisory Firms
  • Managed and Professional Service Providers

Report Objectives

  • To define, describe, and forecast the exposure management market based on component, deployment mode, application, end-user industry, and region:
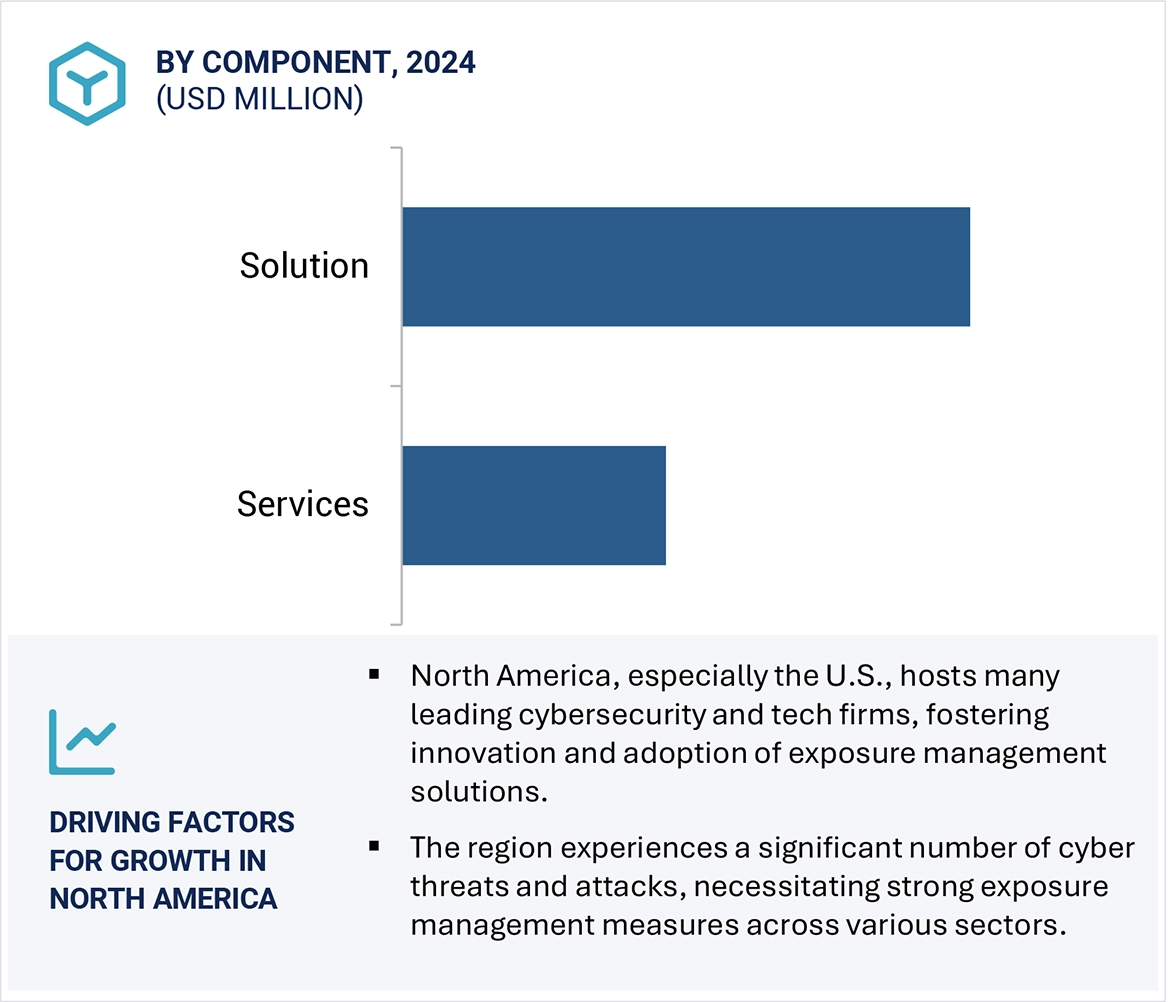
  • To predict and estimate the market size of five main regions: North America, Europe, Asia Pacific, Middle East & Africa, and Latin America
  • To analyze the subsegments of the market concerning individual growth trends, prospects, and contributions to the overall market
  • To provide detailed information related to the primary factors (drivers, restraints, opportunities, and challenges) influencing the growth of the market
  • To analyze opportunities in the market for stakeholders by identifying high-growth segments of the market
  • To profile the key players of the market and comprehensively analyze their market size and core competencies. 
  • Track and analyze competitive developments, such as new product launches, mergers and acquisitions, partnerships, agreements, and collaborations in the global exposure management market.

Customization Options

With the given market data, MarketsandMarkets offers customizations based on company-specific needs. The following customization options are available for the report:

Geographic Analysis

  • Further breakup of the Asia Pacific market into countries contributing 75% to the regional market size
  • Further breakup of the North American market into countries contributing 75% to the regional market size
  • Further breakup of the Latin American market into countries contributing 75% to the regional market size
  • Further breakup of the Middle Eastern and African market into countries contributing 75% to the regional market size
  • Further breakup of the European market into countries contributing 75% to the regional market size

Company Information

  • Detailed analysis and profiling of additional market players (up to 5)
Custom Market Research Services

We will customize the research for you, in case the report listed above does not meet with your exact requirements. Our custom research will comprehensively cover the business information you require to help you arrive at strategic and profitable business decisions.

Request Customization
Report Code
TC 8973
Published ON
Mar, 2024
Choose License Type
BUY NOW
  • SHARE
X
Request Customization
Speak to Analyst
Speak to Analyst
OR FACE-TO-FACE MEETING
PERSONALIZE THIS RESEARCH
  • Triangulate with your Own Data
  • Get Data as per your Format and Definition
  • Gain a Deeper Dive on a Specific Application, Geography, Customer or Competitor
  • Any level of Personalization
REQUEST A FREE CUSTOMIZATION
LET US HELP YOU!
  • What are the Known and Unknown Adjacencies Impacting the Exposure Management Market
  • What will your New Revenue Sources be?
  • Who will be your Top Customer; what will make them switch?
  • Defend your Market Share or Win Competitors
  • Get a Scorecard for Target Partners
CUSTOMIZED WORKSHOP REQUEST
+1-888-600-6441
  • Call Us
  • +1-888-600-6441 (Corporate office hours)
  • +1-888-600-6441 (US/Can toll free)
  • +44-800-368-9399 (UK office hours)
CONNECT WITH US
ABOUT TRUST ONLINE
©2024 MarketsandMarkets Research Private Ltd. All rights reserved
DMCA.com Protection Status Website Feedback