Extruded Polystyrene Market

Extruded Polystyrene Market by Application (Foundation, Roof, Wall, Floor & Ceiling), End-use Industry (Residential, Commercial), and Region (North America, Europe, Asia-Pacific, South America, Middle East and Africa) - Global Forecast to 2028

Report Code: CH 7474 Jan, 2024, by marketsandmarkets.com

In terms of value, extruded polystyrene market size is projected to increase from USD 5.6 billion in 2023 to USD 6.9 billion by 2028, at a CAGR of 4.3%. Extruded polystyrene is a versatile and durable insulation material composed of closed-cell foam. It is manufactured by heating polystyrene resin and then extruding it into rigid boards or panels. Extruded polystyrene offers superior thermal insulation, making it ideal for construction applications in walls, roofs, floors, and foundations. Its closed-cell structure prevents moisture absorption, ensuring long-term performance and structural integrity. Extruded polystyrene is widely used in the building industry for its high compressive strength, resistance to moisture, and ability to maintain insulating properties over time, contributing to energy efficiency and sustainability in various construction projects in various industries like residential, commercial, and others.

Extruded Polystyrene Market

To know about the assumptions considered for the study, Request for Free Sample Report

Extruded Polystyrene Market

Market Dynamics

Driver: Growing construction industries in developing nations

The expansion of the construction industry in developing nations acts as a driving force for the extruded polystyrene market. These countries, experiencing rapid urbanization and infrastructure growth, demand efficient and sustainable construction materials. Extruded polystyrene insulation, known for its thermal efficiency and moisture resistance, fulfills these needs, aiding in energy conservation and enhancing building durability. With evolving building standards in these regions, extruded polystyrene emerges as a favored choice, contributing to the market's growth by meeting the escalating requirements of developing nation construction projects.

Restraints: Availability of high-performance substitute

The presence of high-performance alternatives to extruded polystyrene, offering comparable or better properties like superior insulation or environmental benefits, acts as a challenge for the extruded polystyrene market. Materials such as polyisocyanurate or mineral wool provide stiff competition due to their advanced attributes, impacting the market share of extruded polystyrene and prompting the need for innovation and sustainability improvements within the extruded polystyrene sector to stay competitive.

Opportunities: Easy recyclability of polystyrene products

The extruded polystyrene market exhibits a significant opportunity for easy recyclability of polystyrene products. The potential for easy recyclability of polystyrene products, including extruded polystyrene, offers a significant opportunity for the extruded polystyrene market. Innovations in recycling technology aim to create efficient methods for breaking down and reusing polystyrene materials, reducing waste and environmental impact. Establishing effective recycling processes could lead to a circular economy, where used extruded polystyrene products could be recycled into new materials, aligning with sustainability goals and meeting consumer demands for eco-friendly solutions, potentially driving the market growth for extruded polystyrene.

Challenges: Fluctuation in raw material cost and supply

The fluctuation of raw material costs and supply presents a significant challenge for the extruded polystyrene market. Polystyrene, a key component used in manufacturing extruded polystyrene, is subject to price variations influenced by factors such as crude oil prices, supply-demand dynamics, and global market conditions. These fluctuations in raw material costs directly impact the production expenses of extruded polystyrene manufacturers, potentially affecting their profit margins and pricing strategies. Moreover, dissuasions in the supply chain, whether due to geopolitical factors, natural disasters, or logistical issues, can lead to supply shortages or delays in obtaining raw materials, impacting production schedules and potentially causing market instability.

Extruded Polystyrene Market Ecosystem

Prominent companies in this market include well-established extruded polystyrene manufacturers. These businesses have been in business for a while and have an extensive range of products, pioneering technologies, and strong international sales and marketing networks. Top companies in this market include Kingspan Group PLC (Ireland), Owens Corning (US), BASF SE (Germany), Synthos S.A. (Poland), Ravago S.A. (Belgium), Saint-Gobain (France), Dupont de Nemours, Inc. (US), Dow Inc. (US), Kaneka Corporation (Japan), and Supreme Petrochem Ltd. (India).

Extruded Polystyrene Market Ecosystem

“Based on application, the foundation  is estimated to be the largest application for extruded polystyrene market in 2022, in terms of value.”

The foundation segment retained its significance as a primary application area for extruded polystyrene in 2022. Extruded polystyrene insulation continued to be extensively utilized beneath building foundations due to its exceptional thermal resistance, robust moisture barrier, and substantial load-bearing capacity. This application of extruded polystyrene played a pivotal role in enhancing the energy efficiency and durability of structures, crucial in adhering to stringent building codes and sustainability norms. The demand for extruded polystyrene in foundations persisted as it effectively curbed heat loss, prevented moisture-related issues, and contributed to the structural integrity of buildings. Although its dominance in foundation insulation, extruded polystyrene also found widespread usage in diverse sectors, highlighting its versatility and importance across multiple applications such as floor, wall, roof & ceiling, and others.

“Based on the end-use industry, the residential segment is estimated to be the largest market for extruded polystyrene market, in terms of value, in 2022.”

The residential segment stood out as a primary end-use industry for extruded polystyrene, driven by its widespread application in residential construction projects. Extruded polystyrene insulation plays a pivotal role in enhancing the energy efficiency and structural integrity of residential buildings. It is used in insulating various parts of homes, including walls, roofs & ceilings, floors, and basements, thereby reducing heat loss, preventing moisture penetration, and ensuring a comfortable living environment. The demand in the residential segment was attributed to stringent energy efficiency standards, building codes mandating better insulation practices, and a growing focus on sustainable and eco-friendly construction methods. However, while residential construction dominates extruded polystyrene usage, its versatility extends to multiple industries, highlighting its significance beyond residential applications.

“Europe is estimated to be the largest region in extruded polystyrene market in 2022, in terms of value.”

Europe is estimated to maintain its position as the largest region for extruded polystyrene due to several factors. Europe has stringent energy efficiency standards and building regulations, compelling the widespread use of high-performance insulation materials like extruded polystyrene in construction. The region's focus on sustainable building practices, coupled with a robust construction industry and increased infrastructure development, has propelled the demand for extruded polystyrene across various applications. Moreover, the emphasis on retrofitting existing buildings for energy efficiency has further boosted the usage of extruded polystyrene insulation, solidifying Europe's dominance in the extruded polystyrene market in 2022.

Extruded Polystyrene Market by Region

To know about the assumptions considered for the study, download the pdf brochure

Key Market Players

The key players profiled in the report include Kingspan Group PLC (Ireland), Owens Corning (US), BASF SE (Germany), Synthos S.A. (Poland), Ravago S.A. (Belgium), among others, are the key manufacturers that hold major market share in the last few years. A major focus was given to partnerships, collaborations, and new product development due to the changing requirements of users across the world.

Get online access to the report on the World's First Market Intelligence Cloud

  • Easy to Download Historical Data & Forecast Numbers
  • Company Analysis Dashboard for high growth potential opportunities
  • Research Analyst Access for customization & queries
  • Competitor Analysis with Interactive dashboard
  • Latest News, Updates & Trend analysis
Request Sample

Scope of the Report

Report Metric

Details

Years considered for the study

2017–2028

Base year considered

2022

Forecast period

2023–2028

Units considered

Value (USD Million) and Volume (Thousand Cubic Meter)

Segments Covered

Application, End-use Industry, and Region

Regions covered

Asia Pacific, North America, Europe, Middle East & Africa, and South America

Companies profiled

Kingspan Group PLC (Ireland), Owens Corning (US), BASF SE (Germany), Synthos S.A. (Poland), Ravago S.A. (Belgium), Saint-Gobain (France), Dupont de Nemours, Inc. (US), Dow Inc. (US), Kaneka Corporation (Japan), and Supreme Petrochem Ltd. (India)

This report categorizes the global extruded polystyrene market based on application, end-use industry, and region.

Based on application, the extruded polystyrene market has been segmented as follows:
  • Foundation
  • Basement
  • Below Ground
  • Roof
  • Wall
  • Floor & Ceiling
  • Others
  • Pipes
  • Marine Insulation
  • Utility Lines Insulation
Based on the end-use industry, the extruded polystyrene market has been segmented as follows:
  • Residential
  • Commercial
  • Others
  • Roads
  • Highways
  • Railways
  • Runways
Based on region, the extruded polystyrene market has been segmented as follows:
  • Asia Pacific
  • North America
  • Europe
  • Middle East & Arica
  • South America

Recent Developments

  • In 2023, Owens Corning expanded its presence in Arkansas with a new 150,000-square-foot facility in Russellville, creating 50 new jobs over two years. The expansion will help the company capture a major market share.
  • In 2020, Owens Corning announced a new line of extruded polystyrene foam insulation products called Foamular NGX. The proprietary blowing agent in the products delivers a 90% reduction in global warming potential (GWP) without sacrificing product performance. It will help the company to expand its product line.

Frequently Asked Questions (FAQ):

To speak to our analyst for a discussion on the above findings, click Speak to Analyst

TABLE OF CONTENTS
 
1 INTRODUCTION (Page No. - 38)
    1.1 STUDY OBJECTIVES 
    1.2 MARKET DEFINITION 
           1.2.1 EXTRUDED POLYSTYRENE MARKET: INCLUSIONS AND EXCLUSIONS
           1.2.2 EXTRUDED POLYSTYRENE MARKET: DEFINITION AND INCLUSIONS, BY APPLICATION
           1.2.3 EXTRUDED POLYSTYRENE MARKET: DEFINITION AND INCLUSIONS, BY END-USE INDUSTRY
    1.3 MARKET SCOPE 
           1.3.1 EXTRUDED POLYSTYRENE MARKET SEGMENTATION
           1.3.2 REGIONAL SCOPE
    1.4 YEARS CONSIDERED 
    1.5 CURRENCY CONSIDERED 
    1.6 UNITS CONSIDERED 
    1.7 STAKEHOLDERS 
 
2 RESEARCH METHODOLOGY (Page No. - 42)
    2.1 RESEARCH DATA 
          FIGURE 1 EXTRUDED POLYSTYRENE MARKET: RESEARCH DESIGN
           2.1.1 SECONDARY DATA
           2.1.2 PRIMARY DATA
                    2.1.2.1 Primary interviews–demand and supply sides
                    2.1.2.2 Key industry insights
                    2.1.2.3 Breakdown of primary interviews
    2.2 MARKET SIZE ESTIMATION 
           2.2.1 BOTTOM-UP APPROACH
                    FIGURE 2 MARKET SIZE ESTIMATION METHODOLOGY: APPROACH 1 (SUPPLY SIDE) - COLLECTIVE SHARE OF KEY PLAYERS
                    FIGURE 3 MARKET SIZE ESTIMATION METHODOLOGY: APPROACH 2 (SUPPLY SIDE) - COLLECTIVE REVENUE OF ALL PRODUCTS (BOTTOM-UP)
                    FIGURE 4 MARKET SIZE ESTIMATION METHODOLOGY: APPROACH 3 (DEMAND SIDE) - END-USE INDUSTRY (BOTTOM-UP)
           2.2.2 TOP-DOWN APPROACH
                    FIGURE 5 MARKET SIZE ESTIMATION METHODOLOGY: APPROACH 4 – TOP DOWN
                    FIGURE 6 BASE NUMBER CALCULATION AND VALIDATION APPROACH USING PARENT MARKET – 2022
    2.3 DATA TRIANGULATION 
          FIGURE 7 EXTRUDED POLYSTYRENE MARKET: DATA TRIANGULATION
    2.4 GROWTH RATE ASSUMPTIONS/GROWTH FORECAST 
           2.4.1 SUPPLY-SIDE ANALYSIS
                    FIGURE 8 MARKET CAGR PROJECTIONS FROM SUPPLY SIDE
           2.4.2 DEMAND-SIDE ANALYSIS
                    FIGURE 9 MARKET GROWTH PROJECTIONS FROM DEMAND-SIDE DRIVERS AND OPPORTUNITIES
    2.5 FACTOR ANALYSIS 
    2.6 IMPACT OF RECESSION 
    2.7 ASSUMPTIONS 
    2.8 LIMITATIONS 
    2.9 RISK ASSESSMENT 
          TABLE 1 EXTRUDED POLYSTYRENE MARKET: RISK ASSESSMENT
 
3 EXECUTIVE SUMMARY (Page No. - 54)
    FIGURE 10 FOUNDATION WAS LARGEST APPLICATION OF EXTRUDED POLYSTYRENE MARKET IN 2022
    FIGURE 11 RESIDENTIAL TO BE LARGEST END-USE INDUSTRY OF EXTRUDED POLYSTYRENE DURING FORECAST PERIOD
    FIGURE 12 EUROPE ACCOUNTED FOR LARGEST SHARE OF EXTRUDED POLYSTYRENE MARKET IN 2022
 
4 PREMIUM INSIGHTS (Page No. - 57)
    4.1 ATTRACTIVE OPPORTUNITIES FOR PLAYERS IN EXTRUDED POLYSTYRENE MARKET 
          FIGURE 13 EUROPE TO BE LARGEST MARKET FOR EXTRUDED POLYSTYRENE
    4.2 EXTRUDED POLYSTYRENE MARKET, BY REGION 
          FIGURE 14 ASIA PACIFIC TO RECORD HIGHEST CAGR DURING FORECAST PERIOD
    4.3 EUROPE: EXTRUDED POLYSTYRENE MARKET, BY COUNTRY AND APPLICATION 
          FIGURE 15 FOUNDATION AND GERMANY ACCOUNTED FOR LARGEST SHARES OF EUROPE EXTRUDED POLYSTYRENE MARKET IN 2022
    4.4 EXTRUDED POLYSTYRENE MARKET, BY END-USE INDUSTRY AND REGION 
          FIGURE 16 RESIDENTIAL SEGMENT LED EXTRUDED POLYSTYRENE MARKET IN 2022
    4.5 EXTRUDED POLYSTYRENE MARKET, BY KEY COUNTRIES 
          FIGURE 17 MALAYSIA TO REGISTER HIGHEST CAGR DURING FORECAST PERIOD
 
5 MARKET OVERVIEW (Page No. - 60)
    5.1 INTRODUCTION 
    5.2 MARKET DYNAMICS 
          FIGURE 18 DRIVERS, RESTRAINTS, OPPORTUNITIES, AND CHALLENGES IN EXTRUDED POLYSTYRENE MARKET
           5.2.1 DRIVERS
                    5.2.1.1 Growing construction industries in developing nations
                                TABLE 2 10 MEGA PROJECTS IN INDIA
                    5.2.1.2 Increasing focus on sustainability and green building
                    5.2.1.3 Expanding applications in infrastructure projects
                    5.2.1.4 Advancements in manufacturing technologies
           5.2.2 RESTRAINTS
                    5.2.2.1 Environmental concerns and regulatory pressures
                    5.2.2.2 Availability of high-performance substitute
           5.2.3 OPPORTUNITIES
                    5.2.3.1 Easy recyclability of polystyrene products
                    5.2.3.2 Consumer preference for longevity
           5.2.4 CHALLENGES
                    5.2.4.1 Fluctuations in raw material cost and supply
    5.3 PORTER’S FIVE FORCES ANALYSIS 
          FIGURE 19 EXTRUDED POLYSTYRENE MARKET: PORTER’S FIVE FORCES ANALYSIS
           5.3.1 THREAT OF NEW ENTRANTS
           5.3.2 THREAT OF SUBSTITUTES
           5.3.3 BARGAINING POWER OF SUPPLIERS
           5.3.4 BARGAINING POWER OF BUYERS
           5.3.5 INTENSITY OF COMPETITIVE RIVALRY
                    TABLE 3 EXTRUDED POLYSTYRENE MARKET: PORTER’S FIVE FORCES ANALYSIS
    5.4 MACROECONOMIC INDICATORS 
           5.4.1 GDP TRENDS AND FORECASTS OF MAJOR ECONOMIES
                    TABLE 4 GDP TRENDS AND FORECAST, BY MAJOR ECONOMIES, 2020–2028 (USD BILLION)
 
6 INDUSTRY TRENDS (Page No. - 68)
    6.1 SUPPLY CHAIN ANALYSIS 
          FIGURE 20 EXTRUDED POLYSTYRENE MARKET: SUPPLY CHAIN ANALYSIS
           6.1.1 RAW MATERIALS
           6.1.2 MANUFACTURING
           6.1.3 DISTRIBUTION NETWORK
           6.1.4 END-USE INDUSTRIES
    6.2 KEY STAKEHOLDERS AND BUYING CRITERIA 
           6.2.1 KEY STAKEHOLDERS IN BUYING PROCESS
                    FIGURE 21 INFLUENCE OF STAKEHOLDERS ON BUYING PROCESS IN TOP 3 END-USE INDUSTRIES
                    TABLE 5 INFLUENCE OF STAKEHOLDERS ON BUYING PROCESS IN TOP 3 END-USE INDUSTRIES (%)
           6.2.2 BUYING CRITERIA
                    FIGURE 22 KEY BUYING CRITERIA FOR TOP 3 END-USE INDUSTRIES
                    TABLE 6 KEY BUYING CRITERIA FOR TOP 3 END-USE INDUSTRIES
    6.3 PRICING ANALYSIS 
           6.3.1 AVERAGE SELLING PRICE TREND OF KEY PLAYERS, BY END-USE INDUSTRY
                    FIGURE 23 AVERAGE SELLING PRICE TREND OF KEY PLAYERS, BY END-USE INDUSTRY
                    TABLE 7 AVERAGE SELLING PRICE TREND OF KEY PLAYERS, BY END-USE INDUSTRY (USD THOUSAND/CUBIC METER)
           6.3.2 AVERAGE SELLING PRICE TREND, BY REGION
                    FIGURE 24 AVERAGE SELLING PRICE TREND OF EXTRUDED POLYSTYRENE, BY REGION (USD THOUSAND/CUBIC METER)
                    TABLE 8 AVERAGE SELLING PRICE TREND OF EXTRUDED POLYSTYRENE, BY REGION (USD THOUSAND/CUBIC METER)
    6.4 TRENDS/DISRUPTIONS IMPACTING CUSTOMER’S BUSINESS 
           6.4.1 REVENUE SHIFTS AND NEW REVENUE POCKETS FOR EXTRUDED POLYSTYRENE MARKET
          25 REVENUE SHIFT FOR EXTRUDED POLYSTYRENE MARKET
    6.5 EXTRUDED POLYSTYRENE MARKET: ECOSYSTEM 
          FIGURE 26 EXTRUDED POLYSTYRENE MARKET: ECOSYSTEM/MARKET MAP
          TABLE 9 EXTRUDED POLYSTYRENE MARKET: ROLE IN ECOSYSTEM
    6.6 TECHNOLOGY ANALYSIS 
           6.6.1 CONTINUOUS REACTIVE EXTRUSION (CRE) TECHNOLOGY
                    TABLE 10 BENEFITS OF CONTINUOUS REACTIVE EXTRUSION (CRE) TECHNOLOGY
    6.7 CASE STUDY ANALYSIS 
           6.7.1 CASE STUDY OF SAINT-GOBAIN
           6.7.2 CASE STUDY OF DOW INC.
           6.7.3 CASE STUDY OF BASF SE
    6.8 TRADE DATA STATISTICS 
           6.8.1 IMPORT SCENARIO OF EXTRUDED POLYSTYRENE
                    FIGURE 27 IMPORT OF EXTRUDED POLYSTYRENE, BY KEY COUNTRIES (2017–2022)
                    TABLE 11 IMPORT OF EXTRUDED POLYSTYRENE, BY REGION, 2017–2022 (USD MILLION)
           6.8.2 EXPORT SCENARIO OF EXTRUDED POLYSTYRENE
                    FIGURE 28 EXPORT OF EXTRUDED POLYSTYRENE, BY KEY COUNTRIES (2017–2022)
                    TABLE 12 EXPORT OF EXTRUDED POLYSTYRENE, BY REGION, 2017–2022 (USD MILLION)
    6.9 TARIFF AND REGULATORY LANDSCAPE 
           6.9.1 REGULATIONS FOR EXTRUDED POLYSTYRENE MARKET
                    TABLE 13 NORTH AMERICA: REGULATIONS FOR EXTRUDED POLYSTYRENE
                    TABLE 14 EUROPE: REGULATIONS FOR EXTRUDED POLYSTYRENE
                    TABLE 15 ASIA PACIFIC: REGULATIONS FOR EXTRUDED POLYSTYRENE
           6.9.2 REGULATORY BODIES, GOVERNMENT AGENCIES, AND OTHER ORGANIZATIONS
    6.10 KEY CONFERENCES AND EVENTS IN 2023–2024 
           TABLE 16 EXTRUDED POLYSTYRENE MARKET: KEY CONFERENCES & EVENTS
    6.11 PATENT ANALYSIS 
           6.11.1 APPROACH
           6.11.2 DOCUMENT TYPE
                     TABLE 17 PATENT STATUS: PATENT APPLICATIONS, LIMITED PATENTS, AND GRANTED PATENTS
                     FIGURE 29 PATENTS REGISTERED IN EXTRUDED POLYSTYRENE, 2012–2023
                     FIGURE 30 LIST OF MAJOR PATENTS FOR EXTRUDED POLYSTYRENE
           6.11.3 TOP APPLICANTS
                     TABLE 18 LIST OF MAJOR PATENTS OF EXTRUDED POLYSTYRENE
                     TABLE 19 PATENTS BY INEOS STYROLUTION GROUP GMBH
                     TABLE 20 PATENTS BY BASF SE
                     TABLE 21 PATENTS BY LG CHEM LTD
                     TABLE 22 TOP 10 PATENT OWNERS IN CHINA, 2012–2023
                     FIGURE 31 LEGAL STATUS OF PATENTS FILED IN EXTRUDED POLYSTYRENE MARKET
           6.11.4 JURISDICTION ANALYSIS
                     FIGURE 32 MAXIMUM PATENTS FILED IN JURISDICTION OF CHINA
 
7 EXTRUDED POLYSTYRENE MARKET, BY APPLICATION (Page No. - 92)
    7.1 INTRODUCTION 
          FIGURE 33 FOUNDATION SEGMENT TO LEAD EXTRUDED POLYSTYRENE MARKET DURING FORECAST PERIOD
          TABLE 23 EXTRUDED POLYSTYRENE MARKET, BY APPLICATION, 2017–2021 (THOUSAND CUBIC METERS)
          TABLE 24 EXTRUDED POLYSTYRENE MARKET, BY APPLICATION, 2022–2028 (THOUSAND CUBIC METERS)
          TABLE 25 EXTRUDED POLYSTYRENE MARKET, BY APPLICATION, 2017–2021 (USD MILLION)
          TABLE 26 EXTRUDED POLYSTYRENE MARKET, BY APPLICATION, 2022–2028 (USD MILLION)
    7.2 FOUNDATION 
           7.2.1 USE TO PREVENT ENERGY LOSS THROUGH BASEMENT OR FOUNDATION IN REAL ESTATE INDUSTRY TO DRIVE MARKET
                    TABLE 27 FOUNDATION: EXTRUDED POLYSTYRENE MARKET, BY REGION, 2017–2021 (THOUSAND CUBIC METERS)
                    TABLE 28 FOUNDATION: EXTRUDED POLYSTYRENE MARKET, BY REGION, 2022–2028 (THOUSAND CUBIC METERS)
                    TABLE 29 FOUNDATION: EXTRUDED POLYSTYRENE MARKET, BY REGION, 2017–2021 (USD MILLION)
                    TABLE 30 FOUNDATION: EXTRUDED POLYSTYRENE MARKET, BY REGION, 2022–2028 (USD MILLION)
    7.3 ROOF 
           7.3.1 ERADICATING MOISTURE CONDENSATION WITHIN BUILDING STRUCTURES TO DRIVE MARKET
                    TABLE 31 ROOF: EXTRUDED POLYSTYRENE MARKET, BY REGION, 2017–2021 (THOUSAND CUBIC METERS)
                    TABLE 32 ROOF: EXTRUDED POLYSTYRENE MARKET, BY REGION, 2022–2028 (THOUSAND CUBIC METERS)
                    TABLE 33 ROOF: EXTRUDED POLYSTYRENE MARKET, BY REGION, 2017–2021 (USD MILLION)
                    TABLE 34 ROOF: EXTRUDED POLYSTYRENE MARKET, BY REGION, 2022–2028 (USD MILLION)
    7.4 WALL 
           7.4.1 SAFEGUARDING COMPLETE STRUCTURAL INTEGRITY OF WALLS TO DRIVE MARKET
                    TABLE 35 WALLS: EXTRUDED POLYSTYRENE MARKET, BY REGION, 2017–2021 (THOUSAND CUBIC METERS)
                    TABLE 36 WALLS: EXTRUDED POLYSTYRENE MARKET, BY REGION, 2022–2028 (THOUSAND CUBIC METERS)
                    TABLE 37 WALLS: EXTRUDED POLYSTYRENE MARKET, BY REGION, 2017–2021 (USD MILLION)
                    TABLE 38 WALLS: EXTRUDED POLYSTYRENE MARKET, BY REGION,2022–2028 (USD MILLION)
    7.5 FLOOR & CEILING 
           7.5.1 PREVENTING HVAC SYSTEMS FROM ENERGY LOSS TO DRIVE MARKET
                    TABLE 39 FLOOR & CEILING: EXTRUDED POLYSTYRENE MARKET, BY REGION, 2017–2021 (THOUSAND CUBIC METERS)
                    TABLE 40 FLOOR & CEILING: EXTRUDED POLYSTYRENE MARKET, BY REGION, 2022–2028 (THOUSAND CUBIC METERS)
                    TABLE 41 FLOOR & CEILING: EXTRUDED POLYSTYRENE MARKET, BY REGION, 2017–2021 (USD MILLION)
                    TABLE 42 FLOOR & CEILING: EXTRUDED POLYSTYRENE MARKET, BY REGION, 2022–2028 (USD MILLION)
    7.6 OTHER APPLICATIONS 
           7.6.1 PIPES
           7.6.2 MARINE INSULATION
           7.6.3 UTILITY INSULATION
                    TABLE 43 OTHER APPLICATIONS: EXTRUDED POLYSTYRENE MARKET, BY REGION, 2017–2021 (THOUSAND CUBIC METERS)
                    TABLE 44 OTHER APPLICATIONS: EXTRUDED POLYSTYRENE MARKET, BY REGION, 2022–2028 (THOUSAND CUBIC METERS)
                    TABLE 45 OTHER APPLICATIONS: EXTRUDED POLYSTYRENE MARKET, BY REGION, 2017–2021 (USD MILLION)
                    TABLE 46 OTHER APPLICATIONS: EXTRUDED POLYSTYRENE MARKET, BY REGION, 2022–2028 (USD MILLION)
 
8 EXTRUDED POLYSTYRENE MARKET, BY END-USE INDUSTRY (Page No. - 105)
    8.1 INTRODUCTION 
          FIGURE 34 RESIDENTIAL TO BE LARGEST END-USE INDUSTRY OF EXTRUDED POLYSTYRENE MARKET DURING FORECAST PERIOD
          TABLE 47 EXTRUDED POLYSTYRENE MARKET, BY END-USE INDUSTRY, 2017–2021 (THOUSAND CUBIC METERS)
          TABLE 48 EXTRUDED POLYSTYRENE MARKET, BY END-USE INDUSTRY, 2022–2028 (THOUSAND CUBIC METERS)
          TABLE 49 EXTRUDED POLYSTYRENE MARKET, BY END-USE INDUSTRY, 2017–2021 (USD MILLION)
          TABLE 50 EXTRUDED POLYSTYRENE MARKET, BY END-USE INDUSTRY, 2022–2028 (USD MILLION)
    8.2 RESIDENTIAL 
           8.2.1 INCREASING POPULATION AND GROWING URBANIZATION TO DRIVE MARKET
                    TABLE 51 RESIDENTIAL: EXTRUDED POLYSTYRENE MARKET, BY REGION, 2017–2021 (THOUSAND CUBIC METERS)
                    TABLE 52 RESIDENTIAL: EXTRUDED POLYSTYRENE MARKET, BY REGION, 2022–2028 (THOUSAND CUBIC METERS)
                    TABLE 53 RESIDENTIAL: EXTRUDED POLYSTYRENE MARKET, BY REGION, 2017–2021 (USD MILLION)
                    TABLE 54 RESIDENTIAL: EXTRUDED POLYSTYRENE MARKET, BY REGION, 2022–2028 (USD MILLION)
    8.3 COMMERCIAL 
           8.3.1 GROWING DEMAND FOR COMMERCIAL CONSTRUCTION TO DRIVE MARKET
                    TABLE 55 COMMERCIAL: EXTRUDED POLYSTYRENE MARKET, BY REGION, 2017–2021 (THOUSAND CUBIC METERS)
                    TABLE 56 COMMERCIAL: EXTRUDED POLYSTYRENE MARKET, BY REGION, 2022–2028 (THOUSAND CUBIC METERS)
                    TABLE 57 COMMERCIAL: EXTRUDED POLYSTYRENE MARKET, BY REGION, 2017–2021 (USD MILLION)
                    TABLE 58 COMMERCIAL: EXTRUDED POLYSTYRENE MARKET, BY REGION, 2022–2028 (USD MILLION)
    8.4 OTHER END-USE INDUSTRIES 
          TABLE 59 OTHER END-USE INDUSTRIES: EXTRUDED POLYSTYRENE MARKET, BY REGION, 2017–2021 (THOUSAND CUBIC METERS)
          TABLE 60 OTHER END-USE INDUSTRIES: EXTRUDED POLYSTYRENE MARKET, BY REGION, 2022–2028 (THOUSAND CUBIC METERS)
          TABLE 61 OTHER END-USE INDUSTRIES: EXTRUDED POLYSTYRENE MARKET, BY REGION, 2017–2021 (USD MILLION)
          TABLE 62 OTHER END-USE INDUSTRIES: EXTRUDED POLYSTYRENE MARKET, BY REGION, 2022–2028 (USD MILLION)
 
9 EXTRUDED POLYSTYRENE MARKET, BY REGION (Page No. - 113)
    9.1 INTRODUCTION 
          FIGURE 35 ASIA PACIFIC TO BE FASTEST-GROWING MARKET DURING FORECAST PERIOD
          TABLE 63 EXTRUDED POLYSTYRENE MARKET, BY REGION, 2017–2021 (THOUSAND CUBIC METERS)
          TABLE 64 EXTRUDED POLYSTYRENE MARKET, BY REGION, 2022–2028 (THOUSAND CUBIC METERS)
          TABLE 65 EXTRUDED POLYSTYRENE MARKET, BY REGION, 2017–2021 (USD MILLION)
          TABLE 66 EXTRUDED POLYSTYRENE MARKET, BY REGION, 2022–2028 (USD MILLION)
    9.2 ASIA PACIFIC 
          FIGURE 36 ASIA PACIFIC: EXTRUDED POLYSTYRENE MARKET SNAPSHOT
           9.2.1 RECESSION IMPACT ON ASIA PACIFIC
           9.2.2 ASIA PACIFIC EXTRUDED POLYSTYRENE MARKET, BY APPLICATION
                    TABLE 67 ASIA PACIFIC: EXTRUDED POLYSTYRENE MARKET, BY APPLICATION, 2017–2021 (THOUSAND CUBIC METERS)
                    TABLE 68 ASIA PACIFIC: EXTRUDED POLYSTYRENE MARKET, BY APPLICATION, 2022–2028 (THOUSAND CUBIC METERS)
                    TABLE 69 ASIA PACIFIC: EXTRUDED POLYSTYRENE MARKET, BY APPLICATION, 2017–2021 (USD MILLION)
                    TABLE 70 ASIA PACIFIC: EXTRUDED POLYSTYRENE MARKET, BY APPLICATION, 2022–2028 (USD MILLION)
           9.2.3 ASIA PACIFIC EXTRUDED POLYSTYRENE MARKET, BY END-USE INDUSTRY
                    TABLE 71 ASIA PACIFIC: EXTRUDED POLYSTYRENE MARKET, BY END-USE INDUSTRY, 2017–2021 (THOUSAND CUBIC METERS)
                    TABLE 72 ASIA PACIFIC: EXTRUDED POLYSTYRENE MARKET, BY END-USE INDUSTRY, 2022–2028 (THOUSAND CUBIC METERS)
                    TABLE 73 ASIA PACIFIC: EXTRUDED POLYSTYRENE MARKET, BY END-USE INDUSTRY, 2017–2021 (USD MILLION)
                    TABLE 74 ASIA PACIFIC: EXTRUDED POLYSTYRENE MARKET, BY END-USE INDUSTRY, 2022–2028 (USD MILLION)
           9.2.4 ASIA PACIFIC EXTRUDED POLYSTYRENE MARKET, BY COUNTRY
                    TABLE 75 ASIA PACIFIC: EXTRUDED POLYSTYRENE MARKET, BY COUNTRY, 2017–2021 (THOUSAND CUBIC METERS)
                    TABLE 76 ASIA PACIFIC: EXTRUDED POLYSTYRENE MARKET, BY COUNTRY, 2022–2028 (THOUSAND CUBIC METERS)
                    TABLE 77 ASIA PACIFIC: EXTRUDED POLYSTYRENE MARKET, BY COUNTRY, 2017–2021 (USD MILLION)
                    TABLE 78 ASIA PACIFIC: EXTRUDED POLYSTYRENE MARKET, BY COUNTRY, 2022–2028 (USD MILLION)
                    9.2.4.1 China
                               9.2.4.1.1 Energy conservation law to reduce energy losses in buildings to drive demand
                                              TABLE 79 CHINA: EXTRUDED POLYSTYRENE MARKET, BY END-USE INDUSTRY, 2017–2021 (THOUSAND CUBIC METERS)
                                              TABLE 80 CHINA: EXTRUDED POLYSTYRENE MARKET, BY END-USE INDUSTRY, 2022–2028 (THOUSAND CUBIC METERS)
                                              TABLE 81 CHINA: EXTRUDED POLYSTYRENE MARKET, BY END-USE INDUSTRY, 2017–2021 (USD MILLION)
                                              TABLE 82 CHINA: EXTRUDED POLYSTYRENE MARKET, BY END-USE INDUSTRY, 2022–2028 (USD MILLION)
                    9.2.4.2 Japan
                               9.2.4.2.1 Stringent energy conservation goals to drive market
                                              TABLE 83 JAPAN: EXTRUDED POLYSTYRENE MARKET, BY END-USE INDUSTRY, 2017–2021 (THOUSAND CUBIC METERS)
                                              TABLE 84 JAPAN: EXTRUDED POLYSTYRENE MARKET, BY END-USE INDUSTRY, 2022–2028 (THOUSAND CUBIC METERS)
                                              TABLE 85 JAPAN: EXTRUDED POLYSTYRENE MARKET, BY END-USE INDUSTRY, 2017–2021 (USD MILLION)
                                              TABLE 86 JAPAN: EXTRUDED POLYSTYRENE MARKET, BY END-USE INDUSTRY, 2022–2028 (USD MILLION)
                    9.2.4.3 India
                               9.2.4.3.1 Growing middle-class population and urbanization to drive market
                                              TABLE 87 INDIA: EXTRUDED POLYSTYRENE MARKET, BY END-USE INDUSTRY, 2017–2021 (THOUSAND CUBIC METERS)
                                              TABLE 88 INDIA: EXTRUDED POLYSTYRENE MARKET, BY END-USE INDUSTRY, 2022–2028 (THOUSAND CUBIC METERS)
                                              TABLE 89 INDIA: EXTRUDED POLYSTYRENE MARKET, BY END-USE INDUSTRY, 2017–2021 (USD MILLION)
                                              TABLE 90 INDIA: EXTRUDED POLYSTYRENE MARKET, BY END-USE INDUSTRY, 2022–2028 (USD MILLION)
                    9.2.4.4 South Korea
                               9.2.4.4.1 Low domestic construction activities to hamper market growth
                                              TABLE 91 SOUTH KOREA: EXTRUDED POLYSTYRENE MARKET, BY END-USE INDUSTRY, 2017–2021 (THOUSAND CUBIC METERS)
                                              TABLE 92 SOUTH KOREA: EXTRUDED POLYSTYRENE MARKET, BY END-USE INDUSTRY, 2022–2028 (THOUSAND CUBIC METERS)
                                              TABLE 93 SOUTH KOREA: EXTRUDED POLYSTYRENE MARKET, BY END-USE INDUSTRY, 2017–2021 (USD MILLION)
                                              TABLE 94 SOUTH KOREA: EXTRUDED POLYSTYRENE MARKET, BY END-USE INDUSTRY, 2022–2028 (USD MILLION)
                    9.2.4.5 Thailand
                               9.2.4.5.1 New residential constructions to drive market due to residential building standards
                                              TABLE 95 THAILAND: EXTRUDED POLYSTYRENE MARKET, BY END-USE INDUSTRY, 2017–2021 (THOUSAND CUBIC METERS)
                                              TABLE 96 THAILAND: EXTRUDED POLYSTYRENE MARKET, BY END-USE INDUSTRY, 2022–2028 (THOUSAND CUBIC METERS)
                                              TABLE 97 THAILAND: EXTRUDED POLYSTYRENE MARKET, BY END-USE INDUSTRY, 2017–2021 (USD MILLION)
                                              TABLE 98 THAILAND: EXTRUDED POLYSTYRENE MARKET, BY END-USE INDUSTRY, 2022–2028 (USD MILLION)
                    9.2.4.6 Indonesia
                               9.2.4.6.1 Manufacturers adopting sustainable practices to reduce CO2 emission & decrease waste to drive market
                                              TABLE 99 INDONESIA: EXTRUDED POLYSTYRENE MARKET, BY END-USE INDUSTRY, 2017–2021 (THOUSAND CUBIC METERS)
                                              TABLE 100 INDONESIA: EXTRUDED POLYSTYRENE MARKET, BY END-USE INDUSTRY, 2022–2028 (THOUSAND CUBIC METERS)
                                              TABLE 101 INDONESIA: EXTRUDED POLYSTYRENE MARKET, BY END-USE INDUSTRY, 2017–2021 (USD MILLION)
                                              TABLE 102 INDONESIA: EXTRUDED POLYSTYRENE MARKET, BY END-USE INDUSTRY, 2022–2028 (USD MILLION)
                    9.2.4.7 Malaysia
                               9.2.4.7.1 Rural projects and manufacturing sector to drive demand
                                              TABLE 103 MALAYSIA: EXTRUDED POLYSTYRENE MARKET, BY END-USE INDUSTRY, 2017–2021 (THOUSAND CUBIC METERS)
                                              TABLE 104 MALAYSIA: EXTRUDED POLYSTYRENE MARKET, BY END-USE INDUSTRY, 2022–2028 (THOUSAND CUBIC METERS)
                                              TABLE 105 MALAYSIA: EXTRUDED POLYSTYRENE MARKET, BY END-USE INDUSTRY, 2017–2021 (USD MILLION)
                                              TABLE 106 MALAYSIA: EXTRUDED POLYSTYRENE MARKET, BY END-USE INDUSTRY, 2022–2028 (USD MILLION)
    9.3 NORTH AMERICA 
          FIGURE 37 NORTH AMERICA: EXTRUDED POLYSTYRENE MARKET SNAPSHOT
           9.3.1 RECESSION IMPACT ON NORTH AMERICA
           9.3.2 NORTH AMERICA EXTRUDED POLYSTYRENE MARKET, BY APPLICATION
                    TABLE 107 NORTH AMERICA: EXTRUDED POLYSTYRENE MARKET, BY APPLICATION, 2017–2021 (THOUSAND CUBIC METERS)
                    TABLE 108 NORTH AMERICA: EXTRUDED POLYSTYRENE MARKET, BY APPLICATION, 2022–2028 (THOUSAND CUBIC METERS)
                    TABLE 109 NORTH AMERICA: EXTRUDED POLYSTYRENE MARKET, BY APPLICATION, 2017–2021 (USD MILLION)
                    TABLE 110 NORTH AMERICA: EXTRUDED POLYSTYRENE MARKET, BY APPLICATION, 2022–2028 (USD MILLION)
           9.3.3 NORTH AMERICA EXTRUDED POLYSTYRENE MARKET, BY END-USE INDUSTRY
                    TABLE 111 NORTH AMERICA: EXTRUDED POLYSTYRENE MARKET, BY END-USE INDUSTRY, 2017–2021 (THOUSAND CUBIC METERS)
                    TABLE 112 NORTH AMERICA: EXTRUDED POLYSTYRENE MARKET, BY END-USE INDUSTRY, 2022–2028 (THOUSAND CUBIC METERS)
                    TABLE 113 NORTH AMERICA: EXTRUDED POLYSTYRENE MARKET, BY END-USE INDUSTRY, 2017–2021 (USD MILLION)
                    TABLE 114 NORTH AMERICA: EXTRUDED POLYSTYRENE MARKET, BY END-USE INDUSTRY, 2022–2028 (USD MILLION)
           9.3.4 NORTH AMERICA EXTRUDED POLYSTYRENE MARKET, BY COUNTRY
                    TABLE 115 NORTH AMERICA: EXTRUDED POLYSTYRENE MARKET, BY COUNTRY, 2017–2021 (THOUSAND CUBIC METERS)
                    TABLE 116 NORTH AMERICA: EXTRUDED POLYSTYRENE MARKET, BY COUNTRY, 2022–2028 (THOUSAND CUBIC METERS)
                    TABLE 117 NORTH AMERICA: EXTRUDED POLYSTYRENE MARKET, BY COUNTRY, 2017–2021 (USD MILLION)
                    TABLE 118 NORTH AMERICA: EXTRUDED POLYSTYRENE MARKET, BY COUNTRY, 2022–2028 (USD MILLION)
                    9.3.4.1 US
                               9.3.4.1.1 Growth of residential housing sector to drive market
                                              TABLE 119 US: EXTRUDED POLYSTYRENE MARKET, BY END-USE INDUSTRY, 2017–2021 (THOUSAND CUBIC METERS)
                                              TABLE 120 US: EXTRUDED POLYSTYRENE MARKET, BY END-USE INDUSTRY, 2022–2028 (THOUSAND CUBIC METERS)
                                              TABLE 121 US: EXTRUDED POLYSTYRENE MARKET, BY END-USE INDUSTRY, 2017–2021 (USD MILLION)
                                              TABLE 122 US: EXTRUDED POLYSTYRENE MARKET, BY END-USE INDUSTRY, 2022–2028 (USD MILLION)
                    9.3.4.2 Canada
                               9.3.4.2.1 Economic and construction industry growth to drive market
                                              TABLE 123 CANADA: EXTRUDED POLYSTYRENE MARKET, BY END-USE INDUSTRY, 2017–2021 (THOUSAND CUBIC METERS)
                                              TABLE 124 CANADA: EXTRUDED POLYSTYRENE MARKET, BY END-USE INDUSTRY, 2022–2028 (THOUSAND CUBIC METERS)
                                              TABLE 125 CANADA: EXTRUDED POLYSTYRENE MARKET, BY END-USE INDUSTRY, 2017–2021 (USD MILLION)
                                              TABLE 126 CANADA: EXTRUDED POLYSTYRENE MARKET, BY END-USE INDUSTRY, 2022–2028 (USD MILLION)
                    9.3.4.3 Mexico
                               9.3.4.3.1 Boost from government for green buildings to increase demand
                                              TABLE 127 MEXICO: EXTRUDED POLYSTYRENE MARKET, BY END-USE INDUSTRY, 2017–2021 (THOUSAND CUBIC METERS)
                                              TABLE 128 MEXICO: EXTRUDED POLYSTYRENE MARKET, BY END-USE INDUSTRY, 2022–2028 (THOUSAND CUBIC METERS)
                                              TABLE 129 MEXICO: EXTRUDED POLYSTYRENE MARKET, BY END-USE INDUSTRY, 2017–2021 (USD MILLION)
                                              TABLE 130 MEXICO: EXTRUDED POLYSTYRENE MARKET, BY END-USE INDUSTRY, 2022–2028 (USD MILLION)
    9.4 EUROPE 
          FIGURE 38 EUROPE: EXTRUDED POLYSTYRENE MARKET SNAPSHOT
           9.4.1 RECESSION IMPACT ON EUROPE
           9.4.2 EUROPE EXTRUDED POLYSTYRENE MARKET, BY APPLICATION
                    TABLE 131 EUROPE: EXTRUDED POLYSTYRENE MARKET, BY APPLICATION, 2017–2021 (THOUSAND CUBIC METERS)
                    TABLE 132 EUROPE: EXTRUDED POLYSTYRENE MARKET, BY APPLICATION, 2022–2028 (THOUSAND CUBIC METERS)
                    TABLE 133 EUROPE: EXTRUDED POLYSTYRENE MARKET, BY APPLICATION, 2017–2021 (USD MILLION)
                    TABLE 134 EUROPE: EXTRUDED POLYSTYRENE MARKET, BY APPLICATION, 2022–2028 (USD MILLION)
           9.4.3 EUROPE EXTRUDED POLYSTYRENE MARKET, BY END-USE INDUSTRY
                    TABLE 135 EUROPE: EXTRUDED POLYSTYRENE MARKET, BY END-USE INDUSTRY, 2017–2021 (THOUSAND CUBIC METERS)
                    TABLE 136 EUROPE: EXTRUDED POLYSTYRENE MARKET, BY END-USE INDUSTRY, 2022–2028 (THOUSAND CUBIC METERS)
                    TABLE 137 EUROPE: EXTRUDED POLYSTYRENE MARKET, BY END-USE INDUSTRY, 2017–2021 (USD MILLION)
                    TABLE 138 EUROPE: EXTRUDED POLYSTYRENE MARKET, BY END-USE INDUSTRY, 2022–2028 (USD MILLION)
           9.4.4 EUROPE EXTRUDED POLYSTYRENE MARKET, BY COUNTRY
                    TABLE 139 EUROPE: EXTRUDED POLYSTYRENE MARKET, BY COUNTRY, 2017–2021 (THOUSAND CUBIC METERS)
                    TABLE 140 EUROPE: EXTRUDED POLYSTYRENE MARKET, BY COUNTRY, 2022–2028 (THOUSAND CUBIC METERS)
                    TABLE 141 EUROPE: EXTRUDED POLYSTYRENE MARKET, BY COUNTRY, 2017–2021 (USD MILLION)
                    TABLE 142 EUROPE: EXTRUDED POLYSTYRENE MARKET, BY COUNTRY, 2022–2028 (USD MILLION)
                    9.4.4.1 Germany
                               9.4.4.1.1 Increasing focus on construction industry to drive market
                                              TABLE 143 GERMANY: EXTRUDED POLYSTYRENE MARKET, BY END-USE INDUSTRY, 2017–2021 (THOUSAND CUBIC METERS)
                                              TABLE 144 GERMANY: EXTRUDED POLYSTYRENE MARKET, BY END-USE INDUSTRY, 2022–2028 (THOUSAND CUBIC METERS)
                                              TABLE 145 GERMANY: EXTRUDED POLYSTYRENE MARKET, BY END-USE INDUSTRY, 2017–2021 (USD MILLION)
                                              TABLE 146 GERMANY: EXTRUDED POLYSTYRENE MARKET, BY END-USE INDUSTRY, 2022–2028 (USD MILLION)
                    9.4.4.2 UK
                               9.4.4.2.1 New residential and commercial infrastructure to drive market
                                              TABLE 147 UK: EXTRUDED POLYSTYRENE MARKET, BY END-USE INDUSTRY, 2017–2021 (THOUSAND CUBIC METERS)
                                              TABLE 148 UK: EXTRUDED POLYSTYRENE MARKET, BY END-USE INDUSTRY, 2022–2028 (THOUSAND CUBIC METERS)
                                              TABLE 149 UK: EXTRUDED POLYSTYRENE MARKET, BY END-USE INDUSTRY, 2017–2021 (USD MILLION)
                                              TABLE 150 UK: EXTRUDED POLYSTYRENE MARKET, BY END-USE INDUSTRY, 2022–2028 (USD MILLION)
                    9.4.4.3 France
                               9.4.4.3.1 EU energy conservation and emission reduction goals to drive market
                                              TABLE 151 FRANCE: EXTRUDED POLYSTYRENE MARKET, BY END-USE INDUSTRY, 2017–2021 (THOUSAND CUBIC METERS)
                                              TABLE 152 FRANCE: EXTRUDED POLYSTYRENE MARKET, BY END-USE INDUSTRY, 2022–2028 (THOUSAND CUBIC METERS)
                                              TABLE 153 FRANCE: EXTRUDED POLYSTYRENE MARKET, BY END-USE INDUSTRY, 2017–2021 (USD MILLION)
                                              TABLE 154 FRANCE: EXTRUDED POLYSTYRENE MARKET, BY END-USE INDUSTRY, 2022–2028 (USD MILLION)
                    9.4.4.4 Italy
                               9.4.4.4.1 New construction projects to drive demand
                                              TABLE 155 ITALY: EXTRUDED POLYSTYRENE MARKET, BY END-USE INDUSTRY, 2017–2021 (THOUSAND CUBIC METERS)
                                              TABLE 156 ITALY: EXTRUDED POLYSTYRENE MARKET, BY END-USE INDUSTRY, 2022–2028 (THOUSAND CUBIC METERS)
                                              TABLE 157 ITALY: EXTRUDED POLYSTYRENE MARKET, BY END-USE INDUSTRY, 2017–2021 (USD MILLION)
                                              TABLE 158 ITALY: EXTRUDED POLYSTYRENE MARKET, BY END-USE INDUSTRY, 2022–2028 (USD MILLION)
                    9.4.4.5 Spain
                               9.4.4.5.1 Construction sector to drive demand
                                              TABLE 159 SPAIN: EXTRUDED POLYSTYRENE MARKET, BY END-USE INDUSTRY, 2017–2021 (THOUSAND CUBIC METERS)
                                              TABLE 160 SPAIN: EXTRUDED POLYSTYRENE MARKET, BY END-USE INDUSTRY, 2022–2028 (THOUSAND CUBIC METERS)
                                              TABLE 161 SPAIN: EXTRUDED POLYSTYRENE MARKET, BY END-USE INDUSTRY, 2017–2021 (USD MILLION)
                                              TABLE 162 SPAIN: EXTRUDED POLYSTYRENE MARKET, BY END-USE INDUSTRY, 2022–2028 (USD MILLION)
                    9.4.4.6 Poland
                               9.4.4.6.1 Polish infrastructure industry to drive market
                                              TABLE 163 POLAND: EXTRUDED POLYSTYRENE MARKET, BY END-USE INDUSTRY, 2017–2021 (THOUSAND CUBIC METERS)
                                              TABLE 164 POLAND: EXTRUDED POLYSTYRENE MARKET, BY END-USE INDUSTRY, 2022–2028 (THOUSAND CUBIC METERS)
                                              TABLE 165 POLAND: EXTRUDED POLYSTYRENE MARKET, BY END-USE INDUSTRY, 2017–2021 (USD MILLION)
                                              TABLE 166 POLAND: EXTRUDED POLYSTYRENE MARKET, BY END-USE INDUSTRY, 2022–2028 (USD MILLION)
                    9.4.4.7 Russia
                               9.4.4.7.1 Demand for thermal insulation, water-resistant extruded polystyrene board, and other construction materials to drive market
                                              TABLE 167 RUSSIA: EXTRUDED POLYSTYRENE MARKET, BY END-USE INDUSTRY, 2017–2021 (THOUSAND CUBIC METERS)
                                              TABLE 168 RUSSIA: EXTRUDED POLYSTYRENE MARKET, BY END-USE INDUSTRY, 2022–2028 (THOUSAND CUBIC METERS)
                                              TABLE 169 RUSSIA: EXTRUDED POLYSTYRENE MARKET, BY END-USE INDUSTRY, 2017–2021 (USD MILLION)
                                              TABLE 170 RUSSIA: EXTRUDED POLYSTYRENE MARKET, BY END-USE INDUSTRY, 2022–2028 (USD MILLION)
                    9.4.4.8 Turkey
                               9.4.4.8.1 Growth in domestic construction sector to increase demand
                                              TABLE 171 TURKEY: EXTRUDED POLYSTYRENE MARKET, BY END-USE INDUSTRY, 2017–2021 (THOUSAND CUBIC METERS)
                                              TABLE 172 TURKEY: EXTRUDED POLYSTYRENE MARKET, BY END-USE INDUSTRY, 2022–2028 (THOUSAND CUBIC METERS)
                                              TABLE 173 TURKEY: EXTRUDED POLYSTYRENE MARKET, BY END-USE INDUSTRY, 2017–2021 (USD MILLION)
                                              TABLE 174 TURKEY: EXTRUDED POLYSTYRENE MARKET, BY END-USE INDUSTRY, 2022–2028 (USD MILLION)
    9.5 SOUTH AMERICA 
           9.5.1 RECESSION IMPACT ON SOUTH AMERICA
           9.5.2 SOUTH AMERICA EXTRUDED POLYSTYRENE MARKET, BY APPLICATION
                    TABLE 175 SOUTH AMERICA: EXTRUDED POLYSTYRENE MARKET, BY APPLICATION, 2017–2021 (THOUSAND CUBIC METERS)
                    TABLE 176 SOUTH AMERICA: EXTRUDED POLYSTYRENE MARKET, BY APPLICATION, 2022–2028 (THOUSAND CUBIC METERS)
                    TABLE 177 SOUTH AMERICA: EXTRUDED POLYSTYRENE MARKET, BY APPLICATION, 2017–2021 (USD MILLION)
                    TABLE 178 SOUTH AMERICA: EXTRUDED POLYSTYRENE MARKET, BY APPLICATION, 2022–2028 (USD MILLION)
           9.5.3 SOUTH AMERICA EXTRUDED POLYSTYRENE MARKET, BY END-USE INDUSTRY
                    TABLE 179 SOUTH AMERICA: EXTRUDED POLYSTYRENE MARKET, BY END-USE INDUSTRY, 2017–2021 (THOUSAND CUBIC METERS)
                    TABLE 180 SOUTH AMERICA: EXTRUDED POLYSTYRENE MARKET, BY END-USE INDUSTRY, 2022–2028 (THOUSAND CUBIC METERS)
                    TABLE 181 SOUTH AMERICA: EXTRUDED POLYSTYRENE MARKET, BY END-USE INDUSTRY, 2017–2021 (USD MILLION)
                    TABLE 182 SOUTH AMERICA: EXTRUDED POLYSTYRENE MARKET, BY END-USE INDUSTRY, 2022–2028 (USD MILLION)
           9.5.4 SOUTH AMERICA EXTRUDED POLYSTYRENE MARKET, BY COUNTRY
                    TABLE 183 SOUTH AMERICA: EXTRUDED POLYSTYRENE MARKET, BY COUNTRY, 2017–2021 (THOUSAND CUBIC METERS)
                    TABLE 184 SOUTH AMERICA: EXTRUDED POLYSTYRENE MARKET, BY COUNTRY, 2022–2028 (THOUSAND CUBIC METERS)
                    TABLE 185 SOUTH AMERICA: EXTRUDED POLYSTYRENE MARKET, BY COUNTRY, 2017–2021 (USD MILLION)
                    TABLE 186 SOUTH AMERICA: EXTRUDED POLYSTYRENE MARKET, BY COUNTRY, 2022–2028 (USD MILLION)
                    9.5.4.1 Brazil
                               9.5.4.1.1 Private sector participation in infrastructure development to drive market
                                              TABLE 187 BRAZIL: EXTRUDED POLYSTYRENE MARKET, BY END-USE INDUSTRY, 2017–2021 (THOUSAND CUBIC METERS)
                                              TABLE 188 BRAZIL: EXTRUDED POLYSTYRENE MARKET, BY END-USE INDUSTRY, 2022–2028 (THOUSAND CUBIC METERS)
                                              TABLE 189 BRAZIL: EXTRUDED POLYSTYRENE MARKET, BY END-USE INDUSTRY, 2017–2021 (USD MILLION)
                                              TABLE 190 BRAZIL: EXTRUDED POLYSTYRENE MARKET, BY END-USE INDUSTRY, 2022–2028 (USD MILLION)
                    9.5.4.2 Argentina
                               9.5.4.2.1 Favorable construction outlook to drive market
                                              TABLE 191 ARGENTINA: EXTRUDED POLYSTYRENE MARKET, BY END-USE INDUSTRY, 2017–2021 (THOUSAND CUBIC METERS)
                                              TABLE 192 ARGENTINA: EXTRUDED POLYSTYRENE MARKET, BY END-USE INDUSTRY, 2022–2028 (THOUSAND CUBIC METERS)
                                              TABLE 193 ARGENTINA: EXTRUDED POLYSTYRENE MARKET, BY END-USE INDUSTRY, 2017–2021 (USD MILLION)
                                              TABLE 194 ARGENTINA: EXTRUDED POLYSTYRENE MARKET, BY END-USE INDUSTRY, 2022–2028 (USD MILLION)
                    9.5.4.3 Columbia
                               9.5.4.3.1 Demand for high-performance, cost-effective, and environmentally advanced building products to drive market
                                              TABLE 195 COLUMBIA: EXTRUDED POLYSTYRENE MARKET, BY END-USE INDUSTRY, 2017–2021 (THOUSAND CUBIC METERS)
                                              TABLE 196 COLUMBIA: EXTRUDED POLYSTYRENE MARKET, BY END-USE INDUSTRY, 2022–2028 (THOUSAND CUBIC METERS)
                                              TABLE 197 COLUMBIA: EXTRUDED POLYSTYRENE MARKET, BY END-USE INDUSTRY, 2017–2021 (USD MILLION)
                                              TABLE 198 COLUMBIA: EXTRUDED POLYSTYRENE MARKET, BY END-USE INDUSTRY, 2022–2028 (USD MILLION)
    9.6 MIDDLE EAST & AFRICA 
           9.6.1 RECESSION IMPACT ON MIDDLE EAST & AFRICA
           9.6.2 MIDDLE EAST & AFRICA EXTRUDED POLYSTYRENE MARKET, BY APPLICATION
                    TABLE 199 MIDDLE EAST & AFRICA: EXTRUDED POLYSTYRENE MARKET, BY APPLICATION, 2017–2021 (THOUSAND CUBIC METERS)
                    TABLE 200 MIDDLE EAST & AFRICA: EXTRUDED POLYSTYRENE MARKET, BY APPLICATION, 2022–2028 (THOUSAND CUBIC METERS)
                    TABLE 201 MIDDLE EAST & AFRICA: EXTRUDED POLYSTYRENE MARKET, BY APPLICATION, 2017–2021 (USD MILLION)
                    TABLE 202 MIDDLE EAST & AFRICA: EXTRUDED POLYSTYRENE MARKET, BY APPLICATION, 2022–2028 (USD MILLION)
           9.6.3 MIDDLE EAST & AFRICA EXTRUDED POLYSTYRENE MARKET, BY END-USE INDUSTRY
                    TABLE 203 MIDDLE EAST & AFRICA: EXTRUDED POLYSTYRENE MARKET, BY END-USE INDUSTRY, 2017–2021 (THOUSAND CUBIC METERS)
                    TABLE 204 MIDDLE EAST & AFRICA: EXTRUDED POLYSTYRENE MARKET, BY END-USE INDUSTRY, 2022–2028 (THOUSAND CUBIC METERS)
                    TABLE 205 MIDDLE EAST & AFRICA: EXTRUDED POLYSTYRENE MARKET, BY END-USE INDUSTRY, 2017–2021 (USD MILLION)
                    TABLE 206 MIDDLE EAST & AFRICA: EXTRUDED POLYSTYRENE MARKET, BY END-USE INDUSTRY, 2022–2028 (USD MILLION)
           9.6.4 MIDDLE EAST & AFRICA EXTRUDED POLYSTYRENE MARKET, BY COUNTRY
                    TABLE 207 MIDDLE EAST & AFRICA: EXTRUDED POLYSTYRENE MARKET, BY COUNTRY, 2017–2021 (THOUSAND CUBIC METERS)
                    TABLE 208 MIDDLE EAST & AFRICA: EXTRUDED POLYSTYRENE MARKET, BY COUNTRY, 2022–2028 (THOUSAND CUBIC METERS)
                    TABLE 209 MIDDLE EAST & AFRICA: EXTRUDED POLYSTYRENE MARKET, BY COUNTRY, 2017–2021 (USD MILLION)
                    TABLE 210 MIDDLE EAST & AFRICA: EXTRUDED POLYSTYRENE MARKET, BY COUNTRY, 2022–2028 (USD MILLION)
                    9.6.4.1 GCC
                               9.6.4.1.1 Increased investments in building & construction industry to drive market
                                              TABLE 211 GCC: EXTRUDED POLYSTYRENE MARKET, BY END-USE INDUSTRY, 2017–2021 (THOUSAND CUBIC METERS)
                                              TABLE 212 GCC: EXTRUDED POLYSTYRENE MARKET, BY END-USE INDUSTRY, 2022–2028 (THOUSAND CUBIC METERS)
                                              TABLE 213 GCC: EXTRUDED POLYSTYRENE MARKET, BY END-USE INDUSTRY, 2017–2021 (USD MILLION)
                                              TABLE 214 GCC: EXTRUDED POLYSTYRENE MARKET, BY END-USE INDUSTRY, 2022–2028 (USD MILLION)
                               9.6.4.1.2 Saudi Arabia
                                             9.6.4.1.2.1 Promotion of foreign and private investments to drive market
                                              TABLE 215 SAUDI ARABIA: EXTRUDED POLYSTYRENE MARKET, BY END-USE INDUSTRY, 2017–2021 (THOUSAND CUBIC METERS)
                                              TABLE 216 SAUDI ARABIA: EXTRUDED POLYSTYRENE MARKET, BY END-USE INDUSTRY, 2022–2028 (THOUSAND CUBIC METERS)
                                              TABLE 217 SAUDI ARABIA: EXTRUDED POLYSTYRENE MARKET, BY END-USE INDUSTRY, 2017–2021 (USD MILLION)
                                              TABLE 218 SAUDI ARABIA: EXTRUDED POLYSTYRENE MARKET, BY END-USE INDUSTRY, 2022–2028 (USD MILLION)
                               9.6.4.1.3 UAE
                                             9.6.4.1.3.1 Increasing scope for new infrastructural development to drive market
                                              TABLE 219 UAE: EXTRUDED POLYSTYRENE MARKET, BY END-USE INDUSTRY, 2017–2021 (THOUSAND CUBIC METERS)
                                              TABLE 220 UAE: EXTRUDED POLYSTYRENE MARKET, BY END-USE INDUSTRY, 2022–2028 (THOUSAND CUBIC METERS)
                                              TABLE 221 UAE: EXTRUDED POLYSTYRENE MARKET, BY END-USE INDUSTRY, 2017–2021 (USD MILLION)
                                              TABLE 222 UAE: EXTRUDED POLYSTYRENE MARKET, BY END-USE INDUSTRY, 2022–2028 (USD MILLION)
                               9.6.4.1.4 Qatar
                                             9.6.4.1.4.1 Robust growth in construction sector to drive market
                                              TABLE 223 QATAR: EXTRUDED POLYSTYRENE MARKET, BY END-USE INDUSTRY, 2017–2021 (THOUSAND CUBIC METERS)
                                              TABLE 224 QATAR: EXTRUDED POLYSTYRENE MARKET, BY END-USE INDUSTRY, 2022–2028 (THOUSAND CUBIC METERS)
                                              TABLE 225 QATAR: EXTRUDED POLYSTYRENE MARKET, BY END-USE INDUSTRY, 2017–2021 (USD MILLION)
                                              TABLE 226 QATAR: EXTRUDED POLYSTYRENE MARKET, BY END-USE INDUSTRY, 2022–2028 (USD MILLION)
                    9.6.4.2 South Africa
                               9.6.4.2.1 Availability of raw materials to drive market
                                              TABLE 227 SOUTH AFRICA: EXTRUDED POLYSTYRENE MARKET, BY END-USE INDUSTRY, 2017–2021 (THOUSAND CUBIC METERS)
                                              TABLE 228 SOUTH AFRICA: EXTRUDED POLYSTYRENE MARKET, BY END-USE INDUSTRY, 2022–2028 (THOUSAND CUBIC METERS)
                                              TABLE 229 SOUTH AFRICA: EXTRUDED POLYSTYRENE MARKET, BY END-USE INDUSTRY, 2017–2021 (USD MILLION)
                                              TABLE 230 SOUTH AFRICA: EXTRUDED POLYSTYRENE MARKET, BY END-USE INDUSTRY, 2022–2028 (USD MILLION)
 
10 COMPETITIVE LANDSCAPE (Page No. - 187)
     10.1 INTRODUCTION 
     10.2 KEY PLAYERS’ STRATEGIES 
             TABLE 231 OVERVIEW OF STRATEGIES ADOPTED BY KEY EXTRUDED POLYSTYRENE MANUFACTURERS
     10.3 RANKING OF KEY MARKET PLAYERS, 2022 
             FIGURE 39 RANKING OF TOP FIVE PLAYERS IN EXTRUDED POLYSTYRENE MARKET, 2022
     10.4 MARKET SHARE ANALYSIS 
             TABLE 232 EXTRUDED POLYSTYRENE MARKET: DEGREE OF COMPETITION
             FIGURE 40 EXTRUDE POLYSTYRENE MARKET: MARKET SHARE ANALYSIS
     10.5 REVENUE ANALYSIS OF KEY MARKET PLAYERS, 2018–2022 
             FIGURE 41 REVENUE ANALYSIS OF KEY COMPANIES IN LAST FIVE YEARS
     10.6 COMPANY EVALUATION MATRIX (TIER 1) 
             10.6.1 STARS
             10.6.2 EMERGING LEADERS
             10.6.3 PERVASIVE PLAYERS
             10.6.4 PARTICIPANTS
                        FIGURE 42 COMPANY EVALUATION MATRIX FOR EXTRUDED POLYSTYRENE MARKET
             10.6.5 COMPANY FOOTPRINT
                        FIGURE 43 EXTRUDED POLYSTYRENE MARKET: COMPANY FOOTPRINT
                        TABLE 233 EXTRUDED POLYSTYRENE MARKET: APPLICATION FOOTPRINT
                        TABLE 234 EXTRUDED POLYSTYRENE MARKET: END-USE INDUSTRY FOOTPRINT
                        TABLE 235 EXTRUDED POLYSTYRENE MARKET: COMPANY REGION FOOTPRINT
     10.7 STARTUP/SME EVALUATION MATRIX 
             10.7.1 PROGRESSIVE COMPANIES
             10.7.2 RESPONSIVE COMPANIES
             10.7.3 DYNAMIC COMPANIES
             10.7.4 STARTING BLOCKS
                        FIGURE 44 STARTUP/SME EVALUATION MATRIX FOR EXTRUDED POLYSTYRENE MARKET
             10.7.5 COMPETITIVE BENCHMARKING
                        TABLE 236 DETAILED LIST OF KEY STARTUPS/SMES
                        TABLE 237 COMPETITIVE BENCHMARKING OF KEY STARTUPS/SMES
     10.8 COMPETITIVE SCENARIOS & TRENDS 
             10.8.1 PRODUCT LAUNCHES
             10.8.2 OTHERS
 
11 COMPANY PROFILES (Page No. - 200)
     11.1 KEY PLAYERS 
(Business Overview, Products/Solutions/Services Offered, Recent Developments, MnM view (Key strengths/Right to win, Strategic choices made, Weakness/competitive threats)*
             11.1.1 SYNTHOS S.A.
                        TABLE 238 SYNTHOS S.A.: COMPANY OVERVIEW
                        FIGURE 45 SYNTHOS S.A.: COMPANY SNAPSHOT
                        TABLE 239 SYNTHOS S.A.: PRODUCTS/SOLUTIONS/SERVICES OFFERINGS
             11.1.2 BASF SE
                        TABLE 240 BASF SE: COMPANY OVERVIEW
                        FIGURE 46 BASF SE: COMPANY SNAPSHOT
                        TABLE 241 BASF SE: PRODUCTS/SOLUTIONS/SERVICES OFFERINGS
             11.1.3 RAVAGO S.A.
                        TABLE 242 RAVAGO S.A.: COMPANY OVERVIEW
                        TABLE 243 RAVAGO S.A.: PRODUCTS/SOLUTIONS/SERVICES OFFERINGS
             11.1.4 SAINT-GOBAIN
                        TABLE 244 SAINT-GOBAIN: COMPANY OVERVIEW
                        FIGURE 47 SAINT-GOBAIN: COMPANY SNAPSHOT
                        TABLE 245 SAINT-GOBAIN: PRODUCTS/SOLUTIONS/SERVICES OFFERINGS
             11.1.5 DUPONT DE NEMOURS, INC.
                        TABLE 246 DUPONT DE NEMOURS, INC.: COMPANY OVERVIEW
                        FIGURE 48 DUPONT DE NEMOURS, INC.: COMPANY SNAPSHOT
                        TABLE 247 DUPONT DE NEMOURS, INC.: PRODUCTS/SOLUTIONS/SERVICES OFFERINGS
             11.1.6 OWENS CORNING
                        TABLE 248 OWENS CORNING: COMPANY OVERVIEW
                        FIGURE 49 OWENS CORNING: COMPANY SNAPSHOT
                        TABLE 249 OWENS CORNING: PRODUCTS/SOLUTIONS/SERVICES OFFERINGS
                        TABLE 250 OWENS CORNING: OTHERS
             11.1.7 DOW INC.
                        TABLE 251 DOW INC.: COMPANY OVERVIEW
                        FIGURE 50 DOW INC.: COMPANY SNAPSHOT
                        TABLE 252 DOW INC.: PRODUCTS/SOLUTIONS/SERVICES OFFERINGS
             11.1.8 KINGSPAN GROUP PLC
                        TABLE 253 KINGSPAN GROUP PLC: COMPANY OVERVIEW
                        FIGURE 51 KINGSPAN GROUP PLC: COMPANY SNAPSHOT
                        TABLE 254 KINGSPAN GROUP PLC: PRODUCTS/SOLUTIONS/SERVICES OFFERINGS
                        TABLE 255 KINGSPAN GROUP PLC: PRODUCT LAUNCHES
             11.1.9 KANEKA CORPORATION
                        TABLE 256 KANEKA CORPORATION: COMPANY OVERVIEW
                        FIGURE 52 KANEKA CORPORATION: COMPANY SNAPSHOT
                        TABLE 257 KANEKA CORPORATION: PRODUCTS/SOLUTIONS/SERVICES OFFERINGS
             11.1.10 SUPREME PETROCHEM LTD.
                        TABLE 258 SUPREME PETROCHEM LTD.: COMPANY OVERVIEW
                        FIGURE 53 SUPREME PETROCHEM LTD.: COMPANY SNAPSHOT
                        TABLE 259 SUPREME PETROCHEM LTD.: PRODUCTS/SOLUTIONS/SERVICES OFFERINGS
                        TABLE 260 SUPREME PETROCHEM LTD.: OTHERS
     11.2 OTHER KEY PLAYERS 
             11.2.1 VERDANE
                        TABLE 261 VERDANE: COMPANY OVERVIEW
             11.2.2 BRØDR. SUNDE A/S
                        TABLE 262 BRØDR. SUNDE A/S: COMPANY OVERVIEW
             11.2.3 LOYAL GROUP
                        TABLE 263 LOYAL GROUP: COMPANY OVERVIEW
             11.2.4 FINNFOAM OY
                        TABLE 264 FINNFOAM OY: COMPANY OVERVIEW
             11.2.5 TECHNONICOL CORPORATION
                        TABLE 265 TECHNONICOL CORPORATION: COMPANY OVERVIEW
             11.2.6 AUSTROTHERM GMBH
                        TABLE 266 AUSTROTHERM GMBH: COMPANY OVERVIEW
             11.2.7 URSA DÄMMSYSTEME AUSTRIA GMBH
                        TABLE 267 URSA DÄMMSYSTEME AUSTRIA GMBH: COMPANY OVERVIEW
             11.2.8 PENOPLEX SPB LLC
                        TABLE 268 PENOPLEX SPB LLC: COMPANY OVERVIEW
             11.2.9 HANGZHOU TYCO INDUSTRIAL CO., LTD.
                        TABLE 269 HANGZHOU TYCO INDUSTRIAL CO., LTD.: COMPANY OVERVIEW
             11.2.10 JACKON INSULATION GMBH
                        TABLE 270 JACKON INSULATION GMBH: COMPANY OVERVIEW
             11.2.11 SOPREMA GROUP
                        TABLE 271 SOPREMA GROUP: COMPANY OVERVIEW
             11.2.12 ABRISO-JIFFY NV
                        TABLE 272 ABRISO-JIFFY NV: COMPANY OVERVIEW
             11.2.13 EMIRATES EXTRUDED POLYSTYRENE L.L.C.
                        TABLE 273 EMIRATES EXTRUDED POLYSTYRENE L.L.C.: COMPANY OVERVIEW
             11.2.14 OHANA INDUSTRIES LLC
                        TABLE 274 OHANA INDUSTRIES LLC: COMPANY OVERVIEW
             11.2.15 ISOFOAM
                        TABLE 275 ISOFOAM: COMPANY OVERVIEW
 
*Details on Business Overview, Products/Solutions/Services Offered, Recent Developments, MnM view (Key strengths/Right to win, Strategic choices made, Weakness/competitive threats)* might not be captured in case of unlisted companies.
 
12 ADJACENT & RELATED MARKETS (Page No. - 231)
     12.1 INTRODUCTION 
     12.2 LIMITATION 
     12.3 POLYSTYRENE FOAM MARKET 
             12.3.1 MARKET DEFINITION
             12.3.2 MARKET OVERVIEW
     12.4 POLYSTYRENE FOAM MARKET, BY REGION 
             TABLE 276 POLYSTYRENE FOAM MARKET, BY REGION, 2019–2026 (USD MILLION)
             TABLE 277 POLYSTYRENE FOAM MARKET, BY REGION, 2019–2026 (KILOTON)
             12.4.1 ASIA PACIFIC
                        TABLE 278 ASIA PACIFIC: POLYSTYRENE FOAM MARKET, BY COUNTRY/REGION, 2019–2026 (USD MILLION)
                        TABLE 279 ASIA PACIFIC: POLYSTYRENE FOAM MARKET, BY COUNTRY/REGION, 2019–2026 (KILOTON)
             12.4.2 EUROPE
                        TABLE 280 EUROPE: POLYSTYRENE FOAM MARKET, BY COUNTRY/REGION, 2019–2026 (USD MILLION)
                        TABLE 281 EUROPE: POLYSTYRENE FOAM MARKET, BY COUNTRY/REGION, 2019–2026 (KILOTON)
             12.4.3 NORTH AMERICA
                        TABLE 282 NORTH AMERICA: POLYSTYRENE FOAM MARKET, BY REGION, 2019–2026 (USD MILLION)
                        TABLE 283 NORTH AMERICA: POLYSTYRENE FOAM MARKET, BY REGION, 2019–2026 (KILOTON)
             12.4.4 SOUTH AMERICA
                        TABLE 284 SOUTH AMERICA: POLYSTYRENE FOAM MARKET, BY REGION, 2019–2026 (USD MILLION)
                        TABLE 285 SOUTH AMERICA: POLYSTYRENE FOAM MARKET, BY REGION, 2019–2026 (KILOTON)
             12.4.5 MIDDLE EAST & AFRICA
                        TABLE 286 MIDDLE EAST & AFRICA: POLYSTYRENE FOAM MARKET, BY REGION, 2019–2026 (USD MILLION)
                        TABLE 287 MIDDLE EAST & AFRICA: POLYSTYRENE FOAM MARKET, BY REGION, 2019–2026 (KILOTON)
 
13 APPENDIX (Page No. - 238)
     13.1 DISCUSSION GUIDE 
     13.2 KNOWLEDGESTORE: MARKETSANDMARKETS’ SUBSCRIPTION PORTAL 
     13.3 CUSTOMIZATION OPTIONS 
     13.4 RELATED REPORT 
     13.5 AUTHOR DETAILS 

The study involved four major activities in estimating the market size for the extruded polystyrene market. Intensive secondary research was done to gather information on the market, the peer market, and the parent market. The next step was to validate these findings, assumptions, and sizing with industry experts across the value chain through primary research. Both top-down and bottom-up approaches were employed to estimate the complete market size. After that, the market breakdown and data triangulation procedures were used to estimate the market size of the segments and subsegments.

Secondary Research

Secondary sources used in this study included annual reports, press releases, and investor presentations of companies; white papers; certified publications; articles from recognized authors; and gold standard & silver standard websites such as Factiva, ICIS, Bloomberg, and others. The findings of this study were verified through primary research by conducting extensive interviews with key officials such as CEOs, VPs, directors, and other executives. The breakdown of profiles of the primary interviewees is illustrated in the figure below:

Primary Research

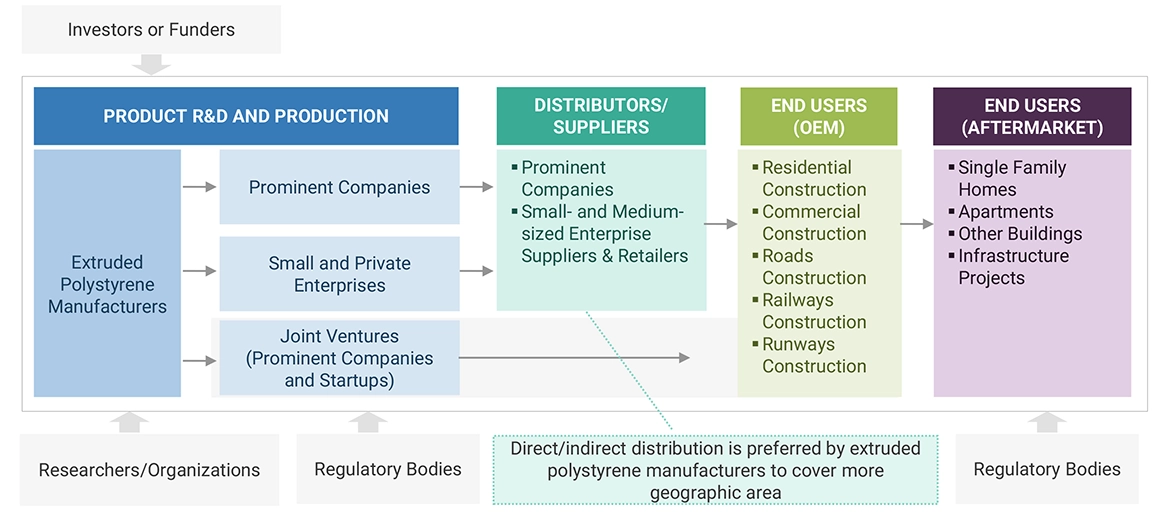
The extruded polystyrene market comprises several stakeholders, such as raw material suppliers, end-product manufacturers, and regulatory organizations in the supply chain. The demand side of this market is characterized by key opinion leaders in various applications for the extruded polystyrene market. The supply side is characterized by advancements in technology and diverse application industries. Various primary sources from both the supply and demand sides of the market were interviewed to obtain qualitative and quantitative information.

Breakdown of Primary Participants

Extruded Polystyrene Market Size, and Share

Note: Tier 1, Tier 2, and Tier 3 companies are classified based on their market revenue in 2022 available in the public domain, product portfolios, and geographical presence.

Other designations include consultants and sales, marketing, and procurement managers.

To know about the assumptions considered for the study, download the pdf brochure

Report Metric

Details

Kingspan Group PLC

Global Strategy & Innovation Manager

Owens Corning

Technical Sales Manager

BASF SE

Senior Supervisor

Synthos S.A.

Production Supervisor

Ravago S.A.

Production Manager

Market Size Estimation

Both top-down and bottom-up approaches were used to estimate and validate the total size of the extruded polystyrene market. These methods were also used extensively to estimate the size of various subsegments in the market. The research methodology used to estimate the market size includes the following:

  • The key players in the industry have been identified through extensive secondary research.
  • The supply chain of the industry has been determined through primary and secondary research.
  • All percentage shares, splits, and breakdowns have been determined using secondary sources and verified through primary sources.
  • All possible parameters that affect the markets covered in this research study have been accounted for, viewed in extensive detail, verified through primary research, and analyzed to obtain the final quantitative and qualitative data.

Extruded polystyrene Market: Bottom-Up Approach

Extruded Polystyrene Market Size, and Share

To know about the assumptions considered for the study, Request for Free Sample Report

Extruded polystyrene Market: Top-Down Approach

Extruded Polystyrene Market Size, and Share

Data Triangulation

After arriving at the overall market size—using the market size estimation processes as explained above—the market was split into respective segments and subsegments. To realize the overall market engineering process and arrive at the exact statistics of each market segment and subsegment, data triangulation and market breakdown procedures were employed, wherever applicable. The data was triangulated by studying several factors and trends from both the demand and supply sides in the extruded polystyrene industry.
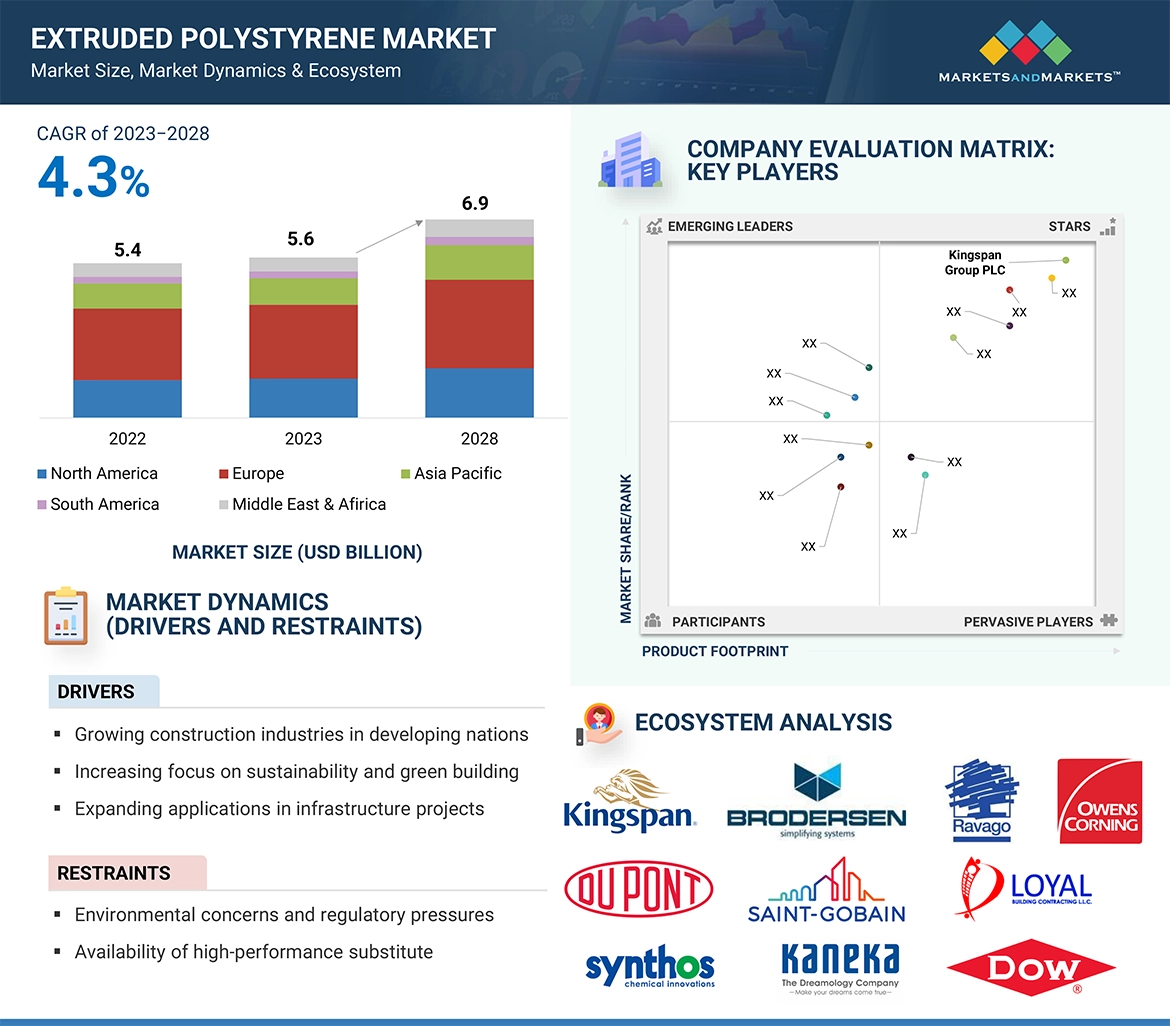
Market Definition

Extruded polystyrene (XPS) is an extremely effective and adaptable insulation material used extensively in the construction industry. They find application across diverse sectors such as residential, commercial, and others. It has outstanding thermal properties, moisture resistance, and durability. It contributes to overall building sustainability, improves energy efficiency, and provides moisture protection for floors, walls, foundations, and other structures.

The building industry's emphasis on sustainable and energy-efficient building methods, along with the necessity for long-lasting and dependable insulating solutions, are the main factors driving the market for extruded polystyrene.

Key Stakeholders

  • Extruded polystyrene manufacturers
  • Raw material manufacturers
  • Government planning commissions and research organizations
  • Industry associations
  • End-use industries
  • R&D institutions

Report Objectives

  • To analyze and forecast the size of the extruded polystyrene market in terms of value and volume
  • To provide detailed information regarding key factors, such as drivers, restraints, challenges, and opportunities influencing the growth of the market
  • To define, describe, and segment the extruded polystyrene market based on application and end-use industry.
  • To forecast the size of the market segments for regions such as Asia Pacific, North America, Europe, South America, and the Middle East & Africa
  • To strategically analyze the segmented markets with respect to individual growth trends, prospects, and contributions to the overall market
  • To identify and analyze opportunities for stakeholders in the market
  • To strategically profile key players and comprehensively analyze their core competencies

Available Customizations

Along with the given market data, MarketsandMarkets offers customizations according to the company’s specific needs. The following customization options are available for the report:

Regional Analysis

  • Further breakdown of a region with respect to a particular country or additional end-use industry or type

Company Information

  • Detailed analysis and profiles of additional market players (up to five)
Custom Market Research Services

We will customize the research for you, in case the report listed above does not meet with your exact requirements. Our custom research will comprehensively cover the business information you require to help you arrive at strategic and profitable business decisions.

Request Customization
Report Code
CH 7474
Published ON
Jan, 2024
Choose License Type
BUY NOW
  • SHARE
X
Request Customization
Speak to Analyst
Speak to Analyst
OR FACE-TO-FACE MEETING
PERSONALIZE THIS RESEARCH
  • Triangulate with your Own Data
  • Get Data as per your Format and Definition
  • Gain a Deeper Dive on a Specific Application, Geography, Customer or Competitor
  • Any level of Personalization
REQUEST A FREE CUSTOMIZATION
LET US HELP YOU!
  • What are the Known and Unknown Adjacencies Impacting the Extruded Polystyrene Market
  • What will your New Revenue Sources be?
  • Who will be your Top Customer; what will make them switch?
  • Defend your Market Share or Win Competitors
  • Get a Scorecard for Target Partners
CUSTOMIZED WORKSHOP REQUEST
+1-888-600-6441
  • Call Us
  • +1-888-600-6441 (Corporate office hours)
  • +1-888-600-6441 (US/Can toll free)
  • +44-800-368-9399 (UK office hours)
CONNECT WITH US
ABOUT TRUST ONLINE
©2024 MarketsandMarkets Research Private Ltd. All rights reserved
DMCA.com Protection Status Website Feedback