Aerospace Foams Market by Material (PU Foams, PE Foams, Melamine Foams, Metal Foams, PMI/Polyimide Foams), End-Use (Commercial Aircraft, Military Aircraft, And General Aviation), Application and Region - Global Forecast to 2024


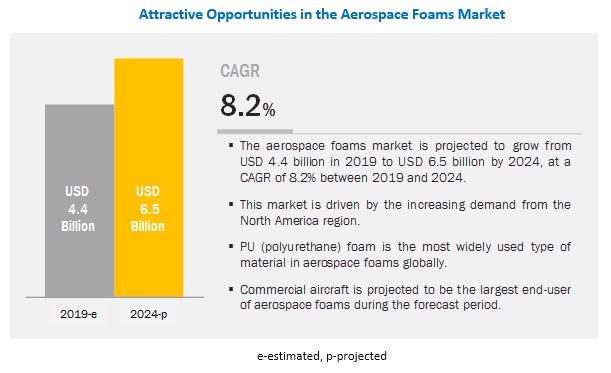
[169 Pages Report] The aerospace foams market size is projected to grow from USD 4.4 billion in 2019 to USD 6.5 billion by 2024, at a CAGR of 8.2% from 2019 to 2024. Surging demand for lightweight and fuel-efficient aircraft, as well as the growing aviation industry across the globe, is fueling the growth of the market. The manufacturing of advanced materials and new product launches by several prominent players in the aerospace industry is one of the key factors driving the growth of the aerospace foams industry across the globe. The favorable government policies in Brazil, as well as the increase in the use of bio-based PU foams in North America and Europe, is expected to upsurge and diversify the aerospace foams market, thus acting as an opportunity for the growth of the aerospace foams market.
Based on end-use, the commercial aircraft segment of theaerospace foams market is projected to grow at the highest CAGR in terms of value and volume from 2019 to 2024
Based on end-use, the commercial aircraft segment of the market is expected to grow at the highest CAGR during the forecast period in terms of both value and volume. An increasing number of air passengers worldwide is boosting the growth of the market. Furthermore, the surge in low-cost operators or low-cost carriers in the regions such as Asia Pacific, Middle East, and South America, has resulted in the hike in demand for commercial aircraft segment. These factors are driving the growth of the aerospace foams market across the globe.
Based on material, the PU Foamssegment of the aerospace foams market is projected to dominate the aerospace foams market from 2019 to 2024 in terms of both value and volume.
Based on material, the aerospace foams market has been segmented into PU foams, PE foams, melamine foams, metal foams, PMI/polyimide foams, and others. PU foams segment is projected to lead the market during the forecast period in terms of both value and volume. The rising demand for PU aerospace foams in seating and carpeting applications in the aviation industry and its low cost is considered as some of the key factors expected to drive the growth of the PU foams segment of the market.
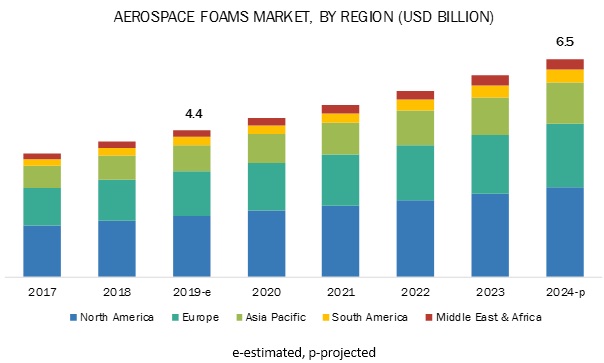
North America is projected to lead the aerospace foams market during the forecast period in terms of both value and volume
North America is estimated to be the largest market for aerospace foams in 2019. US, Canada, and Mexico are the major consumers of aerospace foams in this region. Growth of the aviation industry, rising number of air passengers, and increasing military expenditure are factors driving the growth of the aerospace foams market in this region.
Key Market Players
BASF SE (Germany), Evonik Industries AG (Germany), Boyd Corporation (US), Rogers Corporation (US), FoamPartner (Switzerland), Armacell International S.A. (Luxembourg), SABIC (Saudi Arabia), ERG Materials and Aerospace Corp (US), UFP Technologies, Inc. (US), Zotefoams Plc (UK), General Plastics Manufacturing Company (US), Solvay SA (Belgium), Pyrotek Inc. (US), and Greiner AG (Austria) are some of the leading players operating in the aerospace foams market. These players have adopted the strategies of expansions, acquisitions, new product launches, investments, new technology developments, partnerships, mergers, collaborations, and agreements to enhance their position in the market.
Scope Of The Report
|
Report Metric |
Details |
|
Market Size Available for Years |
2017�2024 |
|
Base Year Considered |
2018 |
|
Forecast Period |
2019�2024 |
|
Forecast Units |
Value (USD Billion) and Volume (Tons) |
|
Segments Covered |
Material, End-Use, and Region |
|
Geographies Covered |
North America, Asia Pacific, Europe, the Middle East & Africa, and South America |
|
Companies Covered |
BASF SE (Germany), Evonik Industries AG (Germany), Boyd Corporation (US), Rogers Corporation (US), FoamPartner (Switzerland), Armacell International S.A. (Luxembourg), SABIC (Saudi Arabia) |
This research report categorizes the aerospace foams market based on material, end-use, application (qualitative), and region.
Based on Material, the aerospace foams market has been segmented as follows:
- PU Foams
- PE Foams
- Melamine Foams
- Metal Foams
- PMI/Polyimide Foams
- Others
- PVDF Foams
- PPSU Foams
- Ceramic Foams
- PEI Foams
- Silicones Foams
- PET Foams
- PVC Foams
- Polycarbonate Foams
Based on End-Use, the aerospace foams market has been segmented as follows:
- Commercial Aircraft
- Commercial Business Aviation
- Air Charter
- Air Taxi
- Military Aircraft
- General Aviation
Based on Application, the aerospace foams market has been segmented as follows:
- Aircraft Seats
- Aircraft Floor Carpets
- Flight Deck Pads
- Cabin Walls and Ceilings
- Overhead Stow Bins
- Others (Aircraft Prototypes, Galleys and Lavatories)
Based on Region, the aerospace foams market has been segmented as follows:
- North America
- Europe
- Asia Pacific
- South America
- Middle East & Africa
Recent Developments
- In January 2017, Rogers Corporation completed the acquisition of Diversified Silicone Products, Inc., a custom silicone product development and manufacturer based in the US. The acquisition expanded the product portfolio of Elastomeric Material Solutions (EMS), an operating segment of Rogers Corporation. Furthermore, the acquisition is expected to lead to additional silicone growth opportunities in end-use industries such as aerospace.
- In September 2014, Boyd Corporation completed the acquisition of Solimide business from Evonik Industries AG (Germany) which had its operations in Magnolia, Arkansas and Allen, Texas. This development is expected to create a synergy which would offer a competitive edge and aid the company in strengthening its core business globally.
Key Questions Addressed by the Report
- What is the mid- to long-term effect of the developments that were undertaken by various aerospace foam manufacturing companies?
- What are the upcoming industry applications of aerospace foams?
- What is the impact of the change in government policies on the aerospace foams market?
- What is the estimated size of the aerospace foams market in 2019?
- What are the different use cases of aerospace foams?
To speak to our analyst for a discussion on the above findings, click Speak to Analyst
 Exclusive indicates content/data unique to MarketsandMarkets and not available with any competitors.
Table of Contents
1 Introduction (Page No. - 20)
1.1 Objectives of the Study
1.2 Market Definition
1.3 Scope of the Study
1.3.1 Markets Covered
1.3.2 Years Considered for the Study
1.4 Currency Considered
1.5 Stakeholders
2 Research Methodology (Page No. - 23)
2.1 Research Data
2.1.1 Secondary Data
2.1.1.1 Key Data From Secondary Sources
2.1.2 Primary Data
2.1.2.1 Key Data From Primary Sources
2.1.2.1 Key Industry Insights
2.1.2.2 Breakdown of Primary Interviews
2.2 Market Size Estimation
2.2.1 Bottom-Up Approach
2.2.2 Top-Down Approach
2.3 Data Triangulation
2.4 Research Assumptions
2.5 Limitations
3 Executive Summary (Page No. - 30)
4 Premium Insights (Page No. - 34)
4.1 Attractive Opportunities in the Aerospace Foams Market
4.2 Aerospace Foams Market, By Material
4.3 Aerospace Foams Market, By Material
4.4 Aerospace Foams Market, By End Use
4.5 Aerospace Foams Market Growth
5 Market Overview (Page No. - 37)
5.1 Introduction
5.2 Market Segmentation
5.3 Market Dynamics
5.3.1 Drivers
5.3.1.1 Growing Demand for Lightweight and Fuel-Efficient Aircraft
5.3.1.2 Steady Growth in Aerospace Industry
5.3.2 Restraints
5.3.2.1 Stringent Regulations Regarding the Use of PU Foams
5.3.3 Opportunities
5.3.3.1 Renewable Feedstock for Manufacturing Green PU Foams
5.3.4 Challenges
5.3.4.1 Disposal and Recycling
5.3.4.2 Fluctuation in the Price of Raw Materials
6 Industry Trends (Page No. - 42)
6.1 Introduction
6.2 Value Chain Analysis
6.2.1 Raw Material Suppliers
6.2.2 Aerospace Foams, By Material Segment
6.2.3 Aerospace Foam Manufacturers/Formulators
6.2.4 Aerospace Foam Suppliers/Distributors
6.2.5 End Users
6.3 Raw Materials for Aerospace Foams
6.3.1 Polyurethane (PU)
6.3.1.1 Methylene Diphenyl Diisocyanate (MDI)
6.3.1.2 Toluene Diisocyanate (TDI)
6.3.1.3 Polyol
6.3.2 Polyethylene
6.3.2.1 Polyethylene Resins
6.3.3 Metal
6.3.3.1 Aluminum Alloy
6.3.3.2 Titanium Alloys
6.3.3.3 Super Alloys
6.3.4 Melamine
6.3.4.1 Melamine-Formaldehyde (MF) Resins
6.3.5 PMI
6.3.5.1 Methacrylonitrile
6.4 Porter�s Five Forces Analysis
6.4.1 Bargaining Power of Suppliers
6.4.2 Bargaining Power of Buyers
6.4.3 Threat of Substitutes
6.4.4 Threat of New Entrants
6.4.5 Intensity of Competitive Rivalry
7 Aerospace Foams Market, By Material (Page No. - 49)
7.1 Introduction
7.2 Polyurethane (PU) Foam
7.2.1 Extensive Usage of PU Foam in Seating and Cushioning Application is Driving the Growth of the PU Foam Segment Market
7.3 Polyethylene (PE) Foam
7.3.1 PE Foam Accounted for the Second-Largest Share in the Aerospace Foams Market
7.4 Metal Foam
7.4.1 Growing Demand From Commercial and Military Aircraft is Expected to Fuel the Growth of Metal Foam Segment
7.5 Melamine Foam
7.5.1 Increasing Acoustic and Thermal Insulation Applications Drive Growth of the Melamine Foam Segment
7.6 PMI Foam
7.6.1 Europe Led the PMI Segment Market in 2018 and is Expected to Continue to Lead in the Forecast Period
7.7 Others
7.7.1 Ceramic Foam
7.7.2 PEI (Polyetherimide) Foam
7.7.3 Silicone Foam
7.7.4 PVDF (Polyvinylidene Fluoride) Foam
7.7.5 PPSU (Polyphenylsulfone) Foam
7.7.6 Polycarbonate Foam
7.7.7 PVC (Polyvinyl Chloride) Foam
7.7.8 PET (Polyethylene Terephthalate) Foam
8 Aerospace Foams Market, By End Use (Page No. - 59)
8.1 Introduction
8.2 Commercial Aircraft
8.2.1 Growing Air Passenger Travel Demand in Emerging Markets is Propelling the Demand for Commercial Aircraft
8.2.2 Commercial Business Aviation
8.2.3 Air Charters
8.2.4 Air Taxis
8.3 Military Aircraft
8.3.1 High Demand for Silicone Foams and Metal Foams in Military Aircraft Drives Growth of the Military Aircraft Segment
8.4 General Aviation
8.4.1 North America Dominated the General Aviation Segment in Aerospace Foams Market in 2018
9 Aerospace Foams Market, By Application (Page No. - 66)
9.1 Introduction
9.2 Aircraft Seats
9.2.1 9g Seating
9.2.2 16g Seating
9.3 Aircraft Floor Carpets
9.4 Flight Deck Pads
9.5 Overhead Stow Bins
10 Aerospace Foams Market, By Region (Page No. - 69)
10.1 Introduction
10.2 North America
10.2.1 US
10.2.1.1 US Dominated the Aerospace Foams Market
10.2.2 Canada
10.2.2.1 The Aerospace Foams Market in Canada is Dominated By the Commercial Aircraft Segment
10.2.3 Mexico
10.2.3.1 Growing Aviation Industry in Mexico Supports the Growth of the Aerospace Foams Market
10.3 Europe
10.3.1 France
10.3.1.1 France is the Largest Consumer of Aerospace Foams in Europe
10.3.2 Germany
10.3.2.1 Growing Technological Innovation and Significant Investment in R&D Sector for Aeronautics and Space is Expected to Drive the
Aerospace Foams Market
10.3.3 UK
10.3.3.1 The Metal Foam Segment is Projected to Be the Fastest-Growing in the UK
10.3.4 Russia
10.3.4.1 The Aerospace Foams Market in Russia is Majorly Driven By the Military Aircraft End Use Segment
10.3.5 Italy
10.3.5.1 PU Foams is the Largest Material Segment of Aerospace Foams in Italy
10.3.6 The Netherlands
10.3.6.1 The Growing Demand for Military & Commercial Aircraft has Led to High Demand for Aerospace Foams in the Netherlands
10.4 Asia Pacific
10.4.1 China
10.4.1.1 in Asia Pacific Region, China Dominated the Aerospace Foams Market in 2018
10.4.2 Japan
10.4.2.1 Japan Accounted for the Second-Largest Market Share in 2018
10.4.3 Singapore
10.4.3.1 The Aerospace Foams Market in Singapore is Expected to Be Driven By the Growing Aerospace Mro Services in the Country
10.4.4 New Zealand & Australia
10.4.4.1 in New Zealand & Australia, the Aerospace Foams Market Was Dominated By the PU Foam Segment in 2018
10.4.5 Rest of Asia Pacific
10.5 Middle East & Africa
10.5.1 Saudi Arabia
10.5.1.1 Saudi Arabia is Estimated to Dominate the Market in the Middle East & Africa in 2019
10.5.2 UAE
10.5.2.1 Presence of Leading Airline Companies Expected to Support the Demand for Aerospace Foams in the Country
10.5.3 Rest of Middle East & Africa
10.6 South America
10.6.1 Brazil
10.6.1.1 Brazil Accounted for the Largest Share in the South American Aerospace Foams Market in 2018
10.6.2 Argentina
10.6.2.1 The Increase in the Number of Air Passengers in Argentina Fuels the Demand for Aerospace Foams in Commercial Aircraft
10.6.3 Rest of South America
11 Competitive Landscape (Page No. - 116)
11.1 Overview
11.2 Competitive Landscape Mapping, 2019
11.2.1 Visionary Leaders
11.2.2 Innovators
11.2.3 Dynamic Differentiators
11.2.4 Emerging Companies
11.3 Competitive Benchmarking
11.3.1 Strength of Product Portfolio
11.3.2 Business Strategy Excellence
11.4 Sme Matrix, 2019
11.4.1 Leaders
11.4.2 Contenders
11.4.3 Pacesetters
11.4.4 Masters
11.5 Market Ranking of Key Players
11.6 Competitive Scenario
11.6.1 Expansions
11.6.2 Acquisitions
11.6.3 New Product Launches
11.6.4 Investments
11.6.5 Collaborations
11.6.6 New Product Developments
11.6.7 New Technology Developments
11.6.8 Mergers
11.6.9 Agreements
12 Company Profiles (Page No. - 130)
(Business Overview, Products Offered, Recent Developments, SWOT Analysis, and MnM View)*
12.1 BASF SE
12.2 Evonik Industries AG
12.3 Boyd Corporation
12.4 Rogers Corporation
12.5 Armacell International S.A.
12.6 Foampartner
12.7 SABIC
12.8 Erg Materials and Aerospace Corp
12.9 UFP Technologies, Inc.
12.10 Zotefoams Plc
12.11 General Plastics Manufacturing Company
12.12 Solvay SA
12.13 Greiner AG
12.14 Pyrotek Inc.
(*Details on Business Overview, Products Offered, Recent Developments, SWOT Analysis, and MnM View Might Not Be Captured in Case of Unlisted Companies.)*
12.15 Other Companies
12.15.1 Dupont De Nemours, Inc.
12.15.2 Ncfi Polyurethanes
12.15.3 Sekisui Voltek, LLC
12.15.4 Sinfo, Spol. S R.O.
12.15.5 3a Composites Holding AG
12.15.6 Aerofoam Industries, LLC
13 Appendix (Page No. - 162)
13.1 Discussion Guide
13.2 Knowledge Store: Marketsandmarkets Subscription Portal
13.3 Available Customizations
13.4 Related Reports
13.5 Author Details
List of Tables (146 Tables)
Table 1 Aerospace Foams Market Snapshot
Table 2 Aerospace Foams Market, By Material
Table 3 Aerospace Foams Market, By End Use
Table 4 Aerospace Foams Market Size, By Material, 2017�2024 (USD Million)
Table 5 Aerospace Foams Market Size, By Material, 2017�2024 (Tons)
Table 6 Polyurethane (PU) Aerospace Foam Market Size, By Region, 2017�2024 (USD Million)
Table 7 Polyurethane (PU) Aerospace Foams Market Size, By Region, 2017�2024 (Tons)
Table 8 Polyethylene (PE) Aerospace Foams Market Size, By Region, 2017�2024 (USD Million)
Table 9 Polyethylene (PE) Aerospace Foams Market Size, By Region, 2017�2024 (Tons)
Table 10 Metal Aerospace Foams Market Size, By Region, 2017�2024 (USD Million)
Table 11 Metal Aerospace Foams Market Size, By Region, 2017�2024 (Tons)
Table 12 Melamine Aerospace Foams Market Size, By Region, 2017�2024 (USD Million)
Table 13 Melamine Aerospace Foams Market, By Region, 2017�2024 (Tons)
Table 14 PMI Aerospace Foams Market Size, By Region, 2017�2024 (USD Million)
Table 15 PMI Aerospace Foams Market Size, By Region, 2017�2024 (Tons)
Table 16 Other Aerospace Foams Market Size, By Region, 2017�2024 (USD Million)
Table 17 Other Aerospace Foams Market Size, By Region, 2017�2024 (Tons)
Table 18 Aerospace Foams Market Size, By End Use , 2017�2024 (USD Million)
Table 19 Aerospace Foams Market Size, By End Use , 2017�2024 (Tons)
Table 20 Commercial Aircraft in Aerospace Foams Market Size, By Region, 2017�2024 (USD Million)
Table 21 Commercial Aircraft in Aerospace Foams Market Size, By Region, 2017�2024 (Tons)
Table 22 Military Aircraft in Aerospace Foams Market Size, By Region, 2017�2024 (USD Million)
Table 23 Military Aircraft in Aerospace Foams Market Size, By Region, 2017�2024 (Tons)
Table 24 General Aviation in Aerospace Foams Market Size, By Region, 2017�2024 (USD Million)
Table 25 General Aviation in Aerospace Foams Market Size, By Region, 2017�2024 (Tons)
Table 26 Aerospace Foams Market Size, By Region, 2017�2024 (USD Million)
Table 27 Aerospace Foams Market Size, By Region, 2017�2024 (Tons)
Table 28 North America: Aerospace Foams Market Size, By Country, 2017�2024 (USD Million)
Table 29 North America: Aerospace Foams Market Size, By Country, 2017�2024 (Tons)
Table 30 North America: Aerospace Foams Market Size, By Material, 2017�2024 (USD Million)
Table 31 North America: Aerospace Foams Market Size, By Material, 2017�2024 (Tons)
Table 32 North America: Aerospace Foams Market Size, By End Use, 2017�2024 (USD Million)
Table 33 North America: Aerospace Foams Market Size, By End Use, 2017�2024 (Tons)
Table 34 US: Aerospace Foams Market Size, By Material, 2017�2024 (USD Million)
Table 35 US: Aerospace Foams Market Size, By Material, 2017�2024 (Tons)
Table 36 US: Aerospace Foams Market Size, By End Use, 2017�2024 (USD Million)
Table 37 US: Aerospace Foams Market Size, By End Use, 2017�2024 (Tons)
Table 38 Canada: Aerospace Foams Market Size, By Material, 2017�2024 (USD Million)
Table 39 Canada: Aerospace Foams Market Size, By Material, 2017�2024 (Tons)
Table 40 Canada: Aerospace Foams Market Size, By End Use, 2017�2024 (USD Million)
Table 41 Canada: Aerospace Foams Market Size, By End Use, 2017�2024 (Tons)
Table 42 Mexico: Aerospace Foams Market Size, By Material, 2017�2024 (USD Million)
Table 43 Mexico: Aerospace Foams Market Size, By Material, 2017�2024 (Tons)
Table 44 Mexico: Aerospace Foams Market Size, By End Use, 2017�2024 (USD Million)
Table 45 Mexico: Aerospace Foams Market Size, By End Use, 2017�2024 (Tons)
Table 46 Europe: Aerospace Foams Market Size, By Country, 2017�2024 (USD Million)
Table 47 Europe: Aerospace Foams Market Size, By Country, 2017�2024 (Tons)
Table 48 Europe: Aerospace Foams Market Size, By Material, 2017�2024 (USD Million)
Table 49 Europe: Aerospace Foams Market Size, By Material, 2017�2024 (Tons)
Table 50 Europe: Aerospace Foams Market Size, By End Use, 2017�2024 (USD Million)
Table 51 Europe: Aerospace Foams Market Size, By End Use, 2017�2024 (Tons)
Table 52 France: Aerospace Foams Market Size, By Material, 2017�2024 (USD Million)
Table 53 France: Aerospace Foams Market Size, By Material, 2017�2024 (Tons)
Table 54 France: Aerospace Foams Market Size, By End Use, 2017�2024 (USD Million)
Table 55 France: Aerospace Foams Market Size, By End Use, 2017�2024 (Tons)
Table 56 Germany: Aerospace Foams Market Size, By Material, 2017�2024 (USD Million)
Table 57 Germany: Aerospace Foams Market Size, By Material, 2017�2024 (Tons)
Table 58 Germany: Aerospace Foams Market Size, By End Use, 2017�2024 (USD Million)
Table 59 Germany: Aerospace Foam Market Size, By End Use, 2017�2024 (Tons)
Table 60 UK: Aerospace Foams Market Size, By Material, 2017�2024 (USD Million)
Table 61 UK: Aerospace Foams Market Size, By Material, 2017�2024 (Tons)
Table 62 UK: Aerospace Foams Market Size, By End Use, 2017�2024 (USD Million)
Table 63 UK: Aerospace Foam Market Size, By End Use, 2017�2024 (Tons)
Table 64 Russia: Aerospace Foams Market Size, By Material, 2017�2024 (USD Million)
Table 65 Russia: Aerospace Foams Market Size, By Material, 2017�2024 (Tons)
Table 66 Russia: Aerospace Foams Market Size, By End Use, 2017�2024 (USD Million)
Table 67 Russia: Aerospace Foams Market Size, By End Use, 2017�2024 (Tons)
Table 68 Italy: Aerospace Foams Market Size, By Material, 2017�2024 (USD Million)
Table 69 Italy: Aerospace Foams Market Size, By Material, 2017�2024 (Tons)
Table 70 Italy: Aerospace Foams Market Size, By End Use, 2017�2024 (USD Million)
Table 71 Italy: Aerospace Foams Market Size, By End Use, 2017�2024 (Tons)
Table 72 The Netherlands: Aerospace Foams Market Size, By Material, 2017�2024 (USD Million)
Table 73 The Netherlands: Aerospace Foams Market Size, By Material, 2017�2024 (Tons)
Table 74 The Netherlands: Aerospace Foams Market Size, By End Use, 2017�2024 (USD Million)
Table 75 The Netherlands Aerospace Foams Market Size, By End Use, 2017�2024 (Tons)
Table 76 Asia Pacific: Aerospace Foams Market Size, By Country, 2017�2024 (USD Million)
Table 77 Asia Pacific: Aerospace Foams Market Size, By Country, 2017�2024 (Tons)
Table 78 Asia Pacific: Aerospace Foams Market Size, By Material, 2017�2024 (USD Million)
Table 79 Asia Pacific: Aerospace Foams Market Size, By Material, 2017�2024 (Tons)
Table 80 Asia Pacific: Aerospace Foams Market Size, By End Use, 2017�2024(USD Million)
Table 81 Asia Pacific: Aerospace Foam Market Size, By End Use, 2017�2024 (Tons)
Table 82 China: Aerospace Foam Market Size, By Material, 2017�2024 (USD Million)
Table 83 China: Aerospace Foam Market Size, By Material, 2017�2024 (Tons)
Table 84 China: Aerospace Foam Market Size, By End Use, 2017�2024 (USD Million)
Table 85 China: Aerospace Foam Market Size, By End Use, 2017�2024 (Tons)
Table 86 Japan: Aerospace Foams Market Size, By Material, 2017�2024 (USD Million)
Table 87 Japan: Aerospace Foams Market Size, By Material, 2017�2024 (Tons)
Table 88 Japan: Aerospace Foams Market Size, By End Use, 2017�2024(USD Million)
Table 89 Japan: Aerospace Foams Market Size, By End Use, 2017�2024(Tons)
Table 90 Singapore: Aerospace Foams Market Size, By Material, 2017�2024 (USD Million)
Table 91 Singapore: Aerospace Foams Market Size, By Material, 2017�2024 (Tons)
Table 92 Singapore: Aerospace Foams Market Size, By End Use, 2017�2024 (USD Million)
Table 93 Singapore: Aerospace Foam Market Size, By End Use, 2017�2024 (Tons)
Table 94 New Zealand & Australia: Aerospace Foams Market Size, By Material, 2017�2024 (USD Million)
Table 95 New Zealand & Australia: Aerospace Foams Market Size, By Material, 2017�2024 (Tons)
Table 96 New Zealand & Australia: Aerospace Foams Market Size, By End Use, 2017�2024 (USD Million)
Table 97 New Zealand & Australia: Aerospace Foams Market Size, By End Use, 2017�2024 (Tons)
Table 98 Rest of Asia Pacific: Aerospace Foams Market Size, By Material, 2017�2024 (USD Million)
Table 99 Rest of Asia Pacific: Aerospace Foams Market Size, By Material, 2017�2024 (Tons)
Table 100 Rest of Asia Pacific: Aerospace Foams Market Size, By End Use, 2017�2024 (USD Million)
Table 101 Rest of Asia Pacific: Aerospace Foam Market Size, By End Use, 2017�2024 (Tons)
Table 102 Middle East & Africa: Aerospace Foams Market Size, By Country, 2017�2024 (USD Million)
Table 103 Middle East & Africa: Aerospace Foams Market Size, By Country, 2017�2024 (Tons)
Table 104 Middle East & Africa: Aerospace Foams Market Size, By Material, 2017�2024 (USD Million)
Table 105 Middle East & Africa Aerospace Foams Market Size, By Material, 2017�2024 (Tons)
Table 106 Middle East & Africa: Aerospace Foams Market Size, By End Use, 2017�2024 (USD Million)
Table 107 Middle East & Africa: Aerospace Foams Market Size, By End Use, 2017�2024 (Tons)
Table 108 Saudi Arabia: Aerospace Foams Market Size, By Material, 2017�2024 (USD Million)
Table 109 Saudi Arabia: Aerospace Foams Market Size, By Material, 2017�2024 (Tons)
Table 110 Saudi Arabia: Aerospace Foams Market Size, By End Use, 2017�2024 (USD Million)
Table 111 Saudi Arabia: Aerospace Foams Market Size, By End Use, 2017�2024 (Tons)
Table 112 UAE: Aerospace Foams Market Size, By Material, 2017�2024 (USD Million)
Table 113 UAE: Aerospace Foams Market Size, By Material, 2017�2024 (Tons)
Table 114 UAE: Aerospace Foams Market Size, By End Use, 2017�2024 (USD Million)
Table 115 UAE: Aerospace Foams Market Size, By End Use, 2017�2024 (Tons)
Table 116 Rest of Middle East & Africa: Aerospace Foams Market Size, By Material, 2017�2024 (USD Million)
Table 117 Rest of Middle East & Africa: Aerospace Foams Market Size, By Material, 2017�2024 (Tons)
Table 118 Rest of Middle East & Africa: Aerospace Foams Market Size, By End Use, 2017�2024 (USD Million)
Table 119 Rest of Middle East & Africa: Aerospace Foams Market Size, By End Use, 2017�2024 (Tons)
Table 120 South America: Aerospace Foams Market Size, By Country, 2017�2024 (USD Million)
Table 121 South America: Aerospace Foams Market Size, By Country, 2017�2024 (Tons)
Table 122 South America: Aerospace Foams Market Size, By Material, 2017�2024 (USD Million)
Table 123 South America: Aerospace Foams Market Size, By Material, 2017�2024 (Tons)
Table 124 South America: Aerospace Foams Market Size, By End Use, 2017�2024 (USD Million)
Table 125 South America: Aerospace Foams Market Size, By End Use, 2017�2024 (Tons)
Table 126 Brazil: Aerospace Foams Market Size, By Material, 2017�2024 (USD Million)
Table 127 Brazil: Aerospace Foams Market Size, By Material, 2017�2024 (Tons)
Table 128 Brazil: Aerospace Foams Market Size, By End Use, 2017�2024 (USD Million)
Table 129 Brazil: Aerospace Foams Market Size, By End Use, 2017-2024 (Tons)
Table 130 Argentina: Aerospace Foams Market Size, By Material, 2017�2024 (USD Million)
Table 131 Argentina: Aerospace Foams Market Size, By Material, 2017�2024 (Tons)
Table 132 Argentina: Aerospace Foams Market Size, By End Use, 2017�2024 (USD Million)
Table 133 Argentina: Aerospace Foams Market Size, By End Use, 2017�2024 (Tons)
Table 134 Rest of South America: Aerospace Foams Market Size, By Material, 2017�2024 (USD Million)
Table 135 Rest of South America: Aerospace Foams Market Size, By Material, 2017�2024 (Tons)
Table 136 Rest of South America: Aerospace Foams Market Size, By End Use, 2017�2024 (USD Million)
Table 137 Rest of South America: Aerospace Foams Market Size, By End Use, 2017-2024 (Tons)
Table 138 Expansions, 2014�2019
Table 139 Acquisitions, 2014�2019
Table 140 New Product Launches, 2014�2019
Table 141 Investments, 2014�2019
Table 142 Collaborations, 2014�2019
Table 143 New Product Developments, 2014�2019
Table 144 New Technology Developments, 2014�2019
Table 145 Mergers, 2014�2019
Table 146 Agreements, 2014�2019
List of Figures (35 Figures)
Figure 1 Aerospace Foams Market: Research Design
Figure 2 Breakdown of Primary Interviews, By Company, Designation, and Region
Figure 3 Market Size Estimation: Bottom-Up Approach
Figure 4 Market Size Estimation: Top-Down Approach
Figure 5 PU Foam Material Segment Projected to Lead Aerospace Foams Market During Forecast Period
Figure 6 Commercial Aircraft End Use Segment Projected to Lead Aerospace Foams Market During Forecast Period
Figure 7 Middle East & Africa Aerospace Foams Market Projected to Grow at Highest CAGR During Forecast Period
Figure 8 Aerospace Foams Market Projected to Witness High Growth During the Forecast Period Due to High Demand From North America
Figure 9 PU Foams Segment is Estimated to Account for the Largest Share of the North America Aerospace Foams Market in 2019
Figure 10 PU Foam Segment is Projected to Lead the Aerospace Foams Market During the Forecast Period
Figure 11 Commercial Aircraft Segment is Projected to Lead the Aerospace Foams Market During the Forecast Period
Figure 12 South America Aerospace Foams Market to Grow at the Highest CAGR During the Forecast Period
Figure 13 Drivers, Restraints, Opportunities, and Challenges of the Aerospace Foams Market
Figure 14 Global Overview of Estimated Billings for General Aviation Aircraft Manufactured, 2012-2018 (USD Million)
Figure 15 Overview of Aerospace Foams Value Chain
Figure 16 Aerospace Foams Market: Porter�s Five Forces Analysis
Figure 17 PU Foam Segment Projected to Lead Aerospace Foams Market During Forecast Period
Figure 18 Commercial Aircraft Segment Projected to Lead Aerospace Foams Market During Forecast Period
Figure 19 Aerospace Foams Market, Regional Snapshot, 2018
Figure 20 North America: Market Snapshot
Figure 21 European Market Snapshot
Figure 22 Asia Pacific: Aerospace Foams Market Snapshot
Figure 23 Companies Adopted Both Organic and Inorganic Growth Strategies Between January 2014 and October 2019
Figure 24 Aerospace Foams Market: Competitive Landscape Mapping, 2019
Figure 25 Aerospace Foams Market: Emerging Companies Competitive Leadership Mapping, 2019
Figure 26 BASF SE: Company Snapshot
Figure 27 Evonik Industries Ag: Company Snapshot
Figure 28 Rogers Corporation: Company Snapshot
Figure 29 Armacell International S.A.: Company Snapshot
Figure 30 Foampartner: Company Snapshot
Figure 31 SABIC: Company Snapshot
Figure 32 UFP Technologies, Inc.: Company Snapshot
Figure 33 Zotefoams Plc: Company Snapshot
Figure 34 Solvay SA: Company Snapshot
Figure 35 Greiner AG: Company Snapshot
The study involved four major activities in estimating the current size of the aerospace foams market. Exhaustive secondary research was done to collect information on the aerospace foams market, its peer markets, and its parent market. The next step was to validate these findings, assumptions, and sizing with the industry experts across the aerospace foams value chain through primary research. Both top-down and bottom-up approaches were employed to estimate the complete market size. After that, market breakdown and data triangulation were used to estimate the market size of segments and subsegments of the aerospace foams market.
Secondary Research
As a part of the secondary research process, various secondary sources such as Hoovers, Bloomberg, BusinessWeek, and Dun & Bradstreet have been referred to, for identifying and collecting information for this study. These secondary sources included annual reports, press releases & investor presentations of companies, white papers, certified publications, and articles by recognized authors, authenticated directories, and databases.
Secondary research was mainly conducted to obtain key information about the supply chain of the industry, a monetary chain of the market, the total pool of players, and market classification and segmentation according to industry trends to the bottom-most level, regional markets, and key developments undertaken from both, market and technology oriented perspectives.
Primary Research
The aerospace foams market comprises several stakeholders such as raw material suppliers, processors, end-product manufacturers, and regulatory organizations in the supply chain.
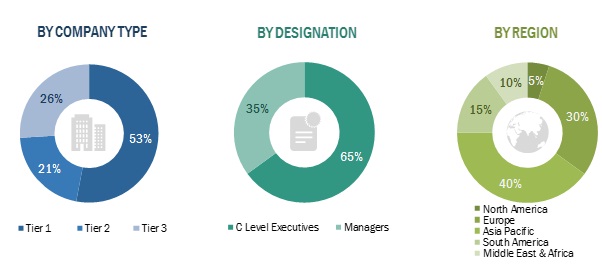
As a part of the primary research process, various primary sources from both supply and demand sides were interviewed to obtain qualitative and quantitative information for this report on the aerospace foams market. Primary sources from the supply side included industry experts such as Chief Executive Officers (CEOs), vice presidents, marketing directors, technology and innovation directors, and related key executives from various key companies and organizations operating in the aerospace foams market. Primary sources from the demand side included directors, marketing heads, and purchase managers from various end-use industries. Following is the breakdown of the primary respondents.
To know about the assumptions considered for the study, download the pdf brochure
Market Size Estimation
Both top-down and bottom-up approaches were used to estimate and validate the total size of the aerospace foams market. These methods were also used extensively to estimate the size of various segments and subsegments of the market. The research methodology used to estimate the market size includes the following:
- The key players in the industry and markets were identified through extensive secondary research.
- The industry�s supply chain and market size, in terms of value and volume, have been determined through primary and secondary research processes.
- All percentage shares, splits, and breakdowns have been determined using secondary sources and verified through primary sources.
Data Triangulation
After arriving at the overall market size-using the market size estimation processes as explained above-the market was split into several segments and subsegments. To complete the overall market engineering process and arrive at the exact statistics of each market segment and subsegment, the data triangulation, and market breakdown procedures were employed, wherever applicable. The data was triangulated by studying various factors and trends from both the demand and supply sides. In addition to this, the market size was validated using both top-down and bottom-up approaches.
Report Objectives
- To define, describe, and forecast the size of the global aerospace foams market based on material, end-use, and region
- To provide detailed information regarding the major factors influencing the growth of the market (drivers, restraints, opportunities, and industry-specific challenges)
- To strategically analyze micromarkets1 with respect to individual growth trends, future prospects, and contribution to the total market
- To analyze the opportunities in the market for stakeholders and details of a competitive landscape for market leaders
- To forecast the revenue of market segments with respect to 5 main regions (along with countries), namely, North America, Europe, Asia Pacific, Middle East & Africa, and South America
- To strategically profile key players and comprehensively analyze their market shares and core competencies
- To track and analyze competitive developments, such as joint ventures, mergers & acquisitions, new product developments, and research & developments in the market
Available Customizations
With the given market data, MarketsandMarkets offers customizations according to the company�s specific needs.
The following customization options are available for the report:
Regional Analysis
- Further breakdown of the North America, Europe, and Asia Pacific aerospace foams market
Product Analysis
- Product matrix, which gives a detailed comparison of the product portfolio of each company
Company Information
- Detailed analysis and profiles of additional market players (up to five)


Growth opportunities and latent adjacency in Aerospace Foams Market
Market size forecast and drivers for aerospace and defense materials.