Extruded Snacks Market by Type (Simply extruded, Expanded, Co-extruded), Raw Material (Wheat, Potato, Corn, Oats, Rice, Multigrain), Manufacturing Method (Single-screw, Twin-screw), Distribution Channel, and Region � Global Forecast to 2026


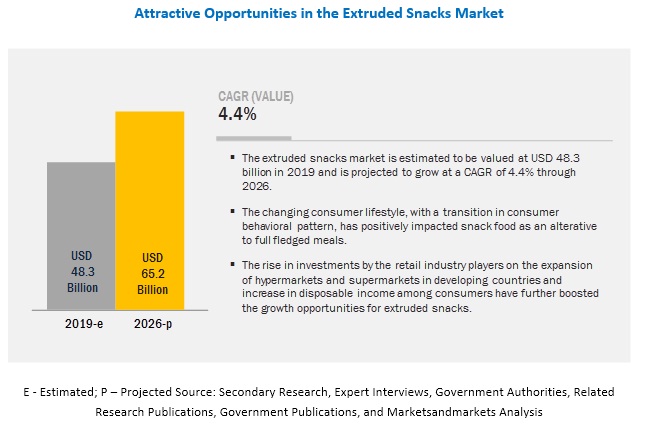
[188 Pages Report] The global extruded snacks market was estimated to account for USD 48.3 billion in 2019 and is projected to reach USD 65.2 billion by 2026, recording a CAGR of 4.4% during the forecast period. The market is primarily driven by the increasing disposable income and changing lifestyle among the millennials.
The market for extruded snacks across the globe is dominated by snacks made from wheat, by raw material.
The wheat segment in the extruded snacks market is estimated to account for the largest share in 2019. Wheat is low in fat and carbohydrates as compared to potato and corn, and high in dietary fibers. Wheat is gaining popularity as a healthy snack option, and manufacturers have been developing products in a wide range of flavors. Companies are also marketing their products by targeting consumers who prefer such healthy snacks and are providing healthier alternatives by replacing conventional raw materials, thereby boosting the overall growth of the extruded snacks market.
The market for expanded snacks is projected to record the highest CAGR during the forecast period.
The expanded snacks segment in the market for extruded snacks is projected to grow at a significant rate. Many multigrain snacks of high fiber and nutrient content fall under this category. The rise in health awareness has increased the popularity of expanded snacks. Consumers have started to prefer snacks that are mostly baked or roasted. Many ingredients, such as corn, multigrain, and rice, are used for these snack productions. These snacks are low in bulk density and are popularized as high-fiber and low-calorie healthy snacks.
The snack sale through the hypermarkets and the supermarkets is estimated to be the highest due to the increasing number of such outlets across the globe.
Among the distribution channels, hypermarkets & supermarkets are estimated to form the largest segment in 2019. It is projected to be the largest as well as the fastest-growing market during the forecast period. The wide range of varieties offered and the advantage of real-time comparison among brands for consumers are the prime reasons for the success of hypermarkets and supermarkets in the overall market for extruded snacks. Also, these formats not only support the on-the-go snacking trend, but also support impulse purchases.
In terms of method of manufacturing, snacks manufactured through a single-screw extruder accounted for the major market share due to low capital expenditure and operational cost.
By the method of manufacturing, the single-screw segment accounted for a larger share in the extruded snacks market in 2018, due to its cheaper price. However, the twin-screw extruders are projected to be the faster-growing segment through 2026. This is because the twin-screw extruder has better mixing ability and higher pumping efficiency than the single-screw extruder. Twin-screw extruders can impart a higher number of possible configurations to the final product, to attain a different shape and has wider adaptability to snack ingredients. The operational efficiency is much higher in the twin-screw extruders than in the single screw extruders. Thus, more manufacturers are shifting from using single-screw extruders to twin-screw extruders.
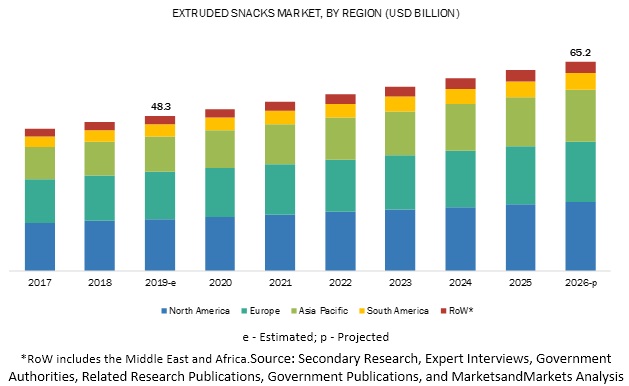
The extruded snacks market in the Asia Pacific region is projected to grow at the highest CAGR from 2019 to 2026.
Factors driving the growth of the Asia Pacific market include the increasing adoption of the Western culture in the region, growing disposable income, and on-the-go snacking trend among the urban population due to busy lifestyles. Due to the developing economic conditions across a majority of the countries, consumers in the region prefer the consumption of cheaper products, and hence, mostly opt for generic or domestic brands. Due to the growing trend of hypermarkets & supermarkets within the region, the availability of such snacks has become much easier, which is further bolstering the market growth in Asia Pacific.
Key Market Players:
Many domestic and global players provide extruded snacks of various types across the world. Major manufacturers have their presence in the North American and European countries. Key players operating in this market include Calbee, Inc. (Japan), PepsiCo, Inc. (US), Kellogg Company (US), Campbell Soup Company (US), General Mills, Inc. (US), ITC Limited (India), Grupo Bimbo, S.A.B. de C.V. (Mexico), Old Dutch Foods Inc. (US), Lorenz Snack-World (Germany) , Amica Chips S.p.A. (Italy), Universal Robina Corporation (Philippines), Balance Foods, Inc. (US), JFC International (US), Ballreich Snack Food Company (US), Barrel O’ Fun Snack Foods Co., Inc. (US), Chipita S.A.(Greece), Tropical Heat (Kenya), Griffin’s Foods Limited (New Zealand), ICA Foods International (Italy), and San Carlo (Italy).
Scope of the report
|
Report Metric |
Details |
|
Market size estimation |
2017–2026 |
|
Base year considered |
2018 |
|
Forecast period considered |
2019–2026 |
|
Units considered |
Value (USD) and Volume (KT) |
|
Segments covered |
|
|
Regions covered |
|
|
Companies studied |
|
Target Audience:
- Supply-side: Extruded snacks manufacturers, extruder manufacturers, raw material suppliers, snack pellet manufacturers, importers, and exporters
- Demand-side: Retailers, distributors, and wholesalers of extruded snacks
- Regulatory side: Concerned government authorities, commercial research & development (R&D) institutions, and other regulatory bodies
- Associations and industry bodies: Food and Agriculture Organization (FAO), United States Department of Agriculture (USDA), European Snacks Association (ESA), SNAC International, All India Food Processors' Association, The Snack, Nut and Crisp Manufacturers Association (SNACMA), Organisation for Economic Co-operation and Development (OECD), and Canadian Snack Food Association
Type
- Simply extruded
- Expanded
- Co-extruded
Raw material
- Wheat
- Potato
- Corn
- Rice
- Multigrain
- Oats
- Other raw materials ( meat, peas, fruits, pulses)
Method of Manufacturing
- Single-screw extruder
- Twin-screw extruder
Distribution Channel
- Convenience stores
- Hypermarkets & supermarkets
- E-commerce platforms
- Other distribution channels (Non grocery, mixed retailers, etc)
Region
- North America
- Europe
- Asia Pacific
- South America
- Rest of the World (RoW)
Recent Developments
- In October 2019, Calbee (US) acquired Warnock Food Products, Inc. to expand its presence in the US market and neighboring countries.
- In October 2018, Calbee (UK) Ltd. acquired Seabrook Crisps Ltd. to expand its presence in the UK.
- In May 2018, PepsiCo (US) acquired Bare Snacks, a healthy snack manufacturing company, which would help it to extend its portfolio in the healthy snacks segment.
- In May 2018, the Kellogg Company (US) acquired an incremental 1% ownership interest in Multipro, a leading distributor of various food products in Nigeria and Ghana.
- In March 2018, Campbell Soup Company (US) acquired Snyder’s-Lance to expand its product portfolio and expand its consumer base.
- In January 2018, General Mills, Inc. (US) invested in a plant-based food company, Urban Remedy, a producer of a variety of ready-to-eat plant-based meals, snacks, and cold-pressed juices that are organic-certified and non-GMO products. This would help General Mills to expand its product portfolio for plant-based products.
- In 2017, Chipita (Greece) entered a joint venture with Britannia in India to capture the fast-growing Indian market.
Key Questions Addressed by the Report
- Which region will account for the largest share in the extruded snacks market?
- What are the trends and factors responsible for influencing the adoption rate of low calories extruded snacks in key emerging countries?
- What is the level of support offered by governments across these countries to the snacks manufacturers?
- Which are the key players in the market, and how intense is the competition?
- What future opportunities should market players look for?
Frequently Asked Questions (FAQ):
What are the major drivers identified for this market?
Following are the major drivers enlisted in the market study:
- Changing consumer lifestyles and consumption patterns increase the need for convenience in foods
- Expansion in the retail industry resulting in a huge number of hypermarkets and supermarkets across the globe
- Immense growth in the disposable incomes of consumers encourages impulse purchases
Is country-level analysis considered in the study? Our main interest is in North American and European countries?
Major countries in North America and Europe have been covered in the study report:
- US
- Canada
- Mexico
- Germany
- France
- Italy
- Spain
- UK
- Netherlands
- Rest of Europe
What is the basic methodology used for market sizing?
We conduct top down and bottom up, both the approaches for market estimations. Validation is done from various sources such as
- Demand Side
- Supply Side
We want to understand the overall value chain.
We can offer you the same in detail at global and regional level which includes
- Value Chain Flowchart
- Description at each stage
- Market share at each stage
To speak to our analyst for a discussion on the above findings, click Speak to Analyst
 Exclusive indicates content/data unique to MarketsandMarkets and not available with any competitors.
Table of Contents
1 Introduction (Page No. - 19)
1.1 Objectives of the Study
1.2 Market Definition
1.3 Market Segmentation
1.3.1 Regions Covered
1.3.2 Periodization Considered for the Study
1.4 Currency Considered
1.5 Units Considered
1.6 Stakeholders
2 Research Methodology (Page No. - 24)
2.1 Research Data
2.1.1 Secondary Data
2.1.1.1 Key Data From Secondary Sources
2.1.2 Primary Data
2.1.2.1 Key Data From Primary Sources
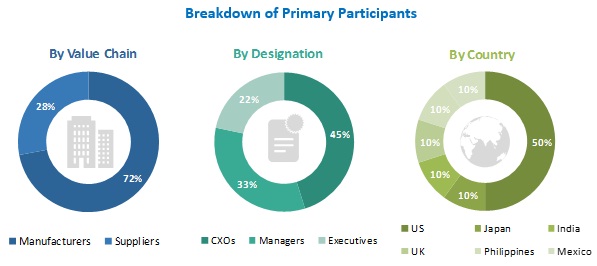
2.1.2.2 Breakdown of Primaries
2.2 Market Size Estimation
2.2.1 Approach One (Based on Type, By Region)
2.2.2 Approach Two (Based on the Global Market)
2.3 Data Triangulation
2.4 Assumptions for the Study
2.5 Limitations of the Study
3 Executive Summary (Page No. - 33)
4 Premium Insights (Page No. - 38)
4.1 Overview of the Market
4.2 Extruded Snacks Market, By Region
4.3 Market, By Raw Material
4.4 Market, By Type
4.5 North America: Extruded Snacks Market, By Type and Country
5 Market Overview (Page No. - 44)
5.1 Introduction
5.2 Market Dynamics
5.2.1 Drivers
5.2.1.1 Changing Consumer Lifestyles and Consumption Patterns Increase the Need for Convenience in Foods
5.2.1.2 Expansion of the Retail Industry Resulting in A Huge Number of Hypermarkets and Supermarkets Across the Globe
5.2.1.3 Immense Growth in the Disposable Income of Consumers Encourages Impulse Purchases
5.2.2 Restraints
5.2.2.1 Increased Cost of Raw Material and Production
5.2.3 Opportunities
5.2.3.1 Increase in the Demand for Healthy Snacks
5.2.3.2 Technological Advancements in Extrusion & Processing
5.2.3.3 Government Initiatives and Investments to Fuel the Demand for Processed and Extruded Food
5.2.4 Challenges
5.2.4.1 High Competition From Local Players of an Unorganized Market
5.2.4.2 Lack of Transport and Infrastructure Support in Emerging Markets
5.3 Regulations
5.4 Supply Chain
5.5 YC-YCC Shift
6 Extruded Snacks Market, By Type (Page No. - 55)
6.1 Introduction
6.2 Simply Extruded Snacks
6.2.1 Traditionally One of the Highest Consumed Extruded Snack Globally
6.3 Expanded Snacks
6.3.1 There has Been A Rising Demand for Baked Expanded Snacks
6.4 Co-Extruded Snacks
6.4.1 On-The-Go Snacking Trend has Been Driving Its Demand
7 Extruded Snacks Market, By Raw Material (Page No. - 60)
7.1 Introduction
7.2 Wheat
7.2.1 Health-Conscious Consumers Prefer More of Wheat-Based Snacks
7.3 Potato
7.3.1 Potato is the Most Popular Ingredient for Extruded Snacks
7.4 Corn
7.4.1 Corn is Healthier Than Potato as A Raw Material for Extruded Snacks
7.5 Multigrain
7.5.1 Multigrain Snacks are Becoming A Popular Choice Among Health-Conscious Consumers
7.6 Oats
7.6.1 Awareness of Health Benefits of Oats Makes It A Preferred Option Among Young Consumers
7.7 Rice
7.7.1 Rice is One of the Popular Choices in Asia Pacific
7.8 Other Raw Materials
8 Extruded Snacks Market, By Method of Manufacturing (Page No. - 72)
8.1 Introduction
8.2 Single Screw
8.2.1 Easy Maintenance and Low Operation Cost Drive the Use of Single-Screw Extruders
8.3 Twin Screw
8.3.1 Greater Flexibility and Higher Productivity Drive the Use of Twin-Screw Extruders
9 Extruded Snacks Market, By Distribution Channel (Page No. - 76)
9.1 Introduction
9.2 Hypermarkets & Supermarkets
9.2.1 One-Stop Destination That is Complementary to Impulsive Buying in the Millennial Generation
9.3 Convenience Stores
9.3.1 Fast Shopping, Fast Exit Complement Newer Lifestyles
9.4 E-Commerce Platforms
9.4.1 A High-Growth Opportunity for Extruded Snacks
9.5 Other Distribution Channels
10 Extruded Snacks Market, By Region (Page No. - 82)
10.1 Introduction
10.2 North America
10.2.1 US
10.2.1.1 High Consumption of Snacks By the Millennial Generation is Causing the Extruded Snacks Market to Flourish in the US
10.2.2 Canada
10.2.2.1 The Snack Industry in Canada is Expanding Due to Its Export of Snacks to Other Countries
10.2.3 Mexico
10.2.3.1 The Increase in Awareness of Healthy Snacks Consumption is Driving the Market in Mexico
10.3 Europe
10.3.1 UK
10.3.1.1 Busy Lifestyles of Consumers Boosting the Demand for Snacks in the Country
10.3.2 Germany
10.3.2.1 High-Income Levels of Consumers Driving the Market
10.3.3 France
10.3.3.1 Availability of A Wide Variety of Snacks
10.3.4 Italy
10.3.4.1 The Increasing Number of the Working Population is A Market Driver
10.3.5 Spain
10.3.5.1 Innovations in Vegetable Snacks Driving Growth
10.3.6 Netherlands
10.3.6.1 Changing Lifestyles of Consumers Resulting in the Rise in Demand for Snacks
10.3.7 Rest of Europe
10.4 Asia Pacific
10.4.1 China
10.4.1.1 Dramatic Change in Consumer Lifestyles in the Urban Areas Drives the Growth of this Market
10.4.2 Japan
10.4.2.1 The Easy Accessibility to Supermarkets and Hypermarkets in Japan has Caused the Snack Market to Acquire A Larger Market Share
10.4.3 India
10.4.3.1 Millennial Population is the Prime Reason for the High Demand for Snacks
10.4.4 Indonesia
10.4.4.1 Affordable Price and Easy Availability of Raw Materials Leading to the Fast Growth of the Global Market in Indonesia
10.4.5 Australia
10.4.5.1 Demand for High-Value and Gourmet Products has Caused the Extruded Snack Industry in Australia to Witness Significant Growth
10.4.6 New Zealand
10.4.6.1 Consumer Willingness to Pay for Better-Quality Savory Snacks is Driving the Innovation in the Snack Industry
10.4.7 Rest of Asia Pacific
10.5 South America
10.5.1 Brazil
10.5.1.1 Sophistication and High Value Associated With Packaged Snack Products Drives the Brazilian Snack Market
10.5.2 Argentina
10.5.2.1 Wide Range of Product Launches in the Country in Recent Past
10.5.3 Rest of South America
10.6 Rest of the World
10.6.1 Middle East
10.6.1.1 International Brands Occupy A Larger Share in the Middle East
10.6.2 Africa
10.6.2.1 Low Disposable Income Across A Few African Countries Limits Growth Opportunities
11 Competitive Landscape (Page No. - 134)
11.1 Overview
11.2 Competitive Leadership Mapping
11.2.1 Terminology/Nomenclature
11.2.1.1 Visionary Leaders
11.2.1.2 Innovators
11.2.1.3 Dynamic Differentiators
11.2.1.4 Emerging Companies
11.2.2 Strength of Product Portfolio
11.3 Ranking of Key Players
11.4 Competitive Scenario
11.4.1 New Product Launches
11.4.2 Expansions & Investments
11.4.3 Acquisitions
11.4.4 Joint Ventures
12 Company Profiles (Page No. - 143)
(Business Overview, Products Offered, Recent Developments, SWOT Analysis, Right to Win)*
12.1 Calbee, Inc.
12.2 Pepsico, Inc.
12.3 Kellogg Company
12.4 Campbell Soup Company
12.5 General Mills, Inc.
12.6 ITC Limited
12.7 Grupo Bimbo, S.A.B. De C.V.
12.8 Old Dutch Foods Inc.
12.9 Lorenz Snack-World
12.10 Amica Chips S.P.A.
12.11 Universal Robina Corporation
12.12 Balance Foods, Inc.
12.13 JFC International
12.14 Ballreich Snack Food Company
12.15 Barrel O' Fun Snack Foods Co., Inc.
12.16 Chipita S.A.
12.17 Tropical Heat
12.18 Griffin’s Foods Limited
12.19 ICA Foods International
12.20 SAN Carlo
*Details on Business Overview, Products Offered, Recent Developments, SWOT Analysis, Right to Win Might Not Be Captured in Case of Unlisted Companies.
13 Appendix (Page No. - 179)
13.1 Discussion Guide
13.2 Knowledge Store: Marketsandmarkets’ Subscription Portal
13.3 Available Customizations
13.4 Related Reports
13.5 Author Details
List of Tables (109 Tables)
Table 1 USD Exchange Rates, 2014–2018
Table 2 Regulations on the Use of Food Additives in Snacks
Table 3 Extruded Snacks Market Size, By Type, 2017–2026 (USD Million)
Table 4 Simply Extruded Snacks Market Size, By Region, 2017–2026 (USD Million)
Table 5 Expanded Snacks Market Size, By Region, 2017–2026 (USD Million)
Table 6 Market Size for Extruded Snacks, By Region, 2017–2026 (USD Million)
Table 7 Market Size for Extruded Snacks, By Raw Material, 2017–2026 (USD Million)
Table 8 Market Size for Extruded Snacks, By Raw Material, 2017–2026 (Kt)
Table 9 Extruded Wheat Snacks Market Size, By Region, 2017–2026 (USD Million)
Table 10 Extruded Wheat Snacks Market Size, By Region, 2017–2026 (Kt)
Table 11 Extruded Potato Snacks Market Size, By Region, 2017–2026 (USD Million)
Table 12 Extruded Potato Snacks Market Size, By Region, 2017–2026 (Kt)
Table 13 Extruded Corn Snacks Market Size, By Region, 2017–2026 (USD Million)
Table 14 Extruded Corn Snacks Market Size, By Region, 2017–2026 (Kt)
Table 15 Extruded Multigrain Snacks Market Size, By Region, 2017–2026 (USD Million)
Table 16 Extruded Multigrain Snacks Market Size, By Region, 2017–2026 (Kt)
Table 17 Extruded Oats Snacks Market Size, By Region, 2017–2026 (USD Million)
Table 18 Extruded Oats Snacks Market Size, By Region, 2017–2026 (Kt)
Table 19 Extruded Rice Snacks Market Size, By Region, 2017–2026 (USD Million)
Table 20 Extruded Rice Snacks Market Size, By Region, 2017–2026 (Kt)
Table 21 Other Raw Materials Extruded Snacks Market Size, By Region, 2017–2026 (USD Million)
Table 22 Other Raw Materials Extruded Snacks Market Size, By Region, 2017–2026 (Kt)
Table 23 Difference Between Single-Screw and Twin-Screw Extruders
Table 24 Market Size for Extruded Snacks, By Method of Manufacturing, 2017–2026 (USD Million)
Table 25 Market Size for Extruded Snacks, By Distribution Channel, 2017–2026 (USD Million)
Table 26 Hypermarkets & Supermarkets Market Size, By Region, 2017–2026 (USD Million)
Table 27 Convenience Stores Market Size, By Region, 2017–2026 (USD Million)
Table 28 E-Commerce Platforms Market Size, By Region, 2017–2026 (USD Million)
Table 29 Other Distribution Channels Market Size, By Region, 2017–2026 (USD Million)
Table 30 Market Size for Extruded Snacks, By Region, 2017–2026 (USD Million)
Table 31 Market Size for Extruded Snacks, By Region, 2017–2026 (Kt)
Table 32 North America: Extruded Snacks Market Size, By Country, 2017–2026 (USD Million)
Table 33 North America: Market Size, By Country, 2017–2026 (Kt)
Table 34 North America: Market Size, By Raw Material, 2017–2026 (USD Million)
Table 35 North America: Market Size, By Raw Material, 2017–2026 (Kt)
Table 36 North America: Market Size, By Type, 2017–2026 (USD Million)
Table 37 North America: Market Size, By Distribution Channel, 2017–2026 (USD Million)
Table 38 US: Extruded Snacks Market Size, By Raw Material, 2017–2026 (USD Million)
Table 39 US: Market Size, By Type, 2017–2026 (USD Million)
Table 40 Canada: Market Size for Extruded Snacks, By Raw Material, 2017–2026 (USD Million)
Table 41 Canada: Market Size, By Type, 2017–2026 (USD Million)
Table 42 Mexico: Market Size for Extruded Snacks, By Raw Material, 2017–2026 (USD Million)
Table 43 Mexico: Market Size, By Type, 2017–2026 (USD Million)
Table 44 Europe: Market Size for Extruded Snacks, By Country, 2017–2026 (USD Million)
Table 45 Europe: Market Size, By Country, 2017–2026 (Kt)
Table 46 Europe: Market Size, By Raw Material, 2017–2026 (USD Million)
Table 47 Europe: Market Size, By Raw Material, 2017–2026 (Kt)
Table 48 Europe: Market Size, By Type, 2017–2026 (USD Million)
Table 49 Europe: Market Size, By Distribution Channel, 2017–2026 (USD Million)
Table 50 UK: Market Size for Extruded Snacks, By Raw Material, 2017–2026 (USD Million)
Table 51 UK: Market Size for Extruded Snacks, By Type, 2017–2026 (USD Million)
Table 52 Germany: Extruded Snacks Market Size, By Raw Material, 2017–2026 (USD Million)
Table 53 Germany: Market Size for Extruded Snacks, By Type, 2017–2026 (USD Million)
Table 54 France: Market Size for Extruded Snacks, By Raw Material, 2017–2026 (USD Million)
Table 55 France: Market Size for Extruded Snacks, By Type, 2017–2026 (USD Million)
Table 56 Italy: Market Size for Extruded Snacks, By Raw Material, 2017–2026 (USD Million)
Table 57 Italy: Market Size for Extruded Snacks, By Type, 2017–2026 (USD Million)
Table 58 Spain: Market Size for Extruded Snacks, By Raw Material, 2017–2026 (USD Million)
Table 59 Spain: Market Size for Extruded Snacks, By Type, 2017–2026 (USD Million)
Table 60 Netherlands: Market Size for Extruded Snacks, By Raw Material, 2017–2026 (USD Million)
Table 61 Netherlands: Market Size for Extruded Snacks, By Type, 2017–2026 (USD Million)
Table 62 Rest of Europe: Extruded Snacks Market Size, By Raw Material, 2017–2026 (USD Million)
Table 63 Rest of Europe: Market Size for Extruded Snacks, By Type, 2017–2026 (USD Million)
Table 64 Asia Pacific: Market Size for Extruded Snacks, By Country, 2017–2026 (USD Million)
Table 65 Asia Pacific: Market Size for Extruded Snacks, By Country, 2017–2026 (Kt)
Table 66 Asia Pacific: Market Size for Extruded Snacks, By Raw Material, 2017–2026 (USD Million)
Table 67 Asia Pacific: Market Size for Extruded Snacks, By Raw Material, 2017–2026 (Kt)
Table 68 Asia Pacific: Market Size for Extruded Snacks, By Type, 2017–2026 (USD Million)
Table 69 Asia Pacific: Market Size for Extruded Snacks, By Distribution Channel, 2017–2026 (USD Million)
Table 70 China: Extruded Snacks Market Size, By Raw Material, 2017–2026 (USD Million)
Table 71 China: Market Size for Extruded Snacks, By Type, 2017–2026 (USD Million)
Table 72 Japan: Market Size for Extruded Snacks, By Raw Material, 2017–2026 (USD Million)
Table 73 Japan: Market Size for Extruded Snacks, By Type, 2017–2026 (USD Million)
Table 74 India: Market Size for Extruded Snacks, By Raw Material, 2017–2026 (USD Million)
Table 75 India: Market Size for Extruded Snacks, By Type, 2017–2026 (USD Million)
Table 76 Indonesia: Market Size for Extruded Snacks, By Raw Material, 2017–2026 (USD Million)
Table 77 Indonesia: Market Size for Extruded Snacks, By Type, 2017–2026 (USD Million)
Table 78 Australia: Market Size for Extruded Snacks, By Raw Material, 2017–2026 (USD Million)
Table 79 Australia: Market Size for Extruded Snacks, By Type, 2017–2026 (USD Million)
Table 80 New Zealand: Market Size for Extruded Snacks, By Raw Material, 2017–2026 (USD Million)
Table 81 New Zealand: Market Size for Extruded Snacks, By Type, 2017–2026 (USD Million)
Table 82 Rest of Asia Pacific: Market Size for Extruded Snacks, By Raw Material, 2017–2026 (USD Million)
Table 83 Rest of Asia Pacific: Market Size for Extruded Snacks, By Type, 2017–2026 (USD Million)
Table 84 South America: Market Size for Extruded Snacks, By Country, 2017–2026 (USD Million)
Table 85 South America: Market Size for Extruded Snacks, By Country, 2017–2026 (Kt)
Table 86 South America: Market Size for Extruded Snacks, By Raw Material, 2017–2026 (USD Million)
Table 87 South America: Market Size for Extruded Snacks, By Raw Material, 2017–2026 (Kt)
Table 88 South America: Market Size for Extruded Snacks, By Type, 2017–2026 (USD Million)
Table 89 South America: Market Size for Extruded Snacks, By Distribution Channel, 2017–2026 (USD Million)
Table 90 Brazil: Extruded Snacks Market Size, By Raw Material, 2017–2026 (USD Million)
Table 91 Brazil: Market Size for Extruded Snacks, By Type, 2017–2026 (USD Million)
Table 92 Argentina: Market Size for Extruded Snacks, By Raw Material, 2017–2026 (USD Million)
Table 93 Argentina: Market Size for Extruded Snacks, By Type, 2017–2026 (USD Million)
Table 94 Rest of South America: Extruded Snacks Market Size, By Raw Material, 2017–2026 (USD Million)
Table 95 Rest of South America: Market Size for Extruded Snacks, By Type, 2017–2026 (USD Million)
Table 96 RoW: Extruded Snacks Market Size, By Region, 2017–2026 (USD Million)
Table 97 RoW: Market Size, By Region, 2017–2026 (Kt)
Table 98 RoW: Market Size, By Raw Material, 2017–2026 (USD Million)
Table 99 RoW: Market Size, By Raw Material, 2017–2026 (Kt)
Table 100 RoW: Market Size, By Type, 2017–2026 (USD Million)
Table 101 RoW: Market Size, By Distribution Channel, 2017–2026 (USD Million)
Table 102 Middle East: Market Size for Extruded Snacks, By Raw Material, 2017–2026 (USD Million)
Table 103 Middle East: Market Size, By Type, 2017–2026 (USD Million)
Table 104 Africa: Market Size for Extruded Snacks, By Raw Material, 2017–2026 (USD Million)
Table 105 Africa: Market Size, By Type, 2017–2026 (USD Million)
Table 106 New Product Launches, 2017
Table 107 Expansions & Investments, 2017–2018
Table 108 Acquisitions, 2017–2019
Table 109 Joint Ventures, 2017
List of Figures (39 Figures)
Figure 1 Research Design
Figure 2 Data Triangulation Methodology
Figure 3 Market Snapshot, By Raw Material, 2019 vs. 2026 (Value)
Figure 4 Extruded Snacks Market Size, By Type, 2019 vs. 2026
Figure 5 Market Size, By Distribution Channel, 2019 vs. 2026 (USD Million)
Figure 6 Market Size, By Method of Manufacturing, 2019 vs. 2026
Figure 7 Asia Pacific to Grow at the Highest CAGR in the Market, 2019–2026
Figure 8 Extruded Snacks Market Share and Growth, By Region
Figure 9 Extruded Snacks: an Emerging Market With Steady-Growth Potential
Figure 10 Asia Pacific to Grow at the Highest Rate in the Market From 2019 to 2026
Figure 11 The Rice Segment, on the Basis of Raw Material, is Projected to Grow the Fastest From 2019 to 2026
Figure 12 The Simply Extruded Snacks Segment to Account for the Largest Share From 2019 to 2026 (Value)
Figure 13 The Simply Extruded Snacks Segment, on the Basis of Type, Accounted for the Largest Share in the North American Extruded Snacks Market in 2018
Figure 14 Asia Pacific Countries are Projected to Grow at High Rates During the Forecast Period
Figure 15 Process of Extrusion
Figure 16 Extruded Snacks Market: Drivers, Restraints, Opportunities, and Challenges
Figure 17 Household Disposable Income, 2018 (USD/Capita)
Figure 18 Fluctuation in the Price of Potato in South Africa, 2013–2018 (USD/Ton)
Figure 19 Obesity Among Adults, By Key Country, 2015
Figure 20 Extruded Snacks Market: Supply Chain Analysis
Figure 21 YC-YCC Shift for the Market
Figure 22 Extruded Snacks Market Size, By Type, 2019 vs. 2026 (USD Million)
Figure 23 Market Size, By Raw Material, 2019 vs. 2026 (USD Million)
Figure 24 Market Size, By Method of Manufacturing, 2019 vs. 2026 (USD Million)
Figure 25 Market Size, By Distribution Channel, 2019 vs. 2026 (USD Million)
Figure 26 The Us Accounted for the Largest Market Share in the Market in 2018
Figure 27 North America: Extruded Snacks Snapshot
Figure 28 Asia Pacific: Extruded Snacks Snapshot
Figure 29 Key Developments of the Leading Players in the Market, 2017–2019
Figure 30 Global Market: Competitive Leadership Mapping, 2018
Figure 31 Extruded Snacks Market: Player Ranking in 2018
Figure 32 Market Evaluation Framework, 2017–2019
Figure 33 Calbee, Inc.: Company Snapshot
Figure 34 Pepsico, Inc.: Company Snapshot
Figure 35 Kellogg Company: Company Snapshot
Figure 36 Campbell Soup Company: Company Snapshot
Figure 37 General Mills, Inc.: Company Snapshot
Figure 38 ITC Limited: Company Snapshot
Figure 39 Grupo Bimbo, S.A.B. De C.V.: Company Snapshot
The study involved four major activities for estimating the market size of extruded snacks. Exhaustive secondary research was conducted to collect information on the market, peer market, and parent market. The next step was to validate these findings, assumptions, and sizing with industry experts across the value chain through primary research. Both the top-down and bottom-up approaches were employed to estimate the complete market size. Thereafter, market breakdown and data triangulation were used to estimate the market size of the segments and subsegments.
Secondary Research
In the secondary research process, various sources such as the Food and Agriculture Organization (FAO), United States Department of Agriculture (USDA), European Snacks Association (ESA), SNAC International, All India Food Processors' Association, The Snack, Nut and Crisp Manufacturers Association (SNACMA), Organisation for Economic Co-operation and Development (OECD), and Canadian Snack Food Association were referred to, to identify and collect information for this study. The secondary sources also include clinical studies and journals, press releases, investor presentations of companies, white papers, certified publications, articles by recognized authors and regulatory bodies, trade directories, and paid databases.
Secondary research was mainly conducted to obtain key information about the industry’s supply chain, the total pool of key players, market classification & segmentation according to the industry trends to the bottom-most level, and geographical markets. It was also used to obtain information about the key developments from a market-oriented perspective.
Primary Research
The market comprises several stakeholders in the supply chain, which include raw material suppliers and extruded snack manufacturers. Various primary sources from both the supply and demand sides of the market were interviewed to obtain qualitative and quantitative information. The primary interviewees from the supply-side include exogenous extruded snack manufacturers. The primary sources from the demand-side include distributors, wholesalers, importers, and exporters of extruded snacks.
To know about the assumptions considered for the study, download the pdf brochure
Market Size Estimation
Both the top-down and bottom-up approaches were used to estimate and validate the total size of the extruded snacks market. These approaches were also used extensively to estimate the size of various subsegments in the market in the market for the base year (2018) in terms of value. The research methodology used to estimate the market size includes the following:
- The key players in the industry and markets were identified through extensive secondary research.
- All possible parameters that affect the markets covered in this research study were accounted for, viewed in extensive detail, verified through primary research, and analyzed to obtain the final quantitative and qualitative data.
- All percentage shares, splits, and breakdowns were determined using secondary sources and verified through primary sources.
- The research included the study of reports, reviews, and newsletters of top market players, along with the extensive interviews for opinions from leaders such as CEOs, directors, and marketing executives.
Data Triangulation
After arriving at the overall market size from the estimation process explained above, the total market was split into several segments and sub-segments. To estimate the overall market and arrive at the exact statistics for all segments and sub-segments, the data triangulation and market breakdown procedures were employed, wherever applicable. The data was triangulated by studying various factors and trends from the demand and supply sides. Along with this, the market size was validated using both the top-down and bottom-up approaches.
Report Objectives
Market Intelligence
- Determining and projecting the size of the extruded snacks market, with respect to raw material, type, method of manufacturing, distribution channel, and regional markets, over a seven-year period, ranging from 2019 to 2026
- Identifying the attractive opportunities in the market by determining the largest and fastest-growing segments across regions
- Providing detailed information about the key factors influencing the growth of the market (drivers, restraints, opportunities, and industry-specific challenges)
- Analyzing the micromarkets, with respect to individual growth trends, prospects, and their contribution to the total market
Competitive Intelligence
- Identifying and profiling the key market players in the extruded snacks market
- Providing a comparative analysis of market leaders on the basis of the following:
- Product offerings
- Business strategies
- Strengths and weaknesses
- Key financials
- Understanding the competitive landscape and identifying the major growth strategies adopted by players across the key regions
- Analyzing the value chain and products across the key regions and their impact on the prominent market players
- Providing insights into key product innovations and investments in the extruded snacks market
Available Customizations
With the given market data, MarketsandMarkets offers customizations according to client-specific needs.
The following customization options are available for the report:
Geographic Analysis
- Further breakdown of the Rest of Asia Pacific extruded snacks market into South Korea, Malaysia, Taiwan, Pakistan, and Singapore
- Further breakdown of the Rest of South America extruded snacks market into Colombia, Chile, and Peru
- Further breakdown of the Rest of Europe extruded snacks market into Poland, Russia, Belgium, and other EU and non-EU countries
Segmental Analysis
- Further breakdown of the extruded snacks type market, by raw material
- Further breakdown of the other raw materials in the extruded snacks market
Company Information
- Detailed analysis and profiling of additional market players (up to five)
Company Information
- Detailed analyses and profiling of additional market players (Up to five)


Growth opportunities and latent adjacency in Extruded Snacks Market