Fatty Amides Market by Type (Erucamide, Behenamide, Oleamide, Others), Product Form (Bead and Powder), Function (Anti-block, Slip Agent, Release Agents), End-use industry (Film processing, Rubber, Ink, Others), and Region - Global Forecast to 2022


[201 Pages Report] fatty amides market size is projected to grow from USD 309.9 Million in 2016 to USD 391.5 Million by 2022, at a CAGR of 4.07% during the forecast period. The base year considered for the study is 2016, and the market size is projected from 2017 to 2022.
The report aims at estimating the market size and future growth potential of the fatty amides market across different segments�type, product form, function, end-use industry, and region. The other objectives include providing detailed information regarding the main factors influencing the growth of the market (drivers, restraints, opportunities, and industry-specific challenges). It also aims to study the individual growth trends, prospects, and contribution of the various segments to the total market. The study also analyzes opportunities in the market for stakeholders and provides details of the competitive landscape for the market leaders. The study strategically profiles key players and comprehensively analyzes their core competencies.
The research methodology used to estimate and forecast the fatty amides market begins with capturing data on key vendor revenues through secondary research and associations such as the Fatty Acid Consortium, American Cleaning Institute, and the Asean Oleochemical Manufacturers Group. Vendor offerings are also taken into consideration to determine the market segmentation. The bottom-up procedure was employed to arrive at the overall size of the global fatty amides market from the revenues of key players. After arriving at the overall market size, the total market was split into several segments and subsegments, which were then verified through primary research by conducting extensive interviews with key people such as CEOs, VPs, directors, and executives. These data triangulation and market breakdown procedures were employed to complete the overall market engineering process and arrive at the exact statistics for all segments and subsegments. The breakdown of profiles of primary participants is depicted in the figure below:
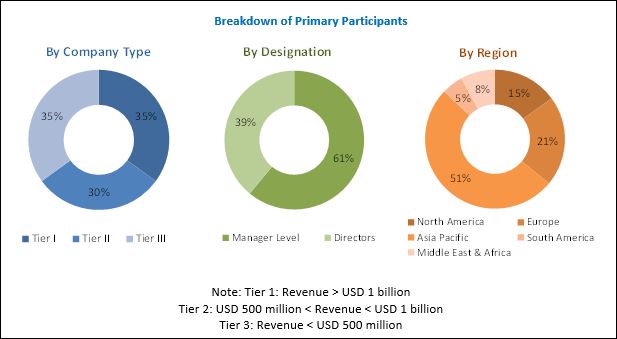
To know about the assumptions considered for the study, download the pdf brochure
The market ecosystem includes various stakeholders involved in the supply chain of the fatty amides industry starting from raw material suppliers, research & development, and manufacturing. Post this, the marketing and sales of the products take place which is only possible if an efficient distribution channel is developed. Finally, the end products are made available to consumers. The global market for fatty amides market is dominated by players such as Croda International (UK), Kuala Lumpur Kepong Berhad (Malaysia), Italmatch Chemicals (Italy), PMC Biogenix (US), Kao Corporation (Japan), Fine Organics (India), Nippon Fine Chemical (Japan), Haihang Industry (China), Mitsubishi Chemical (Japan), and BASF (Germany)
Target Audience
- Fatty amide material producers
- Raw material producers and suppliers
- Fatty amide distributors and traders
- End-use sectors
- Governments and R&D institutions
- Associations and industry bodies
Scope of the Report
The research report segments the fatty amides market into the following submarkets:
Fatty Amides Market, By Type:
- Erucamide
- Behenamide
- Stearamide
- Oleamide
- Others
Fatty Amides Market, By Product Form:
- Bead
- Powder
- Others
Fatty Amides Market, By Function:
- Slip agent
- Dispersant
- Lubricant
- Anti-Block agent
- Release agent
- Others
Fatty Amides Market, By End-use Industry:
- Film processing
- Injection molding
- Ink
- Rubber
- Others
Fatty Amides Market, By Region:
- North America
- Europe
- Asia Pacific
- Middle East & Africa
- South America
Available Customizations
With the given market data, MarketsandMarkets offers customizations according to client-specific needs. The following customization options are available for the report:
Product Analysis
- Product Matrix, which gives a detailed comparison of the product portfolio of each company
Geographic Analysis
- Further analysis of the fatty amides market for additional countries
Company Information
- Detailed analysis and profiling of additional market players
MarketsandMarkets projects that the fatty amides market size will grow from USD 320.7 Million in 2017 to USD 391.5 Million by 2022, at a CAGR of 4.07%. The fatty amides market is witnessing considerable growth due to growing demand for environmentally friendly products over petroleum-based ones. Increasing applications in end-user industries such as food & beverages, soaps & detergents, and pharmaceutical & personal care provide several opportunities for the growth of the fatty amides market.
The fatty amides market, by type, is segmented into erucamide, oleamide, stearamide, behenamide, and others. The erucamide segment accounted for the largest market share in 2016. Erucamide is used as an adhesive and sealant chemical, lubricant & lubricant additive, and anti-adhesive agent in various end-use industries such as food packaging, personal care, and plastic & rubber. The high compatibility of erucamide in different end-use industries with different applications will propel the market for erucamide fatty amides.
The fatty amides market, by function, is segmented into slip agent, lubricant, anti-block agent, release agent, and dispersant. The slip agent segment accounted for the largest market share in 2016. Fatty amides find application as slip agents for plastic films, which are used in food packing. Owing to the rise in disposable income and growth in the middle-class population; the demand for packed food has increased, which is ultimately driving the demand for fatty amides as slip agents in the film processing industry.
In 2016, the Asia Pacific region accounted for the largest share of the global fatty amides market. The Asia Pacific market particularly the developing markets in countries such as China and India is projected to grow at the highest rate from 2017 to 2022. Asia Pacific is a hub for foreign investments and booming manufacturing sectors, largely due to the low-cost labor and cheap availability of land. The increase in demand for fatty amides can be attributed to the rising population of the region with high disposable incomes.
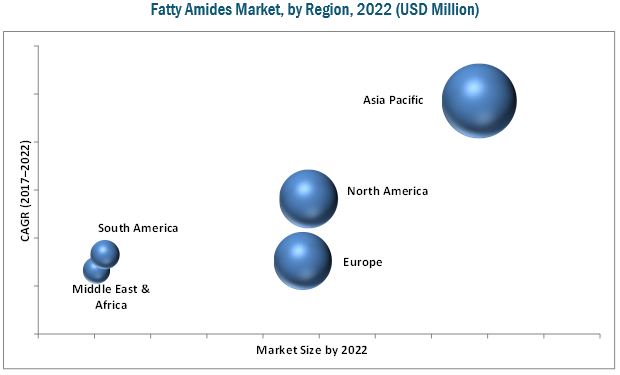
Asia Pacific is projected to be the fastest growing market for fatty amides with India and China being the major country-level markets. The Asia Pacific market is projected to register the highest CAGR during the forecast period; the major driving factors of the market in this region are increasing disposable income and expansion of end-use industries. However, factors such as price volatility of raw material are restraining the growth of the fatty amides market.
The global fatty amides market is dominated by players such Croda International (UK), Kuala Lumpur Kepong Berhad (Malaysia), Italmatch Chemicals (Italy), PMC Biogenix, (US), Kao Corporation (Japan), Fine Organics (India), Nippon Fine Chemical (Japan), Haihang Industry (China), Mitsubishi Chemical (Japan), and BASF (Germany). These players adopted various strategies such as mergers & acquisitions, expansions & investments, and agreements to increase their share in the fatty amides market.
To speak to our analyst for a discussion on the above findings, click Speak to Analyst
 Exclusive indicates content/data unique to MarketsandMarkets and not available with any competitors.
Table of Contents
1 Introduction (Page No. - 19)
1.1 Objectives of the Study
1.2 Market Definition
1.3 Market Scope
1.3.1 Years Considered
1.4 Currency
1.5 Unit Considered
1.6 Stakeholders
2 Research Methodology (Page No. - 23)
2.1 Research Data
2.1.1 Secondary Data
2.1.1.1 Key Data From Secondary Sources
2.1.2 Primary Data
2.1.2.1 Key Data From Primary Sources
2.1.2.2 Key Industry Insights
2.2 Market Size Estimation
2.2.1 Bottom Up Approach
2.2.2 Top Down Approach
2.3 Market Share Estimation
2.4 Data Triangulation
2.5 Research Assumptions & Limitations
2.5.1 Research Assumptions
2.5.2 Limitations
3 Executive Summary (Page No. - 31)
4 Premium Insights (Page No. - 35)
4.1 Attractive Opportunities in the Fatty Amides Market
4.2 Fatty Amides Market, By Type
4.3 Fatty Amides Market, By Product Form
4.4 Fatty Amides Market, By Function
4.5 Fatty Amides Market, By End-Use Industry
4.6 Asia Pacific: Fatty Amides Market, By End-Use Industry and Key Country
4.7 Fatty Amides Market: Geographic Snapshot
5 Market Overview (Page No. - 40)
5.1 Introdcution
5.2 Market Dynamics
5.2.1 Drivers
5.2.1.1 Growing Demand for Environment-Friendly Products
5.2.1.2 Consumer-Driven Demand
5.2.2 Restraints
5.2.2.1 Fluctuating Prices of Raw Materials
5.2.3 Opportunities
5.2.3.1 Increasing Penetration in Key End-Use Industries
5.2.3.2 Preferences of Bio-Based Raw Materials Over Petrochemicals
5.2.4 Challenges
5.2.4.1 Easy Availability of Raw Materials in Developing Regions Leading to Over Capacity
6 Fatty Amides Market, By Type (Page No. - 43)
6.1 Introduction
6.2 Erucamide
6.3 Oleamide
6.4 Stearamide
6.5 Behenamide
6.6 Others
7 Fatty Amides Market, By Product Form (Page No. - 47)
7.1 Introduction
7.2 Bead
7.3 Powder
7.4 Others
8 Fatty Amides Market, By Function (Page No. - 50)
8.1 Introduction
8.2 Lubricants
8.3 Anti-Block Agents
8.4 Release Agents
8.5 Slip Agents
8.6 Dispersants
8.7 Others
9 Fatty Amides Market, By End-Use Industry (Page No. - 54)
9.1 Introduction
9.2 Film Processing
9.3 Ink
9.4 Rubber
9.5 Injection Molding
9.6 Others
10 Fatty Amides Market, By Region (Page No. - 58)
10.1 Introduction
10.2 North America
10.2.1 US
10.2.2 Canada
10.2.3 Mexico
10.3 Europe
10.3.1 UK
10.3.2 Italy
10.3.3 Germany
10.3.4 Russia
10.3.5 Spain
10.3.6 France
10.3.7 Rest of Europe
10.4 Asia Pacific
10.4.1 China
10.4.2 India
10.4.3 Japan
10.4.4 Malaysia
10.4.5 Indonesia
10.4.6 Rest of Asia Pacific
10.5 South America
10.5.1 Brazil
10.5.2 Argentina
10.5.3 Rest of South America
10.6 Middle East & Africa
10.6.1 Saudi Arabia
10.6.2 South Africa
10.6.3 Turkey
10.6.4 Rest of Middle East & Africa
11 Competitive Landscape (Page No. - 165)
11.1 Overview
11.1.1 Competitive Scenario
11.1.1.1 Expansions and Investments
11.1.1.2 Mergers & Acquisitions
11.1.1.3 Agreements/Joint Ventures
11.2 Market Ranking of Key Players
11.2.1 Croda International
11.2.2 KAO Corporation
11.2.3 PMC Biogenix
11.2.4 Kuala Lumpur Kepong Berhad
11.2.5 Fine Organics
12 Company Profiles (Page No. - 170)
(Business Overview, Products Offered, Recent Developments, SWOT Analysis, MnM View)*
12.1 Croda International
12.2 Kuala Lumpur Kepong Berhad (KLK)
12.3 Italmatch Chemicals
12.4 PMC Biogenix
12.5 KAO Corporation
12.6 Fine Organic Industries
12.7 Nippon Fine Chemical
12.8 Haihang Industry
12.9 Mitsubishi Chemical
12.10 BASF
12.11 Additional Companies
*Details on Business Overview, Products Offered, Recent Developments, SWOT Analysis, MnM View Might Not Be Captured in Case of Unlisted Companies.
13 Appendix (Page No. - 193)
13.1 Discussion Guide
13.2 Knowledge Store: Marketsandmarkets� Subscription Portal
13.3 Introducing RT: Real-Time Market Intelligence
13.4 Available Customizations
13.5 Related Reports
13.6 Author Details
List of Tables (248 Tables)
Table 1 Fatty Amides Market Size, By Type, 2015�2022 (USD Million)
Table 2 Market Size, By Type, 2015�2022 (KT)
Table 3 Market Size, By Product Form, 2015�2022 (USD Million)
Table 4 Market Size, By Product Form, 2015�2022 (KT)
Table 5 Market Size, By Function, 2015�2022 (USD Million)
Table 6 Market Size, By Function, 2015�20212 (KT)
Table 7 Fatty Amides Market, By End-Use Industry, 2015�2022 (USD Million)
Table 8 Fatty Amides Market, By End-Use Industry, 2015�2022 (KT)
Table 9 Fatty Amides Market Size, By Region, 2015�2022 (USD Million)
Table 10 Fatty Amides Market Size, By Region, 2015�2022 (KT)
Table 11 North America: Fatty Amides Market Size, By Country, 2015�2022 (USD Million)
Table 12 North America: Market Size, By Country, 2015�2022 (KT)
Table 13 North America: Market Size, By Type, 2015�2022 (USD Million)
Table 14 North America: Market Size, By Type, 2015�2022 (KT)
Table 15 North America: Market Size, By Product Form, 2015�2022 (USD Million)
Table 16 North America: Market Size, By Type, 2015�2022 (KT)
Table 17 North America: Market Size, By Function, 2015�2022 (USD Million)
Table 18 North America: Market Size, By Function, 2015�2022 (KT)
Table 19 North America: Market Size, By End-Use Industry, 2015�2022 (USD Million)
Table 20 North America: Market Size, By End-Use Industry, 2015�2022 (KT)
Table 21 US: Fatty Amides Market Size, By Type, 2015�2022 (USD Million)
Table 22 US: Market Size, By Type, 2015�2022 (KT)
Table 23 US: Market Size, By Product Form, 2015�2022 (USD Million)
Table 24 US: Market Size, By Product Form, 2015�2022 (KT)
Table 25 US: Market Size, By Function, 2015�2022 (USD Million)
Table 26 US: Market Size, By Function, 2015�2022 (KT)
Table 27 US: Market Size, By End-Use Industry, 2015�2022 (USD Million)
Table 28 US: Market Size, By End-Use Industry, 2015�2022 (KT)
Table 29 Canada: Fatty Amides Market Size, By Type, 2015�2022 (USD Million)
Table 30 Canada: Market Size, By Type, 2015�2022 (KT)
Table 31 Canada: Market Size, By Product Form, 2015�2022 (USD Million)
Table 32 Canada: Market Size, By Product Form, 2015�2022 (KT)
Table 33 Canada: Market Size, By Function, 2015�2022 (USD Million)
Table 34 Canada: Market Size, By Function, 2015�2022 (KT)
Table 35 Canada: Market Size, By End-Use Industry, 2015�2022 (USD Million)
Table 36 Canada: Market Size, By End-Use Industry, 2015�2022 (KT)
Table 37 Mexico: Fatty Amides Market Size, By Type, 2015�2022 (USD Million)
Table 38 Mexico: Market Size, By Type, 2015�2022 (KT)
Table 39 Mexico: Market Size, By Product Form, 2015�2022 (USD Million)
Table 40 Mexico: Market Size, By Product Form, 2015�2022 (KT)
Table 41 Mexico: Market Size, By Function, 2015�2022 (USD Million)
Table 42 Mexico: Market Size, By Function, 2015�2022 (KT)
Table 43 Mexico: Market Size, By End-Use Industry, 2015�2022 (USD Million)
Table 44 Mexico: Market Size, By End-Use Industry, 2015�2022 (KT)
Table 45 Europe: Fatty Amides Market Size, By Country, 2015�2022 (USD Million)
Table 46 Europe: Market Size, By Country, 2015�2022 (KT)
Table 47 Europe: Market Size, By Type, 2015�2022 (USD Million)
Table 48 Europe: Market Size, By Type, 2015�2022 (KT)
Table 49 Europe: Market Size, By Product Form, 2015�2022 (USD Million)
Table 50 Europe: Market Size, By Product Form, 2015�2022 (KT)
Table 51 Europe: Market Size, By Function, 2015�2022 (USD Million)
Table 52 Europe: Market Size, By Function, 2015�2022 (KT)
Table 53 Europe: Market Size, By End-Use Industry, 2015�2022 (USD Million)
Table 54 Europe: Market Size, By End-Use Industry, 2015�2022 (KT)
Table 55 UK: Fatty Amides Market Size, By Type, 2015�2022 (USD Million)
Table 56 UK: Market Size, By Type, 2015�2022 (KT)
Table 57 UK: Market Size, By Product Form, 2015�2022 (USD Million)
Table 58 UK: Market Size, By Product Form, 2015�2022 (KT)
Table 59 UK: Market Size, By Function, 2015�2022 (USD Million)
Table 60 UK: Market Size, By Function, 2015�2022 (KT)
Table 61 UK: Market Size, By End-Use Industry, 2015�2022 (USD Million)
Table 62 UK: Market Size, By End-Use Industry, 2015�2022 (KT)
Table 63 Italy: Fatty Amides Market Size, By Type, 2015�2022 (USD Million)
Table 64 Italy: Market Size, By Type, 2015�2022 (KT)
Table 65 Italy: Market Size, By Product Form, 2015�2022 (USD Million)
Table 66 Italy: Market Size, By Product Form, 2015�2022 (KT)
Table 67 Italy: Market Size, By Function, 2015�2022 (USD Million)
Table 68 Italy: Market Size, By Function, 2015�2022 (KT)
Table 69 Italy: Market Size, By End-Use Industry, 2015�2022 (USD Million)
Table 70 Italy: Market Size, By End-Use Industry, 2015�2022 (KT)
Table 71 Germany: Fatty Amides Market Size, By Type, 2015�2022 (USD Million)
Table 72 Germany: Market Size, By Type, 2015�2022 (KT)
Table 73 Germany: Market Size, By Product Form, 2015�2022 (USD Million)
Table 74 Germany: Market Size, By Product Form, 2015�2022 (KT)
Table 75 Germany: Market Size, By Function, 2015�2022 (USD Million)
Table 76 Germany: Market Size, By Function, 2015�2022 (KT)
Table 77 Germany: Market Size, By End-Use Industry, 2015�2022 (USD Million)
Table 78 Germany: Market Size, By End-Use Industry, 2015�2022 (KT)
Table 79 Russia: Fatty Amides Market Size, By Type, 2015�2022 (USD Million)
Table 80 Russia: Market Size, By Type, 2015�2022 (KT)
Table 81 Russia: Market Size, By Product Form, 2015�2022 (USD Million)
Table 82 Russia: Market Size, By Product Form, 2015�2022 (KT)
Table 83 Russia: Market Size, By Function, 2015�2022 (USD Million)
Table 84 Russia: Market Size, By Function, 2015�2022 (KT)
Table 85 Russia: Market Size, By End-Use Industry, 2015�2022 (USD Million)
Table 86 Russia: Market Size, By End-Use Industry, 2015�2022 (KT)
Table 87 Spain: Fatty Amides Market Size, By Type, 2015�2022 (USD Million)
Table 88 Spain: Market Size, By Type, 2015�2022 (KT)
Table 89 Spain: Market Size, By Product Form, 2015�2022 (USD Million)
Table 90 Spain: Market Size, By Product Form, 2015�2022 (KT)
Table 91 Spain: Market Size, By Function, 2015�2022 (USD Million)
Table 92 Spain: Market Size, By Function, 2015�2022 (KT)
Table 93 Spain: Market Size, By End-Use Industry, 2015�2022 (USD Million)
Table 94 Spain: Market Size, By End-Use Industry, 2015�2022 (KT)
Table 95 France: Fatty Amides Market Size, By Type, 2015�2022 (USD Million)
Table 96 France: Market Size, By Type, 2015�2022 (KT)
Table 97 France: Market Size, By Product Form, 2015�2022 (USD Million)
Table 98 France: Market Size, By Product Form, 2015�2022 (KT)
Table 99 France: Market Size, By Function, 2015�2022 (USD Million)
Table 100 France: Market Size, By Function, 2015�2022 (KT)
Table 101 France: Market Size, By End-Use Industry, 2015�2022 (USD Million)
Table 102 France: Market Size, By End-Use Industry, 2015�2022 (KT)
Table 103 Rest of Europe: Fatty Amides Market Size, By Type, 2015�2022 (USD Million)
Table 104 Rest of Europe: Market Size, By Type, 2015�2022 (KT)
Table 105 Rest of Europe: Market Size, By Product Form, 2015�2022 (USD Million)
Table 106 Rest of Europe: Market Size, By Product Form, 2015�2022 (KT)
Table 107 Rest of Europe: Market Size, By Function, 2015�2022 (USD Million)
Table 108 Rest of Europe: Market Size, By Function, 2015�2022 (KT)
Table 109 Rest of Europe: Market Size, By End-Use Industry, 2015�2022 (USD Million)
Table 110 Rest of Europe: Market Size, By End-Use Industry, 2015�2022 (KT)
Table 111 Asia Pacific: Fatty Amides Market Size, By Country, 2015�2022 (USD Million)
Table 112 Asia Pacific: Market Size, By Country, 2015�2022 (KT)
Table 113 Asia Pacific: Market Size, By Type, 2015�2022 (USD Million)
Table 114 Asia Pacific: Market Size, By Type, 2015�2022 (KT)
Table 115 Asia Pacific: Market Size, By Product Form, 2015�2022 (USD Million)
Table 116 Asia Pacific: Market Size, By Product Form, 2015�2022 (KT)
Table 117 Asia Pacific: Market Size, By Function, 2015�2022 (USD Million)
Table 118 Asia Pacific: Market Size, By Function, 2015�2022 (KT)
Table 119 Asia Pacific: Market Size, By End-Use Industry, 2015�2022 (USD Million)
Table 120 Asia Pacific: Market Size, By End-Use Industry, 2015�2022 (KT)
Table 121 China: Fatty Amides Market Size, By Type, 2015�2022 (USD Million)
Table 122 China: Market Size, By Type, 2015�2022 (KT)
Table 123 China: Market Size, By Product Form, 2015�2022 (USD Million)
Table 124 China: Market Size, By Product Form, 2015�2022 (KT)
Table 125 China: Market Size, By Function, 2015�2022 (USD Million)
Table 126 China: Market Size, By Function, 2015�2022 (KT)
Table 127 China: Market Size, By End-Use Industry, 2015�2022 (USD Million)
Table 128 China: Market Size, By End-Use Industry, 2015�2022 (KT)
Table 129 India: Fatty Amides Market Size, By Type, 2015�2022 (USD Million)
Table 130 India: Market Size, By Type, 2015�2022 (KT)
Table 131 India: Market Size, By Product Form, 2015�2022 (USD Million)
Table 132 India: Market Size, By Product Form, 2015�2022 (KT)
Table 133 India: Market Size, By Function, 2015�2022 (USD Million)
Table 134 India: Market Size, By Function, 2015�2022 (KT)
Table 135 India: Market Size, By End-Use Industry, 2015�2022 (USD Million)
Table 136 India: Market Size, By End-Use Industry, 2015�2022 (KT)
Table 137 Japan: Fatty Amides Market Size, By Type, 2015�2022 (USD Million)
Table 138 Japan: Market Size, By Type, 2015�2022 (KT)
Table 139 Japan: Market Size, By Product Form, 2015�2022 (USD Million)
Table 140 Japan: Market Size, By Product Form, 2015�2022 (KT)
Table 141 Japan: Market Size, By Function, 2015�2022 (USD Million)
Table 142 Japan: Market Size, By Function, 2015�2022 (KT)
Table 143 Japan: Market Size, By End-Use Industry, 2015�2022 (USD Million)
Table 144 Japan: Market Size, By End-Use Industry, 2015�2022 (KT)
Table 145 Malaysia: Fatty Amides Market Size, By Type, 2015�2022 (USD Million)
Table 146 Malaysia: Market Size, By Type, 2015�2022 (KT)
Table 147 Malaysia: Market Size, By Product Form, 2015�2022 (USD Million)
Table 148 Malaysia: Market Size, By Product Form, 2015�2022 (KT)
Table 149 Malaysia: Market Size, By Function, 2015�2022 (USD Million)
Table 150 Malaysia: Market Size, By Function, 2015�2022 (KT)
Table 151 Malaysia: Market Size, By End-Use Industry, 2015�2022 (USD Million)
Table 152 Malaysia: Market Size, By End-Use Industry, 2015�2022 (KT)
Table 153 Indonesia: Fatty Amides Market Size, By Type, 2015�2022 (USD Million)
Table 154 Indonesia: Market Size, By Type, 2015�2022 (KT)
Table 155 Indonesia: Market Size, By Product Form, 2015�2022 (USD Million)
Table 156 Indonesia: Market Size, By Product Form, 2015�2022 (KT)
Table 157 Indonesia: Market Size, By Function, 2015�2022 (USD Million)
Table 158 Indonesia: Market Size, By Function, 2015�2022 (KT)
Table 159 Indonesia: Market Size, By End-Use Industry, 2015�2022 (USD Million)
Table 160 Indonesia: Market Size, By End-Use Industry, 2015�2022 (KT)
Table 161 Rest of Asia Pacific: Fatty Amides Market Size, By Type, 2015�2022 (USD Million)
Table 162 Rest of Asia Pacific: Market Size, By Type, 2015�2022 (KT)
Table 163 Rest of Asia Pacific: Market Size, By Product Form, 2015�2022 (USD Million)
Table 164 Rest of Asia Pacific: Market Size, By Product Form, 2015�2022 (KT)
Table 165 Rest of Asia Pacific: Market Size, By Function, 2015�2022 (USD Million)
Table 166 Rest of Asia Pacific: Market Size, By Function, 2015�2022 (KT)
Table 167 Rest of Asia Pacific: Market Size, By End-Use Industry, 2015�2022 (USD Million)
Table 168 Rest of Asia Pacific: Market Size, By End-Use Industry, 2015�2022 (KT)
Table 169 South America: Fatty Amides Market Size, By Country, 2015�2022 (USD Million)
Table 170 South America: Market Size, By Country, 2015�2022 (KT)
Table 171 South America: Market Size, By Type, 2015�2022 (USD Million)
Table 172 South America: Market Size, By Type, 2015�2022 (KT)
Table 173 South America: Market Size, By Product Form, 2015�2022 (USD Million)
Table 174 South America: Market Size, By Product Form, 2015�2022 (KT)
Table 175 South America: Market Size, By Function, 2015�2022 (USD Million)
Table 176 South America: Market Size, By Function, 2015�2022 (KT)
Table 177 South America: Market Size, By End-Use Industry, 2015�2022 (USD Million)
Table 178 South America: Market Size, By End-Use Industry, 2015�2022 (KT)
Table 179 Brazil: Fatty Amides Market Size, By Type, 2015�2022 (USD Million)
Table 180 Brazil: Market Size, By Type, 2015�2022 (KT)
Table 181 Brazil: Market Size, By Product Form, 2015�2022 (USD Million)
Table 182 Brazil: Market Size, By Product Form, 2015�2022 (KT)
Table 183 Brazil: Market Size, By Function, 2015�2022 (USD Million)
Table 184 Brazil: Market Size, By Function, 2015�2022 (KT)
Table 185 Brazil: Market Size, By End-Use Industry, 2015�2022 (USD Million)
Table 186 Brazil: Market Size, By End-Use Industry, 2015�2022 (KT)
Table 187 Argentina: Fatty Amides Market Size, By Type, 2015�2022 (USD Million)
Table 188 Argentina: Market Size, By Type, 2015�2022 (KT)
Table 189 Argentina: Market Size, By Product Form, 2015�2022 (USD Million)
Table 190 Argentina: Market Size, By Product Form, 2015�2022 (KT)
Table 191 Argentina: Market Size, By Function, 2015�2022 (USD Million)
Table 192 Argentina: Market Size, By Function, 2015�2022 (KT)
Table 193 Argentina: Market Size, By End-Use Industry, 2015�2022 (USD Million)
Table 194 Argentina: Market Size, By End-Use Industry, 2015�2022 (KT)
Table 195 Rest of South America: Fatty Amides Market Size, By Type, 2015�2022 (USD Million)
Table 196 Rest of South America: Market Size, By Type, 2015�2022 (KT)
Table 197 Rest of South America: Market Size, By Product Form, 2015�2022 (USD Million)
Table 198 Rest of South America: Market Size, By Product Form, 2015�2022 (KT)
Table 199 Rest of South America: Market Size, By Function, 2015�2022 (USD Million)
Table 200 Rest of South America: Market Size, By Function, 2015�2022 (KT)
Table 201 Rest of South America: Market Size, By End-Use Industry, 2015�2022 (USD Million)
Table 202 Rest of South America: Market Size, By End-Use Industry, 2015�2022 (KT)
Table 203 Middle East & Africa: Fatty Amides Market Size, By Country, 2015�2022 (USD Million)
Table 204 Middle East & Africa: Market Size, By Country, 2015�2022 (KT)
Table 205 Middle East & Africa: Market Size, By Type, 2015�2022 (USD Million)
Table 206 Middle East & Africa: Market Size, By Type, 2015�2022 (KT)
Table 207 Middle East & Africa: Market Size, By Product Form, 2015�2022 (USD Million)
Table 208 Middle East & Africa: Market Size, By Product Form, 2015�2022 (KT)
Table 209 Middle East & Africa: Market Size, By Function, 2015�2022 (USD Million)
Table 210 Middle East & Africa: Market Size, By Function, 2015�2022 (KT)
Table 211 Middle East & Africa: Market Size, By End-Use Industry, 2015�2022 (USD Million)
Table 212 Middle East & Africa: Market Size, By End-Use Industry, 2015�2022 (KT)
Table 213 Saudi Arabia: Fatty Amides Market Size, By Type, 2015�2022 (USD Million)
Table 214 Saudi Arabia: Market Size, By Type, 2015�2022 (KT)
Table 215 Saudi Arabia: Market Size, By Product Form, 2015�2022 (USD Million)
Table 216 Saudi Arabia: Market Size, By Product Form, 2015�2022 (KT)
Table 217 Saudi Arabia: Market Size, By Function, 2015�2022 (USD Million)
Table 218 Saudi Arabia: Market Size, By Function, 2015�2022 (KT)
Table 219 Saudi Arabia: Market Size, By End-Use Industry, 2015�2022 (USD Million)
Table 220 Saudi Arabia: Market Size, By End-Use Industry, 2015�2022 (KT)
Table 221 South Africa: Fatty Amides Market Size, By Type, 2015�2022 (USD Million)
Table 222 South Africa: Market Size, By Type, 2015�2022 (KT)
Table 223 South Africa: Market Size, By Product Form, 2015�2022 (USD Million)
Table 224 South Africa: Market Size, By Product Form, 2015�2022 (KT)
Table 225 South Africa: Market Size, By Function, 2015�2022 (USD Million)
Table 226 South Africa: Market Size, By Function, 2015�2022 (KT)
Table 227 South Africa: Market Size, By End-Use Industry, 2015�2022 (USD Million)
Table 228 South Africa: Market Size, By End-Use Industry, 2015�2022 (KT)
Table 229 Turkey: Fatty Amides Market Size, By Type, 2015�2022 (USD Million)
Table 230 Turkey: Market Size, By Type, 2015�2022 (KT)
Table 231 Turkey: Market Size, By Product Form, 2015�2022 (USD Million)
Table 232 Turkey: Market Size, By Product Form, 2015�2022 (KT)
Table 233 Turkey: Market Size, By Function, 2015�2022 (USD Million)
Table 234 Turkey: Market Size, By Function, 2015�2022 (KT)
Table 235 Turkey: Market Size, By End-Use Industry, 2015�2022 (USD Million)
Table 236 Turkey: Market Size, By End-Use Industry, 2015�2022 (KT)
Table 237 Rest of Middle East & Africa: Fatty Amides Market Size, By Type, 2015�2022 (USD Million)
Table 238 Rest of Middle East & Africa: Market Size, By Type, 2015�2022 (KT)
Table 239 Rest of Middle East & Africa: Market Size, By Product Form, 2015�2022 (USD Million)
Table 240 Rest of Middle East & Africa: Market Size, By Product Form, 2015�2022 (KT)
Table 241 Rest of Middle East & Africa: Market Size, By Function, 2015�2022 (USD Million)
Table 242 Rest of Middle East & Africa: Market Size, By Function, 2015�2022 (KT)
Table 243 Rest of Middle East & Africa: Market Size, By End-Use Industry, 2015�2022 (USD Million)
Table 244 Rest of Middle East & Africa: Market Size, By End-Use Industry, 2015�2022 (KT)
Table 245 Expansions & Investments
Table 246 Mergers & Acquisitions
Table 247 Agreements/Joint Ventures
Table 248 Market Ranking
List of Figures (28 Figures)
Figure 1 Fatty Amides Market: Research Design
Figure 2 Market Size Estimation Methodology: Bottom-Up Approach
Figure 3 Market Size Estimation Methodology: Top-Down Approach
Figure 4 Fatty Amides Market: Data Triangulation
Figure 5 Erucamide Fatty Amide to Grow at the Highest CAGR
Figure 6 Bead Segment to Grow at the Highest Rate By 2022
Figure 7 Slip Agents Segment to Account for the Largest Share By 2022
Figure 8 Film Processing Industry to Grow at the Highest Rate Through 2022
Figure 9 Asia Pacific Dominated the Fatty Amides Market in 2016
Figure 10 Fatty Amides Market to Record Robust Growth Between 2017 and 2022
Figure 11 Erucamide Segment to Record the Highest Growth By 2022
Figure 12 Bead Segment to Lead the Market Through 2022
Figure 13 Slip Agent Segment to Account for the Largest Market Size By 2022
Figure 14 Film Processing Segment Estimated to Lead the Market for Fatty Amides in 2017
Figure 15 Film Processing Industry Captured the Largest Share in Asia Pacific in 2016, By Volume
Figure 16 Market in China to Grow at the Highest Rate From 2017 to 2022
Figure 17 Drivers, Restraints, Opportunities, and Challenges of the Fatty Amides Market
Figure 18 Erucamide Segment is Projected to Dominate the Market Through 2022
Figure 19 Bead Form is Projected to Record the Largest Demand By 2022
Figure 20 As Slip Agents, Fatty Amides are Projected to Record the Largest Demand Through 2022
Figure 21 Film Processing is Projected to Dominate the Market Through 2022
Figure 22 Markets in China & India to Register High CAGRs, 2017�2022
Figure 23 Asia Pacific Fatty Amides Market Snapshot: China is Projected to Be the Fastest-Growing Market Between 2017 & 2022
Figure 24 Croda International: Company Snapshot
Figure 25 Kuala Lumpur Kepong Berhad : Company Snapshot
Figure 26 KAO Corporation: Company Snapshot
Figure 27 Mitsubishi Chemical: Company Snapshot
Figure 28 BASF: Company Snapshot


Growth opportunities and latent adjacency in Fatty Amides Market