Slip Additives Market by Type (Fatty Amides (Erucamide, Oleamide, Stearamide), Waxes & Polysiloxanes), Carrier Resin (LDPE, LLDPE, HDPE, PP), Application (Packaging, and Non-Packaging), and Region - Global Forecast to 2024


Slip Additives Market
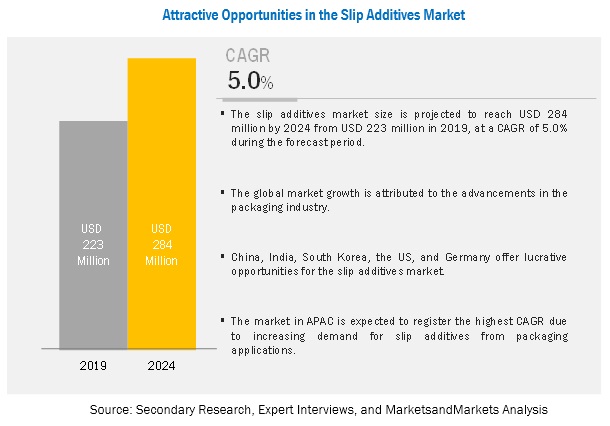
The global slip additives market was valued at USD 223 million in 2019 and is projected to reach USD 284 million by 2024, growing at 5.0% cagr during the forecast period. The growth in the overall packaging industry has resulted in the rise in the use of plastic resins across the globe, thereby widening the scope of the slip additives market. In addition, the increasing demand for slip additives from emerging economies, such as India and South Korea, is expected to fuel the market across the globe.
Fatty amides is expected to be the fastest-growing type segment during the forecast period.
On the basis of type, the slip additives market has been segmented into fatty amides (erucamide, stearamide, oleamide, and others), waxes & polysiloxanes, and others. The fatty amides segment is projected to register the highest CAGR, in terms of value, of the global slip additives market. The growth of this segment can be attributed to the outstanding performance and reduction in friction provided by fatty amides-based slip additives. Moreover, these additives are available at low cost than waxes and silicone-based slip additives.
The packaging segment is expected to dominate the slip additives during the forecast period.
The packaging segment is projected to dominate the slip additives market during the forecast period. The growth is attributed to the increasing demand from food & beverage packaging. The use of plastic packaging reduces leakage and extends the shelf life of the product. Plastic has a high demand for packaging food products due to its convenience and portability. The primary functions of food & beverage packaging are to reduce food loss and increase the shelf life of food products. One of the major transformations in the food & beverage industry is the reduction in the amount of packaging, mostly non-recyclable, to reduce packaging waste without compromising on the safety and hygiene of the food products. This results in the increasing demand for polyolefin plastic packaging films. Slip additives are widely used during the manufacturing of thin films and sheets in order to prevent friction and get the desired properties in packaging material.
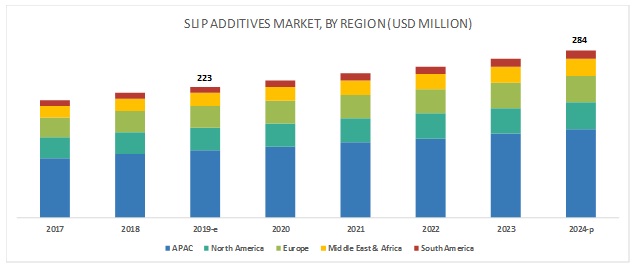
APAC is expected to account for the largest share of the slip additives market during the forecast period.
APAC is expected to account for the largest share, in terms of value, of the slip additives market during the forecast period. Rapid industrialization in emerging economies, such as China and India, is expected to fuel the slip additives market in the region. The rising disposable income, changing lifestyle, growing middle-class population, and the increasing consumption of packed goods are expected to drive the packaging industry, which, in turn, is likely to support the growth of the slip additives market. The demand for ready-to-eat food, convenience food, and processed & semi-processed food is growing in China. Consumers are preferring quality and trustworthy products, which is increasing the demand for imported food & beverage products. This has increased pressure on domestic food & beverage manufacturers to produce high-quality products that come in safe and easy packaging. These factors are expected to drive the slip additives market in the region.
Key Market Players
The key market players profiled in the report include Fine Organics (India), Croda International Inc. (UK), PMC Biogenix Inc. (US), Honeywell International Inc. (US), Lubrizol Corporation (US), BASF SE (Germany), Emery Oleochemicals (Malaysia), BYK Additives (Germany), Lonza Group (Switzerland), and Evonik Industries AG (Germany).
Fine Organics (India) has a strong presence in India and has manufacturing facilities in Mumbai (India) and joint ventures in Malaysia (since 1988) and Thailand (since 1994). The company is focusing on expanding its global presence to strengthen its leadership in the market. The company is also increasing its global foothold to achieve a strong customer base in emerging as well as developed markets. It has a presence in the APAC region, which is the largest oleochemicals-based slip additives market. The company is taking initiatives in terms of innovation and development of new technologies in the field of additives to maintain a competitive edge in the market. Through its high-quality and cost-effective slip additives product range, the company has become a significant player in the market.
Scope of the Report
|
Report Metric |
Details |
|
Years considered for the study |
2017–2024 |
|
Base year considered |
2018 |
|
Forecast period |
2019–2027 |
|
Units considered |
Value (USD Million) and Volume (Tons) |
|
Segments covered |
Type, application, carrier resin, and region |
|
Regions covered |
APAC, North America, Europe, Middle East & Africa, and South America |
| Companies profiled |
GE Healthcare (US), Merck KGaA (US), Bio-Rad Laboratories (US), and Thermo Fisher Scientific Inc. (US), Tosoh Corporation (Japan), Mitsubishi Chemical Corporation (Japan), Pall Corporation (US), Purolite Corporation (US), Repligen Corporation (US), and Avantor Performance Materials Inc. (US) |
This report categorizes the global slip additives market based on type, application, carrier resin, and region.
On the basis of type, the slip additives market has been segmented as follows:
-
Fatty Amides
- Erucamide
- Oleamide
- Stearamide
- Others (behenamide and secondary amides)
- Waxes & Polysiloxanes
- Others (esters and salts)
On the basis of carrier resin, the slip additives market has been segmented as follows:
-
PE
- LDPE
- LLDPE
- HDPE
- PP
- Others (PET, EVA, polystyrene, and acrylics)
On the basis of application, the slip additives market has been segmented as follows:
-
Packaging
- Food & Beverage
- Consumer Durables
- Healthcare
- Others (industrial and agriculture)
- Non-Packaging
On the basis of region, the slip additives market has been segmented as follows:
- APAC
- North America
- Europe
- Middle East & Arica
- South America
Recent Developments
- In October 2018, ChemPoint.com (US), a wholly-owned subsidiary of Univar (US), expanded its relationship with PMC Biogenix to enable distribution in Mexico. ChemPoint will offer additives, including Kemamide, Armoslip, Hystrene, and Industrene. The expansion has helped the company cater to its customers in Mexico.
- In February 2017, PMC Biogenix significantly expanded its production capacity of long-chain fatty acid intermediates in Memphis, TN, to support its recent expansion in fatty amide slip agent production. This expansion will help the company increase its capacity for Erucic and Behenic acids by approximately 50%, double its output for C-20 fatty acids, and upgrade PMC’s production capabilities to the most current technologies.
- In February 2017, Croda International invested in an expansion project at its Hull manufacturing site in Yorkshire (UK). The expansion is in line with the company’s long-term capital investment plan, which will enable the company to meet the growing demand for slip additives in polymers by 2020.
- In April 2016, Fine Organics commissioned a new polymer additives manufacturing site in Maharashtra, India. This new manufacturing facility helped the company to supply polymer additives, including slip additives, to its growing customer base in India and abroad.
Key Questions addressed by the report
- What are the major developments impacting the market?
- Where will all the developments take the industry in the mid-to-long term?
- What are the upcoming types of slip additives?
- What are the emerging applications of slip additives?
- What are the major factors impacting market growth during the forecast period?
To speak to our analyst for a discussion on the above findings, click Speak to Analyst
 Exclusive indicates content/data unique to MarketsandMarkets and not available with any competitors.
Table of Contents
1 Introduction (Page No. - 17)
1.1 Objectives of the Study
1.2 Market Definition
1.3 Market Scope
1.3.1 Market Segmentation
1.3.2 Regions Covered
1.3.3 Years Considered for the Study
1.4 Currency
1.5 Unit Considered
1.6 Limitations
1.7 Stakeholders
2 Research Methodology (Page No. - 21)
2.1 Base Number Calculation
2.1.1 Supply-Side Approach
2.1.2 Demand-Side Approach
2.2 Forecast Number Calculation
2.3 Primary Data
2.3.1 Key Industry Insights
2.3.2 Breakdown of Primary Interviews
2.4 Secondary Data
2.5 Market Estimation Process
2.5.1 Bottom-Up Approach
2.5.2 Top-Down Approach
2.6 Assumptions
3 Executive Summary (Page No. - 28)
4 Premium Insights (Page No. - 31)
4.1 Attractive Opportunities in the Slip Additives Market
4.2 Slip Additives Market, By Region
4.3 Slip Additives Market in APAC, By Application and Country, 2018
4.4 Slip Additives Market, By Type
4.5 Slip Additives Market, By Country
5 Market Overview (Page No. - 34)
5.1 Introduction
5.2 Market Dynamics
5.2.1 Drivers
5.2.1.1 Advancements in the Packaging Industry
5.2.1.2 Growing Demand From APAC
5.2.2 Restraints
5.2.2.1 Stringent Environmental and Government Regulations on the Use of Plastics
5.2.3 Opportunities
5.2.3.1 Increasing Demand for Plastic Films in Medical Applications
5.2.3.2 Rapid Development of Bio-Based Slip Additives
5.2.4 Challenges
5.2.4.1 Volatility in Raw Material Prices
5.3 Porter’s Five Forces Analysis
5.3.1 Threat of Substitutes
5.3.2 Bargaining Power of Suppliers
5.3.3 Bargaining Power of Buyers
5.3.4 Threat of New Entrants
5.3.5 Intensity of Competitive Rivalry
5.4 Macroeconomic Indicators
5.4.1 GDP Trends and Forecast of Major Economies
5.4.2 Trends and Forecast of Plastics Industry and Its Impact on the Slip Additives Market
6 Slip Additives Market, By Type (Page No. - 42)
6.1 Introduction
6.2 Fatty Amides
6.2.1 Erucamide
6.2.1.1 Erucamide-Based Slip Additives Witnessed High Demand From the Packaging Application
6.2.2 Oleamide
6.2.2.1 APAC to Register A High Demand for Slip Additives Having the Ability to Migrate Rapidly
6.2.3 Stearamide
6.2.3.1 Superior Anti-Blocking Effect Driving the Demand for Stearamide -Based Slip Additives
6.2.4 Others
6.2.4.1 Behenamide
6.2.4.2 Secondary Amides
6.3 Waxes & Polysiloxanes
6.3.1 Montan Wax
6.3.1.1 Montan Wax is Expected to Gain Demand Owing to Its Relatively Lower Price in Comparison to Carnauba Wax
6.3.2 Carnauba Wax
6.3.2.1 Carnauba Wax Finds Wide Application in Coatings, Inks, Adhesives, and Performance Additives
6.4 Others
7 Slip Additives Market, By Carrier Resin (Page No. - 52)
7.1 Introduction
7.2 PE
7.2.1 LDPE
7.2.1.1 Flexibility, Toughness, and Relative Transparency Resulting in High Demand for LDPE Films in Heat-Sealing Applications
7.2.2 LLDPE
7.2.2.1 LLDPE Witnessing High Demand in Polyethylene Films Manufacturing
7.2.3 HDPE
7.2.3.1 HDPE Widely Used in Food & Beverage, Consumer Goods, and Personal Care Packaging Applications
7.3 PP
7.3.1 PP Offers Excellent Low-Temperature Impact Strength, High Heat Deflection Temperature, and Rigidity
7.4 Others
8 Slip Additives Market, By Application (Page No. - 56)
8.1 Introduction
8.2 Packaging
8.2.1 Food & Beverage
8.2.1.1 High Demand for Polyolefin Plastic Packaging Films in the Food & Beverage Industry to Drive the Slip Additives Market
8.2.2 Consumer Goods
8.2.2.1 Increasing Need for Ease in the Processing of Plastic Films During Packaging to Drive the Demand for Slip Additives
8.2.3 Healthcare
8.2.3.1 Slip Additives Provide Better Seal Strength to Plastic Packaging Materials
8.2.4 Others
8.3 Non-Packaging
8.3.1 Better Processing Due to the Non-Sticking Property Driving the Demand for Slip Additives in the Segment
9 Slip Additives Market, By Region (Page No. - 65)
9.1 Introduction
9.2 North America
9.2.1 US
9.2.1.1 The Presence of A Large Food Packaging Market is Increasing the Demand for Slip Additives
9.2.2 Canada
9.2.2.1 The Growing Preference for Packaged Food Products and Research for Innovative Packaging Solutions are the Major Market Drivers
9.2.3 Mexico
9.2.3.1 The Country’s Established Food Processing Industry Proves to Be Advantageous for the Slip Additives Market
9.3 Europe
9.3.1 Germany
9.3.1.1 Germany is the Largest Food and Beverage Producer in the Eu
9.3.2 Russia
9.3.2.1 Increasing Demand for Ready-To-Eat and Packaged Food is Driving the Market
9.3.3 Italy
9.3.3.1 In Italy, Slip Additives are Widely Used in Plastic Films
9.3.4 France
9.3.4.1 There is an Increasing Awareness About the Benefits of Eco-Friendly Products in the Country, Which is Helpful for the Slip Additives Market
9.3.5 UK
9.3.5.1 Pharmaceutical and Food & Beverage Industries are Expected to Fuel the Market in the Country
9.4 APAC
9.4.1 China
9.4.1.1 The Growing Consumption of Packaged Food is Contributing to the Market Growth
9.4.2 Japan
9.4.2.1 The Ongoing R&D for Downsizing Packaging Material Consumption is A Promising Growth Prospect for the Market
9.4.3 India
9.4.3.1 The Packaging Film Processing Industry is the Key Consumer of Slip Additives in the Country
9.4.4 South Korea
9.4.4.1 South Korea is One of the Major Plastic Packaging Markets in the Region
9.4.5 Indonesia
9.4.5.1 The Country is the World’s Largest Producer, Consumer, and Supplier of Palm Oil
9.4.6 Thailand
9.4.6.1 The Rising Demand From Packaging and Non-Packaging Applications is Expected to Drive the Market
9.5 Middle East & Africa
9.5.1 Turkey
9.5.1.1 The Flexible Packaging Segment is Expected to Influence the Demand for Slip Additives
9.5.2 Iran
9.5.2.1 The Demand for Fatty Amides-Based Slip Additives is Likely to Increase in the Country
9.6 South America
9.6.1 Brazil
9.6.1.1 Brazil is an Emerging Slip Additives Market in South America
9.6.2 Argentina
9.6.2.1 Food & Beverage and Healthcare are the Prime Application Segments Affecting the Market Positively
10 Competitive Landscape (Page No. - 98)
10.1 Overview
10.2 Competitive Leadership Mapping, 2018
10.2.1 Terminology/Nomenclature
10.2.1.1 Visionary Leaders
10.2.1.2 Innovators
10.2.1.3 Dynamic Differentiators
10.2.2 Strength of Product Portfolio, 2018
10.2.3 Business Strategy Excellence, 2018
10.3 Competitive Leadership Mapping (Small and Medium-Sized Enterprises)
10.3.1 Terminology/Nomenclature
10.3.1.1 Progressive Companies
10.3.1.2 Starting Blocks
10.3.1.3 Responsive Companies
10.3.2 Strength of Product Portfolio, 2018
10.3.3 Business Strategy Excellence, 2018
10.4 Market Ranking
10.5 Competitive Scenario
10.5.1 Expansion
10.5.2 Acquisition
11 Company Profiles (Page No. - 109)
(Business Overview, Products Offered, Recent Developments, SWOT Analysis, MnM View)*
11.1 Fine Organics Industries
11.2 Croda International Plc
11.3 PMC Biogenix, Inc.
11.4 Lubrizol Corporation
11.5 BASF SE
11.6 Emery Oleochemicals Group
11.7 Honeywell International Inc.
11.8 Evonik Industries AG
11.9 BYK Additives & Instruments
11.10 Lonza Group
11.11 Other Market Players
11.11.1 Wacker Chemie AG
11.11.2 Abril Industrial Waxes Ltd.
11.11.3 PCC Chemax, Inc.
11.11.4 Arkema SA
11.11.5 Akrochem Corporation
11.11.6 Ferro Corporation
11.11.7 Faci Spa
11.11.8 Michelman, Inc.
11.11.9 Munzing Chemie GmbH
11.11.10 Struktol Company of America, LLC
11.11.11 Palsgaard
11.11.12 Plastics Color Corporation
11.11.13 Italmatch Chemicals S.P.A.
11.11.14 ADD Additives Bv
11.11.15 Silicona GmbH
*Details on Business Overview, Products Offered, Recent Developments, SWOT Analysis, MnM View Might Not Be Captured in Case of Unlisted Companies
12 Appendix (Page No. - 132)
12.1 Discussion Guide
12.2 Knowledge Store: Marketsandmarkets’ Subscription Portal
12.3 Available Customizations
12.4 Related Reports
12.5 Author Details
List of Tables (104 Tables)
Table 1 Trends and Forecast of GDP, 2017–2024 (USD Billion)
Table 2 Plastic Demand, By Country (Kiloton)
Table 3 Slip Additives Market Size, By Type, 2017–2024 (USD Million)
Table 4 Slip Additives Market Size, By Type, 2017–2024 (Ton)
Table 5 Fatty Amides Slip Additives Market Size, By Region, 2017–2024 (USD Million)
Table 6 Fatty Amides Slip Additives Market Size, By Region, 2017–2024 (Ton)
Table 7 Erucamide Slip Additives Market Size, By Region, 2017–2024 (USD Million)
Table 8 Erucamide Slip Additives Market Size, By Region, 2017–2024 (Ton)
Table 9 Oleamide Slip Additives Market Size, By Region, 2017–2024 (USD Million)
Table 10 Oleamide Slip Additives Market Size, By Region, 2017–2024 (Ton)
Table 11 Stearamide Slip Additives Market Size, By Region, 2017–2024 (USD Million)
Table 12 Stearamide Slip Additives Market Size, By Region, 2017–2024 (Ton)
Table 13 Other Fatty Amides Slip Additives Market Size, By Region, 2017–2024 (USD Million)
Table 14 Other Fatty Amides Slip Additives Market Size, By Region, 2017–2024 (Ton)
Table 15 Waxes & Polysiloxanes Slip Additives Market Size, By Region,2017–2024 (USD Million)
Table 16 Waxes & Polysiloxanes Slip Additives Market Size, By Region, 2017–2024 (Ton)
Table 17 Other Slip Additives Market Size, By Region, 2017–2024 (USD Million)
Table 18 Other Slip Additives Market Size, By Region, 2017–2024 (Ton)
Table 19 Slip Additives Market Size, By Carrier Resin, 2017–2024 (USD Million)
Table 20 Slip Additives Market Size, By Carrier Resin, 2017–2024 (Ton)
Table 21 Slip Additives Market Size, By Application, 2017–2024 (USD Million)
Table 22 Slip Additives Market Size, By Application, 2017–2024 (Ton)
Table 23 Slip Additives Market Size in Packaging Application, By Region, 2017–2024 (USD Million)
Table 24 Slip Additives Market Size in Packaging Application, By Region, 2017–2024 (Ton)
Table 25 Slip Additives Market Size in Food & Beverage Application, By Region, 2017–2024 (USD Million)
Table 26 Slip Additives Market Size in Food & Beverage Application, By Region, 2017–2024 (Ton)
Table 27 Slip Additives Market Size in Consumer Goods Application, By Region, 2017–2024 (USD Million)
Table 28 Slip Additives Market Size in Consumer Goods Application, By Region, 2017–2024 (Ton)
Table 29 Slip Additives Market Size in Healthcare Application, By Region, 2017–2024 (USD Million)
Table 30 Slip Additives Market Size in Healthcare Application, By Region, 2017–2024 (Ton)
Table 31 Slip Additives Market Size in Other Packaging Applications, By Region, 2017–2024 (USD Million)
Table 32 Slip Additives Market Size in Other Packaging Applications, By Region, 2017–2024 (Ton)
Table 33 Slip Additives Market Size in Non-Packaging Applications, By Region, 2017–2024 (USD Million)
Table 34 Slip Additives Market Size in Non-Packaging Applications, By Region, 2017–2024 (Ton)
Table 35 Slip Additives Market Size, By Region, 2017–2024 (USD Million)
Table 36 Slip Additives Market Size, By Region, 2017–2024 (Ton)
Table 37 North America: Slip Additives Market Size, By Country, 2017–2024 (USD Million)
Table 38 North America: Slip Additives Market Size, By Country, 2017–2024 (Ton)
Table 39 North America: Slip Additives Market Size, By Type, 2017–2024 (USD Million)
Table 40 North America: Slip Additives Market Size, By Type, 2017–2024 (Ton)
Table 41 North America: Slip Additives Market Size, By Application, 2017–2024 (USD Million)
Table 42 North America: Slip Additives Market Size, By Application, 2017–2024 (Ton)
Table 43 US: Slip Additives Market Size, By Application, 2017–2024 (USD ThoUSand)
Table 44 US: Slip Additives Market Size, By Application, 2017–2024 (Ton)
Table 45 Canada: Slip Additives Market Size, By Application, 2017–2024 (USD Thousand)
Table 46 Canada: Slip Additives Market Size, By Application, 2017–2024 (Ton)
Table 47 Mexico: Slip Additives Market Size, By Application, 2017–2024 (USD Thousand)
Table 48 Mexico: Slip Additives Market Size, By Application, 2017–2024 (Ton)
Table 49 Europe: Slip Additives Market Size, By Country, 2017–2024 (USD Million)
Table 50 Europe: Slip Additives Market Size, By Country, 2017–2024 (Ton)
Table 51 Europe: Slip Additives Market Size, By Type, 2017–2024 (USD Million)
Table 52 Europe: Slip Additives Market Size, By Type, 2017–2024 (Ton)
Table 53 Europe: Slip Additives Market Size, By Application, 2017–2024 (USD Million)
Table 54 Europe: Slip Additives Market Size, By Application, 2017–2024 (Ton)
Table 55 Germany: Slip Additives Market Size, By Application, 2017–2024 (USD Thousand)
Table 56 Germany: Slip Additives Market Size, By Application, 2017–2024 (Ton)
Table 57 Russia: Slip Additives Market Size, By Application, 2017–2024 (USD Thousand)
Table 58 Russia: Slip Additives Market Size, By Application, 2017–2024 (Ton)
Table 59 Italy: Slip Additives Market Size, By Application, 2017–2024 (USD Thousand)
Table 60 Italy: Slip Additives Market Size, By Application, 2017–2024 (Ton)
Table 61 France: Slip Additives Market Size, By Application, 2017–2024 (USD Thousand)
Table 62 France: Slip Additives Market Size, By Application, 2017–2024 (Ton)
Table 63 UK: Slip Additives Market Size, By Application, 2017–2024 (USD Thousand)
Table 64 UK: Slip Additives Market Size, By Application, 2017–2024 (Ton)
Table 65 APAC: Slip Additives Market Size, By Country, 2017–2024 (USD Million)
Table 66 APAC: Slip Additives Market Size, By Country, 2017–2024 (Ton)
Table 67 APAC: Slip Additives Market Size, By Type, 2017–2024 (USD Million)
Table 68 APAC: Slip Additives Market Size, By Type, 2017–2024 (Ton)
Table 69 APAC: Slip Additives Market Size, By Application, 2017–2024 (USD Million)
Table 70 APAC: Slip Additives Market Size, By Application, 2017–2024 (Ton)
Table 71 China: Slip Additives Market Size, By Application, 2017–2024 (USD Thousand)
Table 72 China: Slip Additives Market Size, By Application, 2017–2024 (Ton)
Table 73 Japan: Slip Additives Market Size, By Application, 2017–2024 (USD Thousand)
Table 74 Japan: Slip Additives Market Size, By Application, 2017–2024 (Ton)
Table 75 India: Slip Additives Market Size, By Application, 2017–2024 (USD Thousand)
Table 76 India: Slip Additives Market Size, By Application, 2017–2024 (Ton)
Table 77 South Korea: Slip Additives Market Size, By Application, 2017–2024 (USD Thousand)
Table 78 South Korea: Slip Additives Market Size, By Application, 2017–2024 (Ton)
Table 79 Indonesia: Slip Additives Market Size, By Application, 2017–2024 (USD Thousand)
Table 80 Indonesia: Slip Additives Market Size, By Application, 2017–2024 (Ton)
Table 81 Thailand: Slip Additives Market Size, By Application, 2017–2024 (USD Thousand)
Table 82 Thailand: Slip Additives Market Size, By Application, 2017–2024 (Ton)
Table 83 Middle East & Africa: Slip Additives Market Size, By Country, 2017–2024 (USD Million)
Table 84 Middle East & Africa: Slip Additives Market Size, By Country, 2017–2024 (Ton)
Table 85 Middle East & Africa: Slip Additives Market Size, By Type, 2017–2024 (USD Million)
Table 86 Middle East & Africa: Slip Additives Market Size, By Type, 2017–2024 (Ton)
Table 87 Middle East & Africa: Slip Additives Market Size, By Application, 2017–2024 (USD Million)
Table 88 Middle East & Africa: Slip Additives Market Size, By Application, 2017–2024 (Ton)
Table 89 Turkey: Slip Additives Market Size, By Application, 2017–2024 (USD Thousand)
Table 90 Turkey: Slip Additives Market Size, By Application, 2017–2024 (Ton)
Table 91 Iran: Slip Additives Market Size, By Application, 2017–2024 (USD Thousand)
Table 92 Iran: Slip Additives Market Size, By Application, 2017–2024 (Ton)
Table 93 South America: Slip Additives Market Size, By Country, 2017–2024 (USD Million)
Table 94 South America: Slip Additives Market Size, By Country, 2017–2024 (Ton)
Table 95 South America: Slip Additives Market Size, By Type, 2017–2024 (USD Million)
Table 96 South America: Slip Additives Market Size, By Type, 2017–2024 (Ton)
Table 97 South America: Slip Additives Market Size, By Application, 2017–2024 (USD Million)
Table 98 South America: Slip Additives Market Size, By Application, 2017–2024 (Ton)
Table 99 Brazil: Slip Additives Market Size, By Application, 2017–2024 (USD Thousand)
Table 100 Brazil: Slip Additives Market Size, By Application, 2017–2024 (Ton)
Table 101 Argentina: Slip Additives Market Size, By Application, 2017–2024 (USD Thousand)
Table 102 Argentina: Slip Additives Market Size, By Application, 2017–2024 (Ton)
Table 103 Expansion, 2014–2019
Table 104 Acquisition, 2014–2019
List of Figures (39 Figures)
Figure 1 Slip Additives Market: Bottom-Up Approach
Figure 2 Slip Additives Market: Top-Down Approach
Figure 3 Fatty Amides to Register the Highest Cagr Between 2019 and 2024
Figure 4 LLDPE Was the Largest Carrier Resin in the Slip Additives Market
Figure 5 Packaging to Be the Larger Application During the Forecast Period
Figure 6 APAC to Register the Highest Cagr During the Forecast Period
Figure 7 Rising Demand From the Packaging Application to Drive the Market Between 2019 and 2024
Figure 8 APAC to Account for the Largest Market Share
Figure 9 China and Food & Beverages Segment Accounted for the Largest Market Share
Figure 10 Fatty Amides to Be the Largest Type
Figure 11 India to Be the Fastest-Growing Slip Additives Market
Figure 12 Drivers, Restraints, Challenges, and Opportunities in the Slip Additives Market
Figure 13 Porter’s Five Forces Analysis: Slip Additives Market
Figure 14 Fatty Amides Segment to Register the Highest Cagr During the Forecast Period
Figure 15 Erucamide to Be the Fastest-Growing Segment During the Forecast Period
Figure 16 LLDPE Segment to Register the Highest Cagr During the Forecast Period
Figure 17 Packaging Segment to Register A Higher Cagr During the Forecast Period
Figure 18 Food & Beverage Segment to Be the Fastest-Growing Segment During the Forecast Period
Figure 19 APAC to Be the Fastest-Growing Slip Additives Market
Figure 20 North America: Slip Additives Market Snapshot
Figure 21 Europe: Slip Additives Market Snapshot
Figure 22 APAC: Slip Additives Market Snapshot
Figure 23 Slip Additives Market: Competitive Leadership Mapping, 2018
Figure 24 Small and Medium-Sized Enterprises (Smse) Mapping, 2018
Figure 25 Companies Adopted Expansion as the Key Growth Strategy Between 2014 and 2019
Figure 26 Global Slip Additives Market Share, By Company, 2018
Figure 27 Fine Organics Industries: Company Snapshot
Figure 28 Fine Organics Industries: SWOT Analysis
Figure 29 Croda International: Company Snapshot
Figure 30 Croda International: SWOT Analysis
Figure 31 PMC Biogenix: SWOT Analysis
Figure 32 Lubrizol Corporation: Company Snapshot
Figure 33 Lubrizol Corporation: SWOT Analysis
Figure 34 BASF SE: Company Snapshot
Figure 35 BASF SE: SWOT Analysis
Figure 36 Honeywell International: Company Snapshot
Figure 37 Evonik Industries: Company Snapshot
Figure 38 BYK Additives & Instruments: Company Snapshot
Figure 39 Lonza Group: Company Snapshot
The study involved four major activities in estimating the market size of slip additives. Exhaustive secondary research was done to collect information on the market, the peer market, and the parent market. The next step was to validate these findings, assumptions, and sizing with industry experts across the value chain through primary research. Both top-down and bottom-up approaches were employed to estimate the complete market size. Thereafter, the market breakdown and data triangulation procedures were used to estimate the market size of the segments and subsegments.
Secondary Research
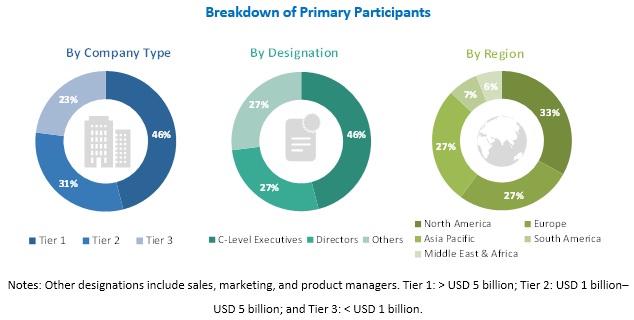
Secondary sources used in this study included annual reports, press releases, and investor presentations of companies; white papers; certified publications; articles from recognized authors; and gold standard & silver standard websites, such as Factiva, ICIS, and Bloomberg. The findings of this study were verified through primary research by conducting extensive interviews with key officials, such as CEOs, VPs, directors, and other executives. The breakdown of profiles of the primary interviewees is illustrated in the figure below.
Primary Research
The slip additives market comprises several stakeholders, such as raw material suppliers, end-product manufacturers, and regulatory organizations in the supply chain. The demand side of this market is characterized by the development of the packaging, healthcare, food & beverage, consumer goods, and other industries. The supply side is characterized by advancements in technology and diverse application industries. Various primary sources from both the supply and demand sides of the market were interviewed to obtain qualitative and quantitative information.
To know about the assumptions considered for the study, download the pdf brochure
Market Size Estimation
Both top-down and bottom-up approaches were used to estimate and validate the total size of the slip additives market. These methods were also used extensively to estimate the size of various subsegments in the market. The research methodology used to estimate the market size includes the following:
The key players in the industry were identified through extensive secondary research.
- The industry’s supply chain and market size, in terms of value, were determined through primary and secondary research processes.
- All percentage shares, splits, and breakdowns were determined using secondary sources and verified through primary sources.
Data Triangulation
After arriving at the overall market size-using the market size estimation processes as explained above-the market was split into several segments and subsegments. In order to complete the overall market engineering process and arrive at the exact statistics of each market segment and subsegment, the data triangulation and market breakdown procedures were employed, wherever applicable. The data was triangulated by studying various factors and trends from both the demand and supply sides in the packaging, healthcare, food & beverage, consumer goods, and other industries.
Report Objectives
- To analyze and forecast the size of the slip additives market in terms of value and volume
- To provide detailed information regarding key factors, such as drivers, restraints, challenges, and opportunities influencing the growth of the market
- To define, describe, and segment the slip additives market on the basis of type, application, and carrier resin
- To forecast the size of the market segments for regions, such as APAC, North America, Europe, South America, and the Middle East & Africa
- To strategically analyze the segmented markets with respect to individual growth trends, prospects, and contribution to the overall market
- To identify and analyze opportunities for stakeholders in the market
- To analyze competitive developments, such as expansions and new product launches, in the slip additives market
- To strategically profile key players and comprehensively analyze their core competencies
Available Customizations
Along with the given market data, MarketsandMarkets offers customizations according to the company’s specific needs. The following customization options are available for the report:
Regional Analysis
- Further breakdown of a region with respect to a particular country or additional application
Company Information
- Detailed analysis and profiles of additional market players (up to five)


Growth opportunities and latent adjacency in Slip Additives Market