Flavor Systems Market by Type (Brown, Dairy, Herbs & Botanicals, Fruits & Vegetables), Application (Beverages, Savories & Snacks, Bakery & Confectionery Products, Dairy & Frozen Desserts), Source, Form, and Region - Global Forecast to 2023


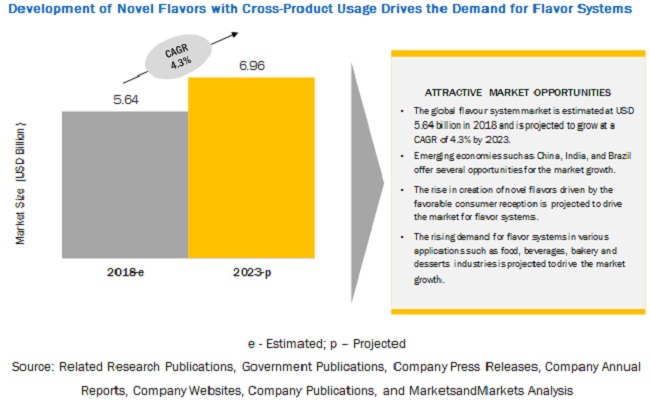
[137 Pages Report] The flavor systems market is estimated to account for a value of USD 5.64 billion in 2018 and is projected to grow at a CAGR of 4.3% from 2018, to reach a value of USD 6.96 billion by 2023. Creation of novel flavors driven by favorable consumer reception and cross product usage of flavors are some of the key factors driving the growth of the flavor systems market.
By Source, the Nature-identical segment is projected to be the fastest-growing segment in the flavor systems market during the forecast period.
Nature-identical substances are chemically identical to any substance that are naturally present in materials of plant and animal origins, and are therefore a more preferred choice, for both, manufacturers of end-products, and consumers alike. Most commercial flavorants are nature-identical substances, as these tend to be more stable in nature than natural flavoring extracts, while being a more cost-effective option, hence are projected to witness rapid growth in demand during the forecast period.
By application, the beverages segment is projected to dominate the flavor systems market during the forecast period.
Flavors of fruits & vegetables and spices are widely being utilized and blended with beverages such as coffee and chocolate shake to create a worming aroma and taste, and also to create a sweet and spicy warm fall flavor. Other flavors such as mint flavors are added in beverages to create refreshing flavor and aromatic taste. Such innovations and customization in beverage products and flavor variety in line with consumer demands, is projected to boost the growth for flavor enhancers in the beverage segment.
By type, brown segment is projected to dominate the flavor systems market during the forecast period.
Brown flavors are the most commonly used flavor variant, used across a number of applications. Brown flavors stand inclusive of flavors, such as, chocolate, coffee, nut, nougat, caramel, and vanilla. Additionally, they could also stand inclusive of a number of novel tastes, such as, egg-nog, salted caramel, brownie, that are optimized from chocolate, nougat, macademia, caramel, etc. Thus, due to its usages in wide variety of food and beverages application, brown flavor segment is projected dominate the global flavor systems market during the forecast period.
By form, liquid segment is projected to dominate the flavor systems market during the forecast period.
The major advantage associated with the usage of liquid flavor enhancers, is that these flavors can be easily mixed together, and will achieve a homogeneous distribution of each component in the finished flavor. Moreover, Liquid and water containing flavors can also be encapsulated following their conversion to semi-solid or pasty forms, to be used across a number of applications.
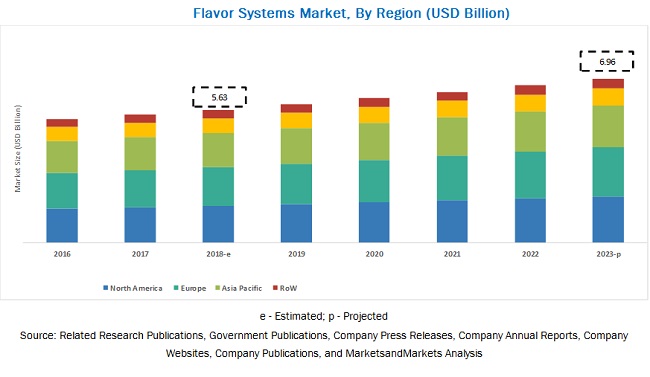
The increasing demand for flavor systems in the North American and European regions is driving the growth of the flavor systems market.
In Europe, the growth of flavor systems is attributed to the growth in the. Beverages, bakery and dairy & frozen desserts industry, with growing demand for flavor enhancers in confectionery products. Soft drinks, dairy products, frozen products, and other alcoholic and non-alcoholic beverages are the most innovative food sectors in the region, offering significant opportunities for the growth of flavoring systems. Furthermore, the growing consumption of bakery & confectionery products and savories & snack products, and the demand for their product variety has resulted in intensifying demand for flavor systems in these food products. The innovation in food applications, with the use of flavor systems in these industries, has resulted in new product development and increased consumption of flavor systems in different food applications in this region.
The demand for flavor systems in North America is driven by the increasing demand and creation of innovative flavor systems for processed food products as the region is among the largest consumers of processed food products. The market growth is further driven by the presence of a significant number of flavoring systems manufacturers in the region catering to the growing domestic as well as international market demand. Furthermore, the constantly evolving consumer demand for flavor varieties in end products together with the strategy of flavor systems market players to work in close proximity of their customers further aids the growth and development of the flavor systems market in the North American region.
Key Market Players
Givaudan (Switzerland), International Flavors & Fragrances (IFF) (US), Firmenich (Switzerland), Symrise (Germany), and Mane SA (France) are the leading players in the flavor systems market. Major players in this market are focusing on increasing their presence through expansions & investments, mergers & acquisitions, partnerships, joint ventures, and agreements. These companies have a strong presence in North America and Europe. They also have manufacturing facilities along with strong distribution networks across these regions.
Recent Developments:
- In January 2018, International Flavors and Fragrances (IFF) started the construction of its Flavors and Fragrances plant in Sri City, Andhra Pradesh, India. This unit is expected to commercialize by December 2019 and anticipated to be India�s largest flavor and fragrance manufacturing plant.
- In February 2018, Firmenich acquired Natural Flavors Inc. (US), a leader in manufacturing high-quality organic-certified natural flavors for the food & beverage industry.
- In February 2018, Firmenich acquired Flavourome (South Africa), a recognized flavor company. With this acquisition, the company will tap into the new market of South Africa to increase its customer base in the region.
- In June 2018, Givaudan completed the acquisition of 40.5% of the shares of Naturex (France), for USD 146 per share and a total consideration of USD 565 million. This acquisition would benefit the company in expanding its market in plant extracts for the food industry.
- In May 2018, International Flavors and Fragrances (IFF) and Frutarom (Israel) announced an agreement under which IFF will acquire Frutarom (Israel) at an estimated value of about USD 7.1 billion.
Key questions addressed by the report:
- What are the new application areas for the flavor systems market that companies are exploring?
- Who are some of the key players operating in the flavor systems market and how intense is the competition?
- What kind of competitors and stakeholders would be interested in this market? What will be their go-to-market strategy, and which emerging market will be of significant interest?
- How are the current R&D activities and M&A�s in the flavor systems market projected to create a disrupting environment in the coming years?
- What will be the level of impact of new product launches on the revenues of stakeholders, due to the benefits offered by flavor systems market, such as increasing revenue, environmental regulatory compliance, and sustainable profits for the suppliers?
Frequently Asked Questions (FAQ):
What is the leading application in the flavor systems market?
The beverages segment was the highest revenue contributor to the market, with USD 1,692.4 million in 2017, and is estimated to reach USD 2,235.2 million by 2023, with a CAGR of 4.8%.
What is the estimated industry size of flavor systems?
The global flavor systems market was valued at USD 5,434.3 million in 2017, and is projected to reach USD 6,963.6 million by 2023, registering a CAGR of 4.3% from 2018 to 2023.
What is the leading source of flavor systems market?
The nature-identical flavors segment was the highest revenue contributor to the market, with USD 2,466.2 million in 2017, and is estimated to reach USD 3,265.0 million by 2023, with a CAGR of 4.9%. .
To speak to our analyst for a discussion on the above findings, click Speak to Analyst
 Exclusive indicates content/data unique to MarketsandMarkets and not available with any competitors.
Table of Contents
1 Introduction (Page No. - 14)
1.1 Objectives of the Study
1.2 Market Definition
1.3 Study Scope
1.3.1 Markets Covered
1.3.2 Geographic Segmentation
1.4 Periodization Considered
1.5 Currency Considered
1.6 Stakeholders
2 Research Methodology (Page No. - 19)
2.1 Research Data
2.1.1 Secondary Data
2.1.1.1 Key Data From Secondary Sources
2.1.2 Primary Data
2.1.2.1 Key Data From Primary Sources
2.1.2.2 Breakdown of Primaries
2.2 Market Size Estimation
2.3 Data Triangulation
2.4 Research Assumptions & Limitations
2.4.1 Research Assumptions
2.4.2 Research Limitations
3 Executive Summary (Page No. - 28)
4 Premium Insights (Page No. - 33)
4.1 Attractive Opportunities in the Flavor Systems Market
4.2 Flavor Systems Market, By Key Country
4.3 Europe: Flavor Systems Market, By Type & Key Country
4.4 Flavor Systems Market, By Form & Region
4.5 Flavor Systems Market, By Application & Region
5 Market Overview (Page No. - 37)
5.1 Introduction
5.2 Market Dynamics
5.2.1 Drivers
5.2.1.1 Creation of Novel Flavors Driven By Favorable Consumer Reception
5.2.1.2 Cross-Product Usage of Flavors
5.2.2 Restraints
5.2.2.1 Limited Extraction From Natural Sources
5.2.3 Opportunities
5.2.3.1 Mass Customization Creating New Market Opportunities
5.2.4 Challenges
5.2.4.1 Increase in the Prices of End Products
5.3 Value Chain
6 Flavor Systems Market, By Type (Page No. - 42)
6.1 Introduction
6.2 Brown
6.3 Dairy
6.4 Herbs & Botanicals
6.5 Fruits & Vegetables
6.6 Others
7 Flavor Systems Market, By Source (Page No. - 48)
7.1 Introduction
7.2 Nature-Identical Flavors
7.3 Artificial Flavors
7.4 Natural Flavors
8 Flavor Systems Market, By Form (Page No. - 53)
8.1 Introduction
8.2 Liquid
8.3 Dry
9 Flavor Systems Market, By Application (Page No. - 57)
9.1 Introduction
9.2 Beverages
9.3 Dairy & Frozen Desserts
9.4 Bakery & Confectionery Products
9.5 Savories & Snacks
10 Flavor Systems Market, By Region (Page No. - 62)
10.1 Introduction
10.2 North America
10.2.1 US
10.2.2 Canada
10.2.3 Mexico
10.3 Europe
10.3.1 Germany
10.3.2 France
10.3.3 UK
10.3.4 Italy
10.3.5 Spain
10.3.6 Rest of Europe
10.4 Asia Pacific
10.4.1 China
10.4.2 Japan
10.4.3 India
10.4.4 Australia
10.4.5 New Zealand
10.4.6 Rest of Asia-Pacific
10.5 South America
10.5.1 Brazil
10.5.2 Argentina
10.5.3 Rest of South America
10.6 Rest of the World (RoW)
10.6.1 Middle East
10.6.2 Africa
11 Competitive Landscape (Page No. - 94)
11.1 Overview
11.2 Market Share Analysis
11.3 Competitive Scenario
11.3.1 Expansions and Investments
11.3.2 Acquisitions
11.3.3 New Product Launches
11.3.4 Joint Ventures and Partnerships
12 Company Profiles (Page No. - 100)
(Business Overview, Products Offered, Recent Developments, MnM View, SWOT Analysis)*
12.1 Givaudan
12.2 International Flavors & Fragrances (IFF)
12.3 Firmenich
12.4 Symrise
12.5 Frutarom
12.6 Sensient
12.7 Mane Sa
12.8 Takasago
12.9 Robertet
12.10 Tate & Lyle
12.11 T. Hasegawa
12.12 Kerry Group
*Business Overview, Products Offered, Recent Developments, MnM View, SWOT Analysis Might Not Be Captured in Case of Unlisted Companies.
13 Appendix (Page No. - 130)
13.1 Discussion Guide
13.2 Knowledge Store: Marketsandmarkets� Subscription Portal
13.3 Available Customizations
13.4 Related Reports
13.5 Author Details
List of Tables (70 Tables)
Table 1 US Dollar Exchange Rate Considered for the Study, 2013�2017
Table 2 Flavor Systems Market Snapshot (Value), 2018 vs 2023
Table 3 Market Size, By Type, 2016�2023 (USD Million)
Table 4 Brown: Flavor Systems Market Size, By Region, 2016�2023 (USD Million)
Table 5 Dairy: Flavor Systems Market Size, By Region, 2016�2023 (USD Million)
Table 6 Herbs & Botanicals: Flavor Systems Market Size, By Region, 2016�2023 (USD Million)
Table 7 Fruits & Vegetables: Flavor Systems Market Size, By Region, 2016�2023 (USD Million)
Table 8 Others: Flavor Systems Market Size, By Region, 2016�2023 (USD Million)
Table 9 Flavor Systems Market Size, By Source, 2016�2023 (USD Million)
Table 10 Nature Identical Flavors in Flavor Systems Market Size, By Region, 2016�2023 (USD Million)
Table 11 Artificial Flavors in Flavor Systems Market Size, By Region, 2016�2023 (USD Million)
Table 12 Natural Flavors in Flavor Systems Market Size, By Region, 2016�2023 (USD Million)
Table 13 Flavor Systems Market Size, By Form, 2016�2023 (USD Million)
Table 14 Liquid Flavor Systems Market Size, By Region, 2016�2023 (USD Million)
Table 15 Dry Flavor Systems Market Size, By Region, 2016�2023 (USD Million)
Table 16 Flavor Systems Market Size, By Application, 2016�2023 (USD Million)
Table 17 Beverages: Flavor Systems Market Size, By Region, 2016�2023 (USD Million)
Table 18 Dairy & Frozen Desserts: Flavor Systems Market Size, By Region, 2016�2023 (USD Million)
Table 19 Bakery & Confectionery Products: Flavor Systems Market Size, By Region, 2016�2023 (USD Million)
Table 20 Savories & Snacks: Flavor Systems Market Size, By Region, 2016�2023 (USD Million)
Table 21 Flavor Systems Market Size, By Region, 2016�2023 (USD Million)
Table 22 North America: Flavor Systems Market Size, By Country, 2016�2023 (USD Million)
Table 23 North America: Market Size, By Type, 2016�2023 (USD Million)
Table 24 North America: Market Size, By Source, 2016�2023 (USD Million)
Table 25 North America: Market Size, By Form, 2016�2023 (USD Million)
Table 26 North America: Market Size, By Application, 2016�2023 (USD Million)
Table 27 US: Market Size, By Type, 2016�2023 (USD Million)
Table 28 Canada: Market Size, By Type, 2016�2023 (USD Million)
Table 29 Mexico: Market Size, By Type, 2016�2023 (USD Million)
Table 30 Europe: Flavor Systems Market Size, By Country, 2016�2023 (USD Million)
Table 31 Europe: Market Size, By Type, 2016�2023 (USD Million)
Table 32 Europe: Market Size, By Source, 2016�2023 (USD Million)
Table 33 Europe: Market Size, By Form, 2016�2023 (USD Million)
Table 34 Europe: Market Size, By Application, 2016�2023 (USD Million)
Table 35 Germany: Market Size, By Type, 2016�2023 (USD Million)
Table 36 France: Market Size, By Type, 2016�2023 (USD Million)
Table 37 UK: Market Size, By Type, 2016�2023 (USD Million)
Table 38 Italy: Market Size, By Type, 2016�2023 (USD Million)
Table 39 Spain: Market Size, By Type, 2016�2023 (USD Million)
Table 40 Rest of Europe: Flavor Systems Market Size, By Type, 2016�2023 (USD Million)
Table 41 Asia Pacific: Flavor Systems Market Size, By Country, 2016�2023 (USD Million)
Table 42 Asia Pacific: Market Size, By Type, 2016�2023 (USD Million)
Table 43 Asia Pacific: Market Size, By Source, 2016�2023 (USD Million)
Table 44 Asia Pacific: Market Size, By Form, 2016�2023 (USD Million)
Table 45 Asia Pacific: Market Size, By Application, 2016�2023 (USD Million)
Table 46 China: Market Size, By Type, 2016�2023 (USD Million)
Table 47 Japan: Market Size, By Type, 2016�2023 (USD Million)
Table 48 India: Market Size, By Type, 2016�2023 (USD Million)
Table 49 Australia: Market Size, By Type, 2016�2023 (USD Million)
Table 50 New Zealand: Market Size, By Type, 2016�2023 (USD Million)
Table 51 Rest of Asia Pacific: Flavor Systems Market Size, By Type, 2016�2023 (USD Million)
Table 52 South America: Flavor Systems Market Size, By Country, 2016�2023 (USD Million)
Table 53 South America: Market Size, By Type, 2016�2023 (USD Million)
Table 54 South America: Market Size, By Source, 2016�2023 (USD Million)
Table 55 South America: Market Size, By Form, 2016�2023 (USD Million)
Table 56 South America: Market Size, By Application, 2016�2023 (USD Million)
Table 57 Brazil: Market Size, By Type, 2016�2023 (USD Million)
Table 58 Africa: Market Size, By Type, 2016�2023 (USD Million)
Table 59 Rest of South America: Flavor Systems Market Size, By Type, 2016�2023 (USD Million)
Table 60 RoW: Flavor Systems Market Size, By Region, 2016�2023 (USD Million)
Table 61 RoW: Market Size, By Type, 2016�2023 (USD Million)
Table 62 RoW: Market Size, By Source, 2016�2023 (USD Million)
Table 63 RoW: Market Size, By Form, 2016�2023 (USD Million)
Table 64 RoW: Market Size, By Application, 2016�2023 (USD Million)
Table 65 Middle East: Flavor Systems Market Size, By Country, 2016�2023 (USD Million)
Table 66 Africa: Market Size, By Country, 2016�2023 (USD Million)
Table 67 Expansions and Investments, 2017-2018
Table 68 Acquisitions, 2017-2018
Table 69 New Product Launches, 2015-2018
Table 70 Joint Ventures and Partnerships, 2016-2018
List of Figures (44 Figures)
Figure 1 Flavor Systems Market Snapshot
Figure 2 Market, By Region
Figure 3 Market: Research Design
Figure 4 Market Size Estimation Methodology: Bottom-Up Approach
Figure 5 Market Size Estimation Methodology: Top-Down Approach
Figure 6 Data Triangulation
Figure 7 Flavor Systems Market Size, By Type, 2018 vs 2023 (USD Million)
Figure 8 Market Size, By Application, 2018 vs 2023 (USD Million)
Figure 9 Market Size, By Source, 2018 vs 2023 (USD Million)
Figure 10 Market Size, By Form, 2018 vs 2023 (USD Million)
Figure 11 Flavor Systems Market Share (Value), By Region, 2017
Figure 12 Development of Novel Flavors With Cross-Product Usage Drives the Demand for Flavor Systems
Figure 13 UK is Projected to Be the Fastest-Growing Market for Flavor Systems Between 2018 and 2023
Figure 14 Brown Flavor Accounted for the Largest Share of the European Flavor Systems Market
Figure 15 Nature-Identical Segment to Dominate the Flavor Systems Market Across Regions Through 2023
Figure 16 Beverages to Be the Fastest-Growing Segment During the Forecast Period, 2018�2023
Figure 17 Flavor Systems Market Dynamics
Figure 18 Market: Value Chain
Figure 19 Flavor Systems Market Share (Value), By Type, 2018 vs 2023
Figure 20 Market Share (Value), By Form, 2018 vs 2023
Figure 21 Market Share (Value), By Form, 2018 vs 2023
Figure 22 Market Share (Value), By Application, 2018 vs 2023
Figure 23 Market Share, By Key Country, 2017
Figure 24 North America: Market Snapshot, 2017
Figure 25 Europe: Market Snapshot, 2017
Figure 26 Key Developments of the Leading Players in the Flavor Systems Market, 2014�2018
Figure 27 Market Share of Key Players in the Flavor Systems Market
Figure 28 Market Evaluation Framework
Figure 29 Givaudan: Company Snapshot
Figure 30 Givaudan: SWOT Analysis
Figure 31 International Flavors & Fragrances (IFF): Company Snapshot
Figure 32 International Flavors and Fragrances (IFF): SWOT Analysis
Figure 33 Firmenich: SWOT Analysis
Figure 34 Symrise: Company Snapshot
Figure 35 Symrise: SWOT Analysis
Figure 36 Frutarom: Company Snapshot
Figure 37 Frutarom: SWOT Analysis
Figure 38 Sensient: Company Snapshot
Figure 39 Mane Sa: Company Snapshot
Figure 40 Takasago: Company Snapshot
Figure 41 Robertet: Company Snapshot
Figure 42 Tate & Lyle: Company Snapshot
Figure 43 T. Hasegawa: Company Snapshot
Figure 44 Kerry Group: Company Snapshot
The study involves four major activities to estimate the current market size of the flavor systems market. Exhaustive secondary research was done to collect information on the market, peer market, and parent market. These findings, assumptions, and market sizes were validated with industry experts across the value chain through primary research. Both the top-down and bottom-up approaches were employed to estimate the complete market size. Thereafter, the market breakdown and data triangulation approaches were used to estimate the market size of segments and sub segments.
Secondary Research
In the secondary research process, various secondary sources such as Hoovers, Bloomberg BusinessWeek, and Dun & Bradstreet were referred to, in order to identify and collect information for this study. These secondary sources included annual reports, press releases & investor presentations of companies, white papers, certified publications, articles by recognized authors, gold standard & silver standard websites, food safety organizations, regulatory bodies, trade directories, and databases.
Primary Research
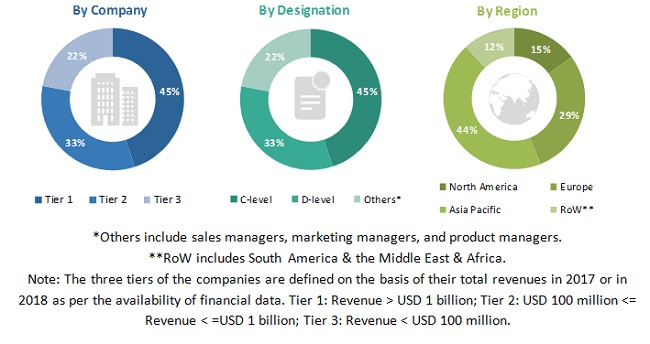
The flavor systems market comprises several stakeholders such as manufacturers, importers and exporters, traders, distributors, and suppliers of flavouring systems, feed processors & manufacturers, government & research organizations. It also includes manufacturers of food and beverages companies. The demand-side of this market is characterized by the rising demand for flavor enhancers in the food, beverages, bakery, confectionery and dessert industries. Various primary sources from both the supply and demand sides of the market were interviewed to obtain qualitative and quantitative information. Following is the breakdown of primary respondents:
To know about the assumptions considered for the study, download the pdf brochure
Market Size Estimation
Both the top-down and bottom-up approaches were used to estimate and validate the total size of the flavor systems market. These methods were also used extensively to estimate the size of various subsegments in the market. The research methodology used to estimate the market size includes the following:
- The key players in the industry and markets were identified through extensive secondary research.
- The industry�s supply chain and market size, in terms of value, was determined through primary and secondary research processes.
- All percentage shares, splits, and breakdowns were determined using secondary sources and verified through primary respondents
Data Triangulation
After arriving at the overall market size�using the market size estimation processes as explained above�the market was split into several segments and sub segments. In order to complete the overall market engineering process and arrive at the exact statistics of each market segment and sub segment, the data triangulation and market breakdown procedures were employed. The data was triangulated by studying various factors and trends from both the demand and supply sides in the flavor systems market.
Report Objectives
- To define, segment, and project the global market size of the flavor systems market.
- To understand the flavor systems market by identifying its various sub segments
- To provide detailed information about the key factors influencing the growth of the market (drivers, restraints, opportunities, and industry-specific challenges)
- To analyze the micromarkets with respect to individual growth trends, future prospects, and their contribution to the total market
- To project the size of the market and its submarkets, in terms of value, with respect to the regions (along with their respective key countries)
- To profile key players and comprehensively analyze their core competencies
- To understand the competitive landscape and identify major growth strategies adopted by players across key regions
- To analyze the competitive developments such as expansions & investments, mergers & acquisitions, new product launches, partnerships, joint ventures, and agreements
Scope of the report
|
Report Metric |
Details |
|
Market size available for years |
2016-2023 |
|
Base year considered |
2017 |
|
Forecast period |
2018-2023 |
|
Forecast units |
Value (USD) |
|
Segments covered |
Type, Source, Form, Application, and Region |
|
Geographies covered |
North America, Europe, Asia Pacific, South America RoW |
|
Companies covered |
Givaudan (Switzerland), International Flavors & Fragrances (IFF) (US), Firmenich (Switzerland), Symrise (Germany), Frutarom (Israel), Sensient (US), MANE SA (France), Tate & Lyle (UK), Robertet (France), Takasago (Japan), T. Hasegawa (Japan), and Kerry Group (Ireland). |
This research report categorizes the flavor systems market based on type, category, application, and region.
On the basis of type, the flavor systems market has been segmented as follows:
- Brown
- Dairy
- Herbs & Botanicals
- Fruits & vegetable
- Others
On the basis of source, the flavor systems market has been segmented as follows:
- Nature-identical flavors
- Artificial flavors
- Natural flavors
On the basis of form, the flavor systems market has been segmented as follows:
- Liquid
- Dry
On the basis of application, the flavor systems market has been segmented as follows:
- Beverages
- Dairy & frozen desserts
- Bakery & confectionery products
- Savories & snacks
On the basis of region, the flavor systems market has been segmented as follows:
- North America
- Europe
- Asia Pacific
- South America
- Rest of World (RoW)*
*Rest of the World (RoW) includes South America and the Middle East & Africa
Available Customizations
With the given market data, MarketsandMarkets offers customizations according to the company�s specific scientific needs.
The following customization options are available for the report:
Product Analysis
Product matrix, which gives a detailed comparison of the product portfolio of each companyGeographic Analysis
- Further breakdown of the Rest of Europe flavor systems market into Italy, Denmark, Belgium, and the Netherlands
- Further breakdown of the Rest of Asia Pacific flavor systems market into Indonesia, Thailand, Vietnam, Singapore, Malaysia, Pakistan, the Philippines, and South Korea
- Further breakdown of the RoW flavor systems market into Brazil, Argentina, Peru, the UAE, and South Africa
Company Information
- � Detailed analyses and profiling of additional market players (up to five)


Growth opportunities and latent adjacency in Flavor Systems Market