Fluid Loss Additives Market by Type (Synthetically Modified Natural (PAC, CMC), Synthetic (Acrylic Sulphonated Polymers), Natural (Starch, Lignin, Bentonite)), Application (Drilling Fluid, Cement Slurry) - Global Forecast to 2024


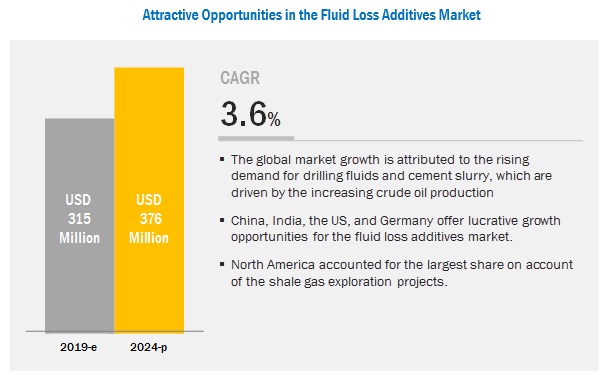
[112 Pages Report] The fluid loss additives market size is projected to reach USD 376 million by 2024 from USD 315 million in 2019, at a CAGR of 3.6%. Increasing shale gas exploration and crude oil production are the major factors driving the growth of the fluid loss additives market. Technological developments have enabled exploration activities to be carried out for sources other than oil, such as shale gas, coal bed methane, and unconventional resources. These activities require sophisticated technologies such as multistage hydraulic fracturing of horizontal wells. These are carried out with the help of various formulated drilling fluids that help to maintain wellbore stable, pump pressure, avoid friction and corrosion and remove & transport cuttings.
The exploration activities are expected to grow further to produce around 6 Mbbl/d (Mbbl/d- One thousand barrels per day) by 2020 from these resources. As the fluid loss additive is one of the most important additives used in the drilling process, the increasing shale gas exploration will drive the growth of the market between 2019 and 2024.
Synthetically modified natural additives to witness the fastest growth during the forecast period.
Based on material type, the fluid loss additives market has been segmented into synthetically modified additives, natural additives, and synthetic additives. The synthetically modified natural additives segment is estimated to register the highest growth in terms of value and volume, of the global fluid loss additives market. The demand for synthetically modified natural additives is very high across the globe, mainly due to its high performance at extreme conditions, including high temperature & pressure.
The drilling fluid segment is projected to be the application of fluid loss additives during the forecast period.
The drilling fluid segment is projected to dominate the fluid loss additives market during the forecast period. Fluid loss additives are an important component used to avoid loss of filtrate during well drilling. As the demand for crude oil is increasing the drilling activities are also rising, which in turn is fueling the growth of the fluid loss additives market in the drilling fluid application.
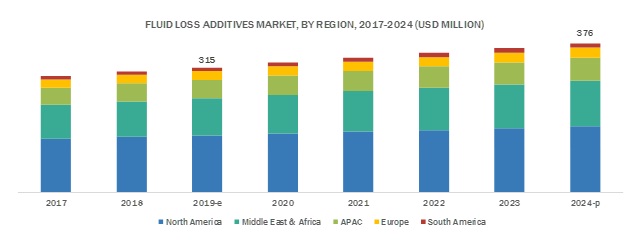
North America to account for the largest share of the global fluid loss additives market during the forecast period.
North America is expected to account for the largest market share in fluid loss additives during the forecast period, in terms of value. The North American countries, especially, the US are one of the largest producers of crude oil and have made large investments in unconventional drilling technologies such as horizontal drilling and hydraulic fracturing where fluid loss additives have a major role to play. Also, the increasing shale gas exploration in the US is driving the fluid loss additives market in North America.
Key Market Players
The key market players profiled in the report include as Halliburton (US), Schlumberger Limited (US), Newpark Resources Inc. (US), Solvay (Belgium), BASF SE (Germany), and Clariant (Switzerland), Global Drilling Fluid and Chemicals Limited (India), Tytan Organics (India) and Nouryon (US).
Schlumberger Limited (US) has a vast global presence that operations in more than 85 countries and 125 research and engineering facilities worldwide. It provides a wide range of products that can be used in applications, including drilling production and processing of oil & gas. Schlumberger is highly focused on research and innovation. For instance, in 2017, the company invested USD 800 million in research and engineering for oilfield activities.
Halliburton (US) is focusing on delivering superior-quality products through advanced infrastructure and technological innovations, thereby differentiating it from its competitors. Halliburton is focusing on achieving a competitive position in the oilfield service market, globally. The collaborative approach and differentiating technologies help the company to gain an additional market share in the international markets.
Scope Of The Report
|
Report Metric |
Details | |
|
|
|
|
| |
|
| |
|
| |
|
| |
|
| |
|
|
This report categorizes the global fluid loss additives market based on type, application, and region.
On the basis of type, the fluid loss additives market has been segmented as follows:
- Synthetically Modified Natural Additives
- Synthetic Additives
- Natural Additives
On the basis of application, the fluid loss additives market has been segmented as follows:
- Drilling Fluid
- Cement Slurry
On the basis of region, the fluid loss additives market has been segmented as follows:
- APAC
- North America
- Europe
- Middle East & Arica
- South America
Key Questions addressed by the report
- What are the major developments impacting the market?
- Where will all the developments take the industry in the mid to long term?
- What are the upcoming material types of fluid loss additives?
- What are the emerging applications of fluid loss additives?
- What are the emerging end-use industries of fluid loss additives?
- What are the major factors impacting market growth during the forecast period?
Frequently Asked Questions (FAQ):
What are the factors Influencing the growth of fluid loss additive market?
What are the major types of fluid loss additives?
Who are the major manufacturers?
What is the biggest Restraint for fluid loss additives?
What is the high growth applications for fluid loss additives?
What is the upcoming opportunity for the fluid loss additives market?
To speak to our analyst for a discussion on the above findings, click Speak to Analyst
 Exclusive indicates content/data unique to MarketsandMarkets and not available with any competitors.
Table of Contents
1 Introduction (Page No. - 16)
1.1 Objectives of the Study
1.2 Market Definition
1.3 Market Scope
1.3.1 Regions Covered
1.3.2 Years Considered for the Study
1.4 Currency
1.5 Unit Considered
1.6 Stakeholders
2 Research Methodology (Page No. - 19)
2.1 Research Data
2.1.1 Secondary Data
2.1.1.1 Key Data From Secondary Sources
2.1.2 Primary Data
2.1.2.1 Key Data From Primary Sources
2.1.2.2 Breakdown of Primary Interviews
2.2 Market Size Estimation
2.2.1 Bottom-Up Approach
2.2.2 Top-Down Approach
2.3 Data Triangulation
2.4 Assumptions
2.5 Limitations
3 Executive Summary (Page No. - 25)
4 Premium Insights (Page No. - 28)
4.1 Significant Opportunities in the Fluid Loss Additives Market
4.2 Fluid Loss Additives Market Size, By Region
4.3 North America Fluid Loss Additives Market, By Application and Country
4.4 Fluid Loss Additives Market Size, By Application
4.5 Fluid Loss Additives Market Attractiveness
4.6 Fluid Loss Additives Market Size, By Type and Region
5 Market Overview (Page No. - 31)
5.1 Introduction
5.2 Market Dynamics
5.2.1 Drivers
5.2.1.1 Increasing Crude Oil Production
5.2.1.2 Increase in Shale Gas Exploration
5.2.2 Restraints
5.2.2.1 Environmental Impact
5.2.3 Opportunities
5.2.3.1 Increasing Focus on Deep and Ultra-Deepwater Drilling
5.3 Porter�s Five Forces Analysis
5.3.1 Threat of New Entrants
5.3.2 Threat of Substitutes
5.3.3 Bargaining Power of Suppliers
5.3.4 Bargaining Power of Buyers
5.3.5 Intensity of Competitive Rivalry
5.4 Industry Outlook
5.4.1 Oil & Gas Industry
6 Fluid Loss Additives Market, By Type (Page No. - 37)
6.1 Introduction
6.2 Synthetically Modified Natural Additives
6.2.1 PAC and CMC are the Most Common Types of Fluid Loss Additives
6.3 Synthetic Additives
6.3.1 Low Price Drives the Synthetic Fluid Loss Additives Market
6.4 Natural Additives
6.4.1 Demand for Starch and Lignine to Drive the Market
7 Fluid Loss Additives Market, By Application (Page No. - 44)
7.1 Introduction
7.2 Drilling Fluid
7.2.1 High Consumption of Drilling Fluid Across the Globe is Driving the Market
7.3 Cement Slurry
7.3.1 Increased Need for Gas Migration Control to Drive the Market
8 Fluid Loss Additives Market, By Region (Page No. - 49)
8.1 Introduction
8.2 North America
8.2.1 US
8.2.1.1 Growth of the Oil & Gas Industry is Likely to Have A Positive Impact on the Fluid Loss Additives Market in the US
8.2.2 Canada
8.2.2.1 Presence of Domestic and International Oil Companies to Drive the Fluid Loss Additives Market
8.2.3 Mexico
8.2.3.1 Rising Foreign Investment is Likely to Propel the Fluid Loss Additives Market Growth
8.3 APAC
8.3.1 China
8.3.1.1 The Country�s Focus on Developing New Reserves is A Major Driver for the Fluid Loss Additives Market
8.3.2 Indonesia
8.3.2.1 Increasing Oil Production to Drive the Market
8.3.3 India
8.3.3.1 Rising Domestic Demand to Drive the Fluid Loss Additives Market
8.3.4 Malaysia
8.3.4.1 Government Initiatives in the Oil Sector to Drive the Market
8.4 Europe
8.4.1 Russia
8.4.1.1 Well-Established Oil & Gas Industry is Expected to Augment the Demand for Fluid Loss Additives in Russia
8.4.2 Norway
8.4.2.1 Subsidy in Exploration Acts as A Driver for the Fluid Loss Additives Market in Norway
8.4.3 UK
8.4.3.1 New Upcoming Projects in the North Sea to Drive the UK Fluid Loss Additives Market
8.4.4 Netherlands
8.4.4.1 Growth in Gas Exploration is Propelling the Market Growth in the Netherlands
8.5 Middle East & Africa
8.5.1 Saudi Arabia
8.5.1.1 Saudi Arabia is the Largest Fluid Loss Additives Market in the Middle East & Africa
8.5.2 UAE
8.5.2.1 The Increased Oil Production in Abu Dhabi is Expected to Drive the UAE Market
8.5.3 Iran
8.5.3.1 Growing Crude Oil Production is Expected to Drive the Fluid Loss Additives Market Growth
8.6 South America
8.6.1 Brazil
8.6.1.1 Brazil is the Largest Fluid Loss Additives Market in South America
8.6.2 Venezuela
8.6.2.1 The Oil & Gas Industry is Propelling the Fluid Loss Additives Market in Venezuela
8.6.3 Colombia
8.6.3.1 Rising Investment in Oil & Gas Sector to Drive the Market
9 Competitive Landscape (Page No. - 81)
9.1 Introduction
9.2 Competitive Leadership Mapping, Tier 1 Companies
9.2.1 Visionary Leaders
9.2.2 Dynamic Differentiators
9.2.3 Innovators
9.2.4 Emerging Companies
9.3 Strength of Product Portfolio
9.4 Business Strategy Excellence
9.5 Competitive Leadership Mapping (Small and Medium-Sized Enterprises)
9.5.1 Progressive Companies
9.5.2 Responsive Companies
9.5.3 Dynamic Companies
9.5.4 Starting Blocks
9.6 Strength of Product Portfolio
9.7 Business Strategy Excellence
9.8 Market Share Analysis
9.8.1 Schlumberger Limited
9.8.2 Halliburton
9.8.3 Newpark Resources Inc.
10 Company Profiles (Page No. - 88)
(Business Overview, Products Offered, SWOT Analysis, MnM View)*
10.1 Schlumberger Limited
10.2 BASF SE
10.3 Halliburton
10.4 Nouryon
10.5 Newpark Resources Inc.
10.6 Kemira OYJ
10.7 Clariant
10.8 Solvay
10.9 Global Drilling Fluids and Chemicals Limited
10.10 Tytan Organics Pvt. Ltd.
10.11 Other Key Players
10.11.1 The Dow Chemical Company
10.11.2 Omnova Solutions
10.11.3 Aubin Group
10.11.4 Chevron Phillips Chemical Company
10.11.5 Innospec
10.11.6 Ashland
10.11.7 Universal Drilling Fluids
10.11.8 Sekisui Specialty Chemicals America
10.11.9 Tianjin Kelioil Engineering Material and Technology Co., Ltd.
10.11.10 Elkem Asa
10.11.11 Alwintec (Alwaad International Company)
10.11.12 Unikem
10.11.13 Dosas (Dutch Oilfield Supply and Services)
10.11.14 Ineos
*Details on Business Overview, Products Offered, SWOT Analysis, MnM View Might Not Be Captured in Case of Unlisted Companies.
11 Appendix (Page No. - 106)
11.1 Discussion Guide
11.2 Knowledge Store: Marketsandmarkets Subscription Portal
11.3 Available Customizations
11.4 Related Reports
11.5 Author Details
List of Tables (85 Tables)
Table 1 APAC: Oil Production, By Key Country, 2017 (Million Ton)
Table 2 North America: Oil Production, By Key Country, 2017 (Million Ton)
Table 3 Europe: Oil Production, By Key Country, 2017 (Million Ton)
Table 4 South America: Oil Production, By Key Country, 2017 (Million Ton)
Table 5 Middle East & Africa: Oil Production, By Key Country, 2017 (Million Ton)
Table 6 Fluid Loss Additives Market Size, By Type, 2017�2024 (Ton)
Table 7 Fluid Loss Additives Market Size, By Type, 2017�2024 (USD Thousand)
Table 8 Synthetically Modified Natural Fluid Loss Additives Market Size, By Region, 2017�2024 (Ton)
Table 9 Synthetically Modified Natural Fluid Loss Additives Market Size, By Region, 2017�2024 (USD Thousand)
Table 10 Synthetic Fluid Loss Additives Market Size, By Region, 2017�2024 (Ton)
Table 11 Synthetic Fluid Loss Additives Market Size, By Region, 2017�2024 (USD Thousand)
Table 12 Natural Fluid Loss Additives Market Size, By Region, 2017�2024 (Ton)
Table 13 Natural Fluid Loss Additives Market Size, By Region, 2017�2024 (USD Thousand)
Table 14 Fluid Loss Additives Market Size, By Application, 2017�2024 (Ton)
Table 15 Fluid Loss Additives Market Size, By Application, 2017�2024 (USD Thousand)
Table 16 Fluid Loss Additives Market Size in Drilling Fluid, By Region, 2017�2024 (Ton)
Table 17 Fluid Loss Additives Market Size in Drilling Fluid, By Region, 2017�2024 (USD Thousand)
Table 18 Fluid Loss Additives Market Size in Cement Slurry, By Region, 2017�2024 (Ton)
Table 19 Fluid Loss Additives Market Size in Cement Slurry, By Region, 2017�2024 (USD Thousand)
Table 20 Fluid Loss Additives Market Size, By Region, 2017�2024 (Ton)
Table 21 Fluid Loss Additives Market Size, By Region, 2017�2024 (USD Thousand)
Table 22 North America: Fluid Loss Additives Market Size, By Country, 2017�2024 (Ton)
Table 23 North America: Fluid Loss Additives Market Size, By Country, 2017�2024 (USD Thousand)
Table 24 North America: Fluid Loss Additives Market Size, By Application, 2017�2024 (Ton)
Table 25 North America: Fluid Loss Additives Market Size, By Application, 2017�2024 (USD Thousand)
Table 26 North America: Fluid Loss Additives Market Size, By Type, 2017�2024 (Ton)
Table 27 North America: Fluid Loss Additives Market Size, By Type, 2017�2024 (USD Thousand)
Table 28 US: Fluid Loss Additives Market Size, By Application, 2017�2024 (Ton)
Table 29 US: Fluid Loss Additives Market Size, By Application, 2017�2024 (USD Thousand)
Table 30 Canada: Fluid Loss Additives Market Size, By Application, 2017�2024 (Ton)
Table 31 Canada: Fluid Loss Additives Market Size, By Application, 2017�2024 (USD Thousand)
Table 32 Mexico: Fluid Loss Additives Market Size, By Application, 2017�2024 (Ton)
Table 33 Mexico: Fluid Loss Additives Market Size, By Application, 2017�2024 (USD Thousand)
Table 34 APAC: Fluid Loss Additives Market Size, By Country, 2017�2024 (Ton)
Table 35 APAC: Fluid Loss Additives Market Size, By Country, 2017�2024 (USD Thousand)
Table 36 APAC: Fluid Loss Additives Market Size, By Application, 2017�2024 (Ton)
Table 37 APAC: Fluid Loss Additives Market Size, By Application, 2017�2024 (USD Thousand)
Table 38 APAC: Fluid Loss Additives Market Size, By Type, 2017�2024 (Ton)
Table 39 APAC: Fluid Loss Additives Market Size, By Type, 2017�2024 (USD Thousand)
Table 40 China: Fluid Loss Additives Market Size, By Application, 2017�2024 (Ton)
Table 41 China: Fluid Loss Additives Market Size, By Application, 2017�2024 (USD Thousand)
Table 42 Indonesia: Fluid Loss Additives Market Size, By Application, 2017�2024 (Ton)
Table 43 Indonesia: Fluid Loss Additives Market Size, By Application, 2017�2024 (USD Thousand)
Table 44 India: Fluid Loss Additives Market Size, By Application, 2017�2024 (Ton)
Table 45 India: Fluid Loss Additives Market Size, By Application, 2017�2024 (USD Thousand)
Table 46 Malaysia: Fluid Loss Additives Market Size, By Application, 2017�2024 (Ton)
Table 47 Malaysia: Fluid Loss Additives Market Size, By Application, 2017�2024 (USD Thousand)
Table 48 Europe: Fluid Loss Additives Market Size, By Country, 2017�2024 (Ton)
Table 49 Europe: Fluid Loss Additives Market Size, By Country, 2017�2024 (USD Thousand)
Table 50 Europe: Fluid Loss Additives Market Size, By Application, 2017�2024 (Ton)
Table 51 Europe: Fluid Loss Additives Market Size, By Application, 2017�2024 (USD Thousand)
Table 52 Europe: Fluid Loss Additives Market Size, By Type, 2017�2024 (Ton)
Table 53 Europe: Fluid Loss Additives Market Size, By Type, 2017�2024 (USD Thousand)
Table 54 Russia: Fluid Loss Additives Market Size, By Application, 2017�2024 (Ton)
Table 55 Russia: Fluid Loss Additives Market Size, By Application, 2017�2024 (USD Thousand)
Table 56 Norway: Fluid Loss Additives Market Size, By Application, 2017�2024 (Ton)
Table 57 Norway: Fluid Loss Additives Market Size, By Application, 2017�2024 (USD Thousand)
Table 58 UK: Fluid Loss Additives Market Size, By Application, 2017�2024 (Ton)
Table 59 UK: Fluid Loss Additives Market Size, By Application, 2017�2024 (USD Thousand)
Table 60 Netherlands: Fluid Loss Additives Market Size, By Application, 2017�2024 (Ton)
Table 61 Netherlands: Fluid Loss Additives Market Size, By Application, 2017�2024 (USD Thousand)
Table 62 Middle East & Africa: Fluid Loss Additives Market Size, By Country, 2017�2024 (Ton)
Table 63 Middle East & Africa: Fluid Loss Additives Market Size, By Country, 2017�2024 (USD Thousand)
Table 64 Middle East & Africa: Fluid Loss Additives Market Size, By Application, 2017�2024 (Ton)
Table 65 Middle East & Africa: Fluid Loss Additives Market Size, By Application, 2017�2024 (USD Thousand)
Table 66 Middle East & Africa: Fluid Loss Additives Market Size, By Type, 2017�2024 (Ton)
Table 67 Middle East & Africa: Fluid Loss Additives Market Size, By Type, 2017�2024 (USD Thousand)
Table 68 Saudi Arabia: Fluid Loss Additives Market Size, By Application, 2017�2024 (Ton)
Table 69 Saudi Arabia: Fluid Loss Additives Market Size, By Application, 2017�2024 (USD Thousand)
Table 70 UAE: Fluid Loss Additives Market Size, By Application, 2017�2024 (Ton)
Table 71 UAE: Fluid Loss Additives Market Size, By Application, 2017�2024 (USD Thousand)
Table 72 Iran: Fluid Loss Additives Market Size, By Application, 2017�2024 (Ton)
Table 73 Iran: Fluid Loss Additives Market Size, By Application, 2017�2024 (USD Thousand)
Table 74 South America: Fluid Loss Additives Market Size, By Country, 2017�2024 (Ton)
Table 75 South America: Fluid Loss Additives Market Size, By Country, 2017�2024 (USD Thousand)
Table 76 South America: Fluid Loss Additives Market Size, By Application, 2017�2024 (Ton)
Table 77 South America: Fluid Loss Additives Market Size, By Application, 2017�2024 (USD Thousand)
Table 78 South America: Fluid Loss Additives Market Size, By Type, 2017�2024 (Ton)
Table 79 South America: Fluid Loss Additives Market Size, By Type, 2017�2024 (USD Thousand)
Table 80 Brazil: Fluid Loss Additives Market Size, By Application, 2017�2024 (Ton)
Table 81 Brazil: Fluid Loss Additives Market Size, By Application, 2017�2024 (USD Thousand)
Table 82 Venezuela: Fluid Loss Additives Market Size, By Application, 2017�2024 (Ton)
Table 83 Venezuela: Fluid Loss Additives Market Size, By Application, 2017�2024 (USD Thousand)
Table 84 Colombia: Fluid Loss Additives Market Size, By Application, 2017�2024 (Ton)
Table 85 Colombia: Fluid Loss Additives Market Size, By Application, 2017�2024 (USD Thousand)
List of Figures (41 Figures)
Figure 1 Fluid Loss Additives Market Segmentation
Figure 2 Fluid Loss Additives Market: Research Design
Figure 3 Fluid Loss Additives Market: Data Triangulation
Figure 4 Synthetically Modified Natural Type to Be the Largest Segment of Fluid Loss Additives Market
Figure 5 Drilling Fluid to Be the Faster-Growing Application of Fluid Loss Additives
Figure 6 North America Accounted for the Largest Share of Fluid Loss Additives Market in 2018
Figure 7 High Growth Expected in Developing Economies During the Forecast Period
Figure 8 North America to Be the Largest Fluid Loss Additives Market During the Forecast Period
Figure 9 The US Accounted for the Largest Share of the North American Fluid Loss Additives Market in 2018
Figure 10 Drilling Fluid Segment to Account for the Larger Market Share
Figure 11 India to Drive the Fluid Loss Additives Market in APAC During the Forecast Period
Figure 12 Synthetically Modified Natural Was the Largest Type of Fluid Loss Additives in 2018
Figure 13 Drivers, Restraints, and Opportunities in the Fluid Loss Additives Market
Figure 14 Crude Oil Production, 2013�2018 (Million Ton)
Figure 15 Fluid Loss Additives Market: Porter�s Five Forces Analysis
Figure 16 Synthetically Modified Natural to Be the Largest Fluid Loss Additives Segment During the Forecast Period
Figure 17 North America to Be the Largest Synthetically Modified Natural Fluid Loss Additives Market
Figure 18 North America to Be the Largest Synthetic Fluid Loss Additives Market During the Forecast Period
Figure 19 North America to Be the Largest Natural Fluid Loss Additives Market During the Forecast Period
Figure 20 Drilling Fluid to Lead the Fluid Loss Additives Market During the Forecast Period
Figure 21 North America to Be the Largest Fluid Loss Additives Market in the Drilling Fluid Application
Figure 22 North America to Be the Largest Fluid Loss Additives Market for the Cement Slurry Application During the Forecast Period
Figure 23 APAC to Be the Fastest-Growing Fluid Loss Additives Market
Figure 24 North America: Fluid Loss Additives Market Snapshot
Figure 25 APAC: Fluid Loss Additives Market Snapshot
Figure 26 Europe: Fluid Loss Additives Market Snapshot
Figure 27 Fluid Loss Additives Market Competitive Leadership Mapping, 2018
Figure 28 Fluid Loss Additives Market (Small and Medium-Sized Enterprises) Competitive Leadership Mapping, 2018
Figure 29 Fluid Loss Additives Market Share, By Company, 2018
Figure 30 Schlumberger Limited: Company Snapshot
Figure 31 Schlumberger Limited: SWOT Analysis
Figure 32 BASF SE: Company Snapshot
Figure 33 BASF SE: SWOT Analysis
Figure 34 Halliburton: Company Snapshot
Figure 35 Halliburton: SWOT Analysis
Figure 36 Newpark Resources Inc.: Company Snapshot
Figure 37 Newpark Resources Inc.: SWOT Analysis
Figure 38 Kemira OYJ: Company Snapshot
Figure 39 Kemira OYJ: SWOT Analysis
Figure 40 Clariant: Company Snapshot
Figure 41 Solvay: Company Snapshot
The study involved four major activities in estimating the market size for fluid loss additives. Exhaustive secondary research was done to collect information on the market, the peer market, and the parent market. The next step was to validate these findings, assumptions, and sizing with industry experts across the value chain through primary research. Both top-down and bottom-up approaches were employed to estimate the complete market size. Post that, the market breakdown and data triangulation procedures were used to estimate the market size of the segments and subsegments.
Secondary Research
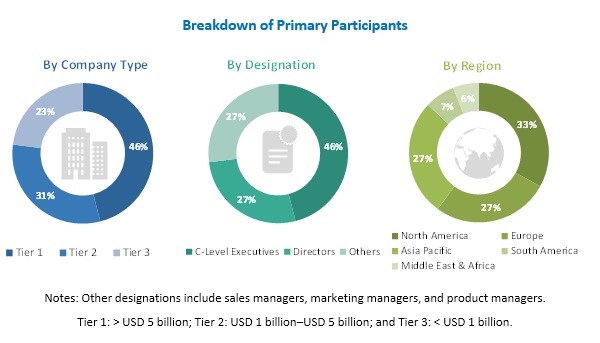
Secondary sources used in this study included annual reports, press releases, and investor presentations of companies; white papers; certified publications; articles from recognized authors; and gold standard & silver standard websites such as Factiva, ICIS, Bloomberg, and others. Findings of this study were verified through primary research by conducting extensive interviews with key officials such as CEOs, VPs, directors, and other executives. The breakdown of profiles of the primary interviewees is illustrated in the figure below:
Primary Research
The fluid loss additives market comprises several stakeholders, such as raw material suppliers, end-product manufacturers, and regulatory organizations in the supply chain. The demand side of this market is characterized by the development of the oil & gas industry. The supply side is characterized by advancements in technology and diverse application industries. Various primary sources from both the supply and demand sides of the market were interviewed to obtain qualitative and quantitative information.
To know about the assumptions considered for the study, download the pdf brochure
Market Size Estimation
Both top-down and bottom-up approaches were used to estimate and validate the total size of the fluid loss additives market. These methods were also used extensively to estimate the size of various subsegments in the market. The research methodology used to estimate the market size includes the following:
The key players in the industry were identified through extensive secondary research.
- The industry�s supply chain and market size, in terms of value, were determined through primary and secondary research processes.
- All percentage shares, splits, and breakdowns were determined using secondary sources and verified through primary sources.
Data Triangulation
After arriving at the overall market size�using the market size estimation processes as explained above�the market was split into several segments and subsegments. To complete the overall market engineering process and arrive at the exact statistics of each market segment and subsegment, the data triangulation, and market breakdown procedures were employed, wherever applicable. The data was triangulated by studying various factors and trends from both the demand and supply sides in the oil & gas industry.
Report Objectives
- To analyze and forecast the size of the fluid loss additives market in terms of value and volume
- To provide detailed information regarding key factors, such as drivers, restraints, and opportunities influencing the growth of the market
- To define, describe, and segment the fluid loss additives market based on type, and application
- To forecast the size of the market segments for regions such as APAC, North America, Europe, South America, and the Middle East & Africa
- To strategically analyze the segmented markets with respect to individual growth trends, prospects, and contribution to the overall market
- To identify and analyze opportunities for stakeholders in the market
- To strategically profile key players and comprehensively analyze their core competencies
Available Customizations
Along with the given market data, MarketsandMarkets offers customizations according to the company�s specific needs. The following customization options are available for the report:
Regional Analysis
- Further breakdown of a region with respect to a particular country or additional type
Company Information
- Detailed analysis and profiles of additional market players (up to five)


Growth opportunities and latent adjacency in Fluid Loss Additives Market