
Specialty Oilfield Chemicals Market

Specialty Oilfield Chemicals Market by Type, Reservoir Type, Application (Production, Well Stimulation, Drilling Fluids, Enhanced Oil Recovery, Cementing, and Workover & Completion), and Region � Global Forecast to 2030


SPECIALTY OILFIELD CHEMICALS MARKET
Source: Secondary Research, Interviews with Experts, MarketsandMarkets Analysis | Updated on : March 05, 2026
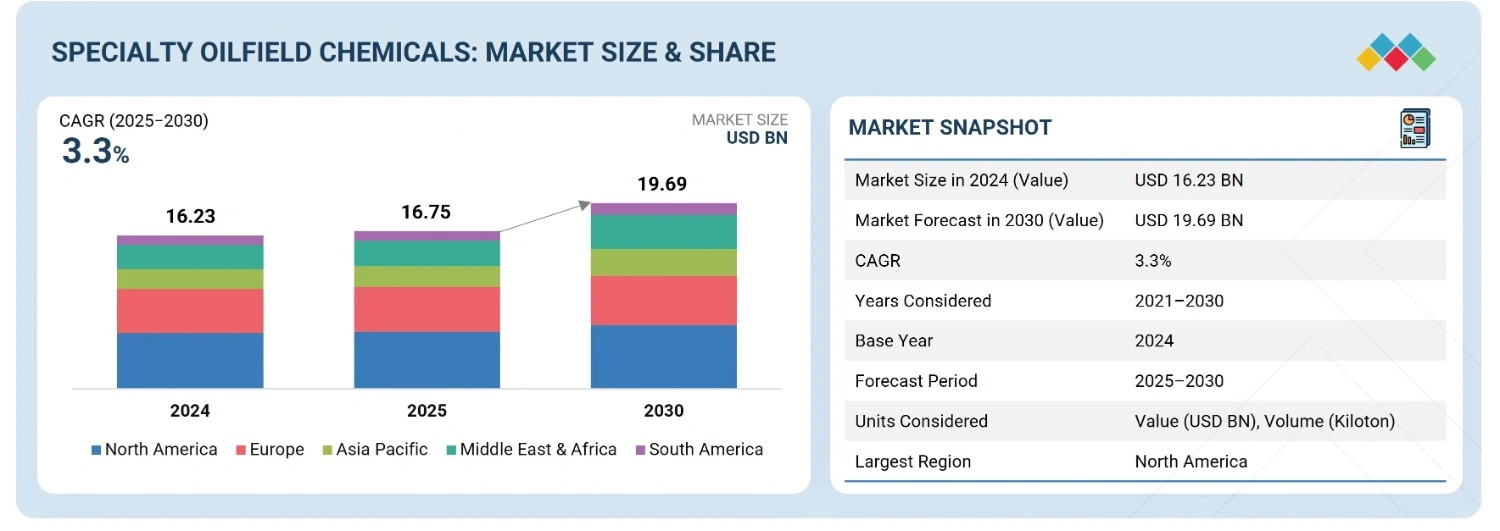
The global specialty oilfield chemicals market was valued at USD 16.75 billion in 2025 and is projected to reach USD 19.69 billion by 2030, growing at 3.3% cagr from 2025 to 2030. This expansion is driven by increased crude oil production, complex reservoirs, and operational efficiency efforts. Global crude oil output rose from 68.2 mb/d in 2020 to 72.6 mb/d in 2024 (Source: OPEC), with the US reaching 13.2 mb/d in 2024, mostly from the Permian Basin, using hydraulic fracturing and horizontal drilling. As exploration moves into unconventional, complex formations, the demand for specialty chemicals like demulsifiers, corrosion inhibitors, and EOR additives grows. Regulations from API, EPA, and OSHA promote sustainable, high-performance chemical technologies, supporting sector growth.
KEY TAKEAWAYS
-
BY MATERIALThe specialty oilfield chemicals market categorization based on type includes demulsifiers, inhibitors & scavengers, rheology modifiers, friction reducers, specialty biocides, specialty surfactants, pour point depressants, and others. Each serves specific functions in maintaining well integrity, flow assurance, and production efficiency.
-
BY RESERVOIR TYPEBased on reservoir type, the market is segmented into onshore reservoirs and offshore reservoirs. Onshore reservoirs dominate due to easier access and lower operational costs, while offshore reservoirs are witnessing increasing chemical demand driven by deepwater and ultra-deepwater projects requiring specialized solutions for challenging conditions.
-
BY APPLICATIONKey applications include production, well stimulation, drilling fluids, enhanced oil recovery, cementing, and workover & completion. The production application dominated the specialty oilfield chemicals market in 2024.
-
BY REGIONThe Middle East & Africa region is expected to show the fastest growth due to rising upstream investments, large-scale field developments, enhanced recovery initiatives, and supportive regulatory and strategic frameworks across key oil-producing nations.
-
COMPETITIVE LANDSCAPEMajor players employ inorganic and organic growth methods, including collaborations, acquisitions, and geographic expansions. BASF, Clariant, Dow, Syensqo, SLB, Halliburton, and Baker Hughes Company are investing in innovation to meet the increasing demand for effective and compliant specialty oilfield chemicals.
The specialty oilfield chemicals market is forecasted to expand in the coming years. Rising upstream oil and gas activities, changes in recovery strategies, and the demand for efficient and dependable chemical solutions contribute to this growth. High-performance chemicals, known for providing flow assurance, preventing corrosion and scaling, and enhancing production, are used across drilling, well stimulation, and enhanced oil recovery operations. Their effectiveness and adaptability are crucial for maintaining well integrity, maximizing hydrocarbon recovery, and ensuring safe, cost-effective processes. Although the use of specialty chemicals might be seen as an expense, they remain essential for sustaining long-term performance and supporting injection in both new and mature oilfields.
SPECIALTY OILFIELD CHEMICALS MARKET TRENDS & DISRUPTIONS IMPACTING CUSTOMERS' CUSTOMERS
Demand from customers in the specialty oilfield chemicals sector depends on upstream oil and gas activities, crude oil prices, and compliance with regulations. Key end users include National Oil Companies (NOCs), International Oil Companies (IOCs), and independent firms involved in drilling, production, stimulation, and enhanced oil recovery (EOR). The growing focus on sustainability, low-toxicity solutions, and advanced technology greatly impacts market demand, making providers' revenues and strategies more reliant on industry cycles and innovation.

Source: Secondary Research, Interviews with Experts, MarketsandMarkets Analysis
SPECIALTY OILFIELD CHEMICALS MARKET DYNAMICS
Level
-
Rising global crude oil production boosts demand

-
Expansion of Enhanced Oil Recovery (EOR) techniques

Level
-
Fluctuating crude oil prices

-
Global supply chain disruptions

Level
-
Rising oilfield explorations in emerging regions

-
Growing aging oil reservoirs

Level
-
Stringent environmental regulations and sustainability pressures

-
Operational complexity in extreme environments limits chemical performance

Source: Secondary Research, Interviews with Experts, MarketsandMarkets Analysis
Driver: Rising global crude oil production boosts demand
The specialty oilfield chemicals market is driven by rising global crude production and enhanced complexity in exploration and production activities. Advanced chemical solutions are essential for unconventional reserves and difficult formations, providing flow assurance, corrosion mitigation, scale inhibition, and improved oil recovery (EOR). In 2024, U.S. petroleum production reached a record 13.2 million barrels per day, with the Permian Basin accounting for over 48% through horizontal drilling and hydraulic fracturing, methods that are significantly dependent on specialty chemicals. Non-OPEC+ countries, including the U.S., Brazil, Canada, and Guyana, are anticipated to increase production by 2.9 million barrels per day by 2026. Regulatory agencies such as the EPA and API stimulate demand by imposing performance and environmental criteria.
Restraint: Fluctuating crude oil prices
The specialty oilfield chemicals market is suffering from fluctuations in the price of crude oil. These fluctuations have a direct effect on the amount of money that is invested in the upstream sector. If prices are low, the budgets for the necessary chemicals will be cut. These chemicals are used for drilling, stimulation, and production. Last WTI crude oil averaged USD 76.60 per barrel in 2024, but the prices are expected to fall to USD 61.81 in 2025 and to USD 59–56 by the end of 2026, which is quite close to the break-even point in the Midland and Delaware basins. When there are very small profit margins, the spending is done cautiously, and the exploration is postponed. This is especially true for the capital-intensive processes that require high-performance chemicals. Nevertheless, the demand for energy will still be very strong in the long run. However, the market growth can be impeded mainly by short-term price fluctuations because of their limitations on investments in the upstream chemical sector.
Opportunity: Rising oilfield explorations in emerging regions
The exploration and development of new oilfields in the Asia Pacific, Africa, and South America are creating opportunities for the market. Many mature fields are almost full, so countries are looking for unknown reserves. These reserves are often in difficult geological and environmental conditions that need high-tech chemical solutions for drilling, cementing, stimulating, and producing. According to OPEC, India's reserves increased to 5.0 billion barrels, while Latin America's reserves increased from 330.72 billion in 2020 to 344.88 billion in 2024. Notable discoveries in South Africa, Australia, and Venezuela have propelled extensive well expansion. Operators in these emerging sectors require specialized chemicals to optimize recovery, mitigate operational hazards, and comply with environmental regulations, generating a significant market opportunity.
Challenge: Stringent environmental regulations and sustainability pressures
Increasing environmental laws pose hurdles for the specialty oilfield chemicals market, as the chemicals used for drilling and production, especially for offshore and deepwater operations, can harm terrestrial and marine ecosystems. Global regulatory authorities are implementing stringent chemical formulation, discharge, and utilization regulations. The ECHA oversees chemical regulation in Europe under REACH, while the UK enforces the Offshore Chemical Notification Scheme (OCNS). The EPA regulates discharges in the U.S. through the Clean Water Act and requires the disclosure of hydraulic fracturing chemicals under TSCA. These challenges compel manufacturers to pursue high-performance, environmentally sustainable solutions. However, the creation of sustainable chemicals capable of enduring severe pressures, temperatures, and corrosive conditions remains technically intricate and expensive, hindering the pace of discovery and commercialization.
Specialty Oilfield Chemicals Market: COMMERCIAL USE CASES ACROSS INDUSTRIES
| COMPANY | USE CASE DESCRIPTION | BENEFITS |
|---|---|---|
 |
A gas plant in Egypt faced severe corrosion due to high levels of CO2 and H2S at temperatures up to 500 °F. Previous inhibitors degraded under extreme conditions, failing to maintain corrosion rates of 0.1 mm/year. Arkema evaluated multiple formulations and selected NORUST 9 M 50 FR for its thermal stability, corrosion control under 4 MPY, and film persistence. | NORUST 9 M 50 FR provided reliable corrosion control under extreme temperatures, maintained asset protection, reduced localized corrosion, and ensured long-term chemical stability for continued operational efficiency and safety in the water injection oilfield. |
 |
In the Denver-Julesburg Basin, paraffin deposition was a major operational challenge across gas lift, rod pump, and plunger lift systems. The existing solution of continuous PARA10116A injection and monthly thermal remediation only partially controlled deposits, with high costs and production losses due to well shut-ins. Nalco Champion developed a next-generation winterized paraffin inhibitor tailored for cold climates and high paraffin loads, tested for performance at temperatures as low as -40°F. | The new inhibitor significantly reduced paraffin-related downtime, minimized thermal remediation frequency, maintained steady production, improved well uptime, and lowered operational costs, delivering a more efficient and climate-resilient flow assurance solution. |
 |
A major oilfield in Gujarat experienced severe scaling issues, causing frequent shutdowns and maintenance. ICPL provided a customized phosphonate-based scale inhibitor specifically formulated for calcium carbonate scale prevalent in the field’s water system. | The scale inhibitor significantly reduced scale deposits, increased operational uptime, lowered maintenance costs, and improved overall production efficiency, ensuring long-term protection against scale formation in critical oilfield equipment. |
Logos and trademarks shown above are the property of their respective owners. Their use here is for informational and illustrative purposes only.
SPECIALTY OILFIELD CHEMICALS MARKET ECOSYSTEM
The specialty oilfield chemicals market ecosystem includes raw material suppliers, specialty oilfield chemical manufacturers, distributors, and end users. Raw material suppliers offer essential base chemicals. Specialty oilfield chemical manufacturers produce oilfield chemicals of different types to meet the needs of numerous end-use industries without compromising regulatory requirements. Distributors bring market access through a proper supply chain. The upstream oil and gas industry employs specialty oilfield chemicals for applications requiring enhanced well productivity, flow assurance, corrosion protection, scale prevention, and reservoir stimulation under extreme pressure, temperature, and chemically aggressive conditions.

Logos and trademarks shown above are the property of their respective owners. Their use here is for informational and illustrative purposes only.
SPECIALTY OILFIELD CHEMICALS MARKET OUTLOOK & FORECAST (MARKET SEGMENTS)

Source: Secondary Research, Interviews with Experts, MarketsandMarkets Analysis
Specialty Oilfield Chemicals Market, By Type
In 2024, pour point depressants held the largest share of the specialty oilfield chemicals market due to their key role in ensuring crude flow in low-temperature conditions. These chemicals prevent wax crystal formation, avoiding pipeline blockages and enabling efficient oil transport, especially in cold and offshore regions. Their use is critical in high-wax, high-viscosity crude areas such as Russia, Canada, and parts of the Middle East. Increasing production from deepwater and arctic fields and rising demand for reliable flow assurance continue to drive their market dominance.
Specialty Oilfield Chemicals Market, By Application
In 2024, the production segment led the specialty oilfield chemicals market due to increasing operational complexity and the need for efficient extraction. Protecting infrastructure and enhancing oil and gas yields require demulsifiers, scale, and corrosion inhibitors. Rising production in traditional and modern reservoirs is driven by growing energy demand, especially from the industrial and power sectors. The continued growth from this segment is based on the development of improved chemical formulations to meet the challenges of current operations and to adhere to environmental regulations in the pursuit of safe and cost-effective oil development.
REGION
Middle East & Africa to be the fastest-growing region in the global specialty oilfield chemicals market during the forecast period
The MEA region is expected to show the most significant growth in the specialty oilfield chemicals market, led by increasing oil and gas exploration, upstream investments, and efforts to optimize hydrocarbon recovery. Substantial efforts, such as Saudi Aramco’s Jafurah shale and ADNOC’s enhanced oil recovery programs, are enhancing production, needing specialist chemicals, including corrosion inhibitors, demulsifiers, and surfactants. Strategic initiatives such as Saudi Arabia’s Vision 2030 and the UAE’s Operation 300bn strengthen domestic chemical manufacturing and minimize import dependence. Furthermore, collaborations with African producers and enhanced regulatory frameworks establish advantageous circumstances for offshore and deepwater activities, placing MEA as a significant rising market.

Specialty Oilfield Chemicals Market: COMPANY EVALUATION MATRIX
SLB (Star) is at the top of the global specialty oilfield chemicals market with comprehensive and continuous innovation that has attracted and maintained its global presence, a wide range of products, and technological solutions across drilling, production, stimulation, and EOR. Chevron Phillips Chemical Company LLC (Emerging Leader) is making great progress with its creative and low-cost solutions, mainly in production and stimulation, moving into the leader’s technological expertise and market influence quadrant.

Source: Secondary Research, Interviews with Experts, MarketsandMarkets Analysis
KEY MARKET PLAYERS
MARKET SCOPE
| REPORT METRIC | DETAILS |
|---|---|
| Market Size in 2024 (Value) | USD 16.23 BILLION |
| Market Forecast in 2030 (Value) | USD 19.69 BILION |
| Growth Rate | CAGR of 3.3% from 2025-2030 |
| Years Considered | 2021-2030 |
| Base Year | 2024 |
| Forecast Period | 2025-2030 |
| Units Considered | Value (USD Billion), Volume (Kiloton) |
| Report Coverage | Revenue forecast, company ranking, competitive landscape, growth factors, and trends |
| Segments Covered | Type: Demulsifiers, Inhibitors & Scavengers, Rheology Modifiers, Friction Reducers, Specialty Biocides, Specialty Surfactants, Pour Point Depressants, and Other types Reservoir Type: Onshore Reservoirs and Offshore Reservoirs Application: Production, Drilling Fluids, Well Stimulation, Enhanced Oil Recovery, Cementing, and Workover & Completion |
| Regions Covered | North America, Europe, Asia Pacific, Middle East & Africa, and South America |
WHAT IS IN IT FOR YOU: Specialty Oilfield Chemicals Market REPORT CONTENT GUIDE

DELIVERED CUSTOMIZATIONS
We have successfully delivered the following deep-dive customizations:
| CLIENT REQUEST | CUSTOMIZATION DELIVERED | VALUE ADDS |
|---|---|---|
| U.S.-based Specialty Oilfield Chemical Manufacturer |
|
|
| Specialty Surfactant Manufacturer |
|
|
| Inhibitors & Scavengers Manufacturers |
|
|
RECENT DEVELOPMENTS
- July 2025 : SLB acquired ChampionX to enhance its capabilities in production chemicals, artificial lift, and digital technologies.
- May 2024 : SLB announced a strategic alliance with NNPC Energy Services Limited (EnServ), a subsidiary of Nigeria's national oil company, to enhance service delivery across the Nigerian oil and gas sector.
- May 2024 : BASF is expanding its production capacity for the Basoflux range of paraffin inhibitors at its Tarragona, Spain site to meet growing global demand.
- May 2024 : Dow partnered with the State of Wyoming and the University of Wyoming to launch the Wyoming Gas Injection Initiative (WGII), a five-year program aimed at enhancing oil recovery and reducing greenhouse gas emissions.
- February 2024 : Baker Hughes inaugurated the Saudi Petrolite Chemicals facility in Jubail, Saudi Arabia.
Table of Contents
 Exclusive indicates content/data unique to MarketsandMarkets and not available with any competitors.
Methodology
The study involved four major activities to estimate the current size of the global specialty oilfield chemicals market. Exhaustive secondary research was carried out to collect information on the market, the peer product market, and the parent product group market. The next step was to validate these findings, assumptions, and sizes with the industry experts across the value chain of specialty oilfield chemicals through primary research. The top-down and bottom-up approaches were employed to estimate the overall size of the specialty oilfield chemicals market. After that, market breakdown and data triangulation procedures were used to determine the size of different segments and subsegments of the market.
Secondary Research
The market for the companies offering specialty oilfield chemicals is arrived at by secondary data available through paid and unpaid sources, analyzing the product portfolios of the major companies in the ecosystem, and rating the companies by their performance and quality. Various secondary sources, such as Business Standard, Bloomberg, World Bank, and Factiva, were referred to identify and collect information for this study on the specialty oilfield chemicals market. In the secondary research process, various secondary sources were referred to identify and collect information related to the study. Secondary sources included annual reports, press releases, investor presentations of vendors, forums, certified publications, and white papers. The secondary research was used to obtain critical information on the industry’s value chain, the total pool of key players, market classification, and segmentation from the market and technology-oriented perspectives.
Primary Research
In the primary research process, various primary sources from both the supply and demand sides were interviewed to obtain qualitative and quantitative information for this report. The primary sources from the supply side included industry experts, such as chief executive officers (CEOs), vice presidents (VPs), marketing directors, technology and innovation directors, and related key executives from several key companies and organizations operating in the specialty oilfield chemicals market. After the complete market engineering (calculations for market statistics, market breakdown, market size estimations, market forecasting, and data triangulation), extensive primary research was conducted to gather information and verify and validate the critical numbers arrived at. Primary research was also conducted to identify the segmentation types, industry trends, competitive landscape of specialty oilfield chemicals offered by various market players, and key market dynamics, such as drivers, restraints, opportunities, challenges, industry trends, and key player strategies. In the complete market engineering process, the top-down and bottom-up approaches and several data triangulation methods were extensively used to perform the market estimation and market forecasting for the overall market segments and subsegments listed in this report. Extensive qualitative and quantitative analysis was performed on the complete market engineering process to list the key information/insights throughout the report.
The following is the breakdown of primary respondents:

Notes: Other designations include sales, marketing, and product managers.
Tier 1: >USD 1 billion; Tier 2: USD 500 million–USD 1 billion; and Tier 3: < USD 500 million.
To know about the assumptions considered for the study, download the pdf brochure
Market Size Estimation
The top-down and bottom-up approaches were used to estimate and validate the size of the global specialty oilfield chemicals market. These approaches were also used extensively to estimate the size of various dependent market segments. The research methodology used to estimate the market size included the following:

Data Triangulation
After arriving at the overall market size using the market size estimation processes, the market was split into several segments and subsegments. The data triangulation and market breakup procedures were employed, wherever applicable, to complete the overall market engineering process and arrive at the exact statistics of each market segment and subsegment. The data was triangulated by studying various factors and trends from both the demand and supply sides.
Market Definition
Specialty oilfield chemicals, also known as performance chemicals, are specially engineered formulations used throughout the upstream oil and gas lifecycle, from drilling and cementing to well stimulation, production, and enhanced oil recovery. These chemicals are critical for improving productivity, enhancing equipment reliability, and ensuring safe, efficient extraction of hydrocarbons. Their usage is tailored to well-specific requirements and environmental conditions, providing unique functionalities such as corrosion inhibition, scale prevention, emulsion separation, microbial control, and flow assurance. They are essential to operations involving well drilling, completion, and intervention or stimulation activities, including advanced techniques like hydraulic fracturing.
Organizations such as the Society of Petroleum Engineers (SPE) and the American Petroleum Institute (API) identify specialty oilfield chemicals as demulsifiers, along with biocides, inhibitors, surfactants, friction reducers, and cementing additives. The assessment of these compounds follows worldwide standards, which incorporate API RP 65 together with ISO 13503 and OSHA’s Hazard Communication requirements.
Stakeholders
- Specialty Oilfield Chemical Manufacturers
- Raw Material Suppliers
- Distributors and Traders
- Industry Associations and Regulatory Bodies
- End Users
Report Objectives
- To define, describe, and forecast the size of the specialty oilfield chemicals market, based on type, reservoir type, application, and region, in terms of value and volume
- To provide detailed information on the significant drivers, restraints, opportunities, and challenges influencing the market
- To strategically analyze micromarkets concerning individual growth trends, prospects, and their contribution to the market
- To assess the growth opportunities in the market for stakeholders and provide details on the competitive landscape for market leaders
- To forecast the market size of segments and subsegments for North America, Europe, Asia Pacific, South America, and the Middle East & Africa
- To strategically profile key players and comprehensively analyze their market shares and core competencies
- To analyze competitive developments such as acquisitions, product launches, expansions, partnerships, and agreements in the specialty oilfield chemicals market
- To provide the impact of AI/Gen AI on the market
Key Questions Addressed by the Report
Which factors are propelling the growth of the specialty oilfield chemicals market?
Rising global crude oil production, expansion of enhanced oil recovery (EOR) techniques, and technological progress in oilfield operations are the primary drivers of market growth.
What are the major challenges to the growth of the specialty oilfield chemicals market?
Stringent environmental regulations, sustainability pressures, and operational complexity in extreme environments are key challenges impacting market growth.
What are the major opportunities in the specialty oilfield chemicals market?
Rising oilfield explorations in emerging regions and growing aging oil reservoirs are expected to create lucrative opportunities for market players.
What are the major factors restraining the growth of the specialty oilfield chemicals market?
Fluctuating crude oil prices and global supply chain disruptions are major restraining factors.
Who are the major players in the specialty oilfield chemicals market?
Major players include BASF (Germany), Clariant (Switzerland), Dow (US), Syensqo (Belgium), SLB (US), Halliburton (US), and Baker Hughes Company (US).
Need a Tailored Report?
Customize this report to your needs
Get 10% FREE Customization
Customize This ReportPersonalize This Research
- Triangulate with your Own Data
- Get Data as per your Format and Definition
- Gain a Deeper Dive on a Specific Application, Geography, Customer or Competitor
- Any level of Personalization
Let Us Help You
- What are the Known and Unknown Adjacencies Impacting the Specialty Oilfield Chemicals Market
- What will your New Revenue Sources be?
- Who will be your Top Customer; what will make them switch?
- Defend your Market Share or Win Competitors
- Get a Scorecard for Target Partners

Custom Market Research Services
We Will Customise The Research For You, In Case The Report Listed Above Does Not Meet With Your Requirements
Get 10% Free CustomisationTESTIMONIALS

We at Nissan Chemicals Corporation have been clients of MarketsandMarkets for more than a year now. We recently consulted MarketsandMarkets for a study, the team at MarketsandMarkets was extremely professional and organized. The business insights were very detailed and aligned well with our expectations that really helped us formulate the Business Plans and device new strategies for development themes. MarketsandMarkets offers a unique combination of expertise and dedicated engagement model. Their research findings have helped us in designing our Pricing Strategy which will make it easier for us to predict the future sales and profits for the next ten years. We look forward to working with MarketsandMarkets in the future.
VP of Strategy & New Business Development
Leading Specialty Chemical Company
The MarketsandMarkets Engagement Model, composed of both the Knowledge Store and advisory custom research, has greatly helped us in understanding our markets and making strategic decisions. The Knowledge Store is a fast way to allow everyone in our organization to understand more about most any market they are interested in. The ability to then get custom research done and get answers to specific strategic questions and market insight has been spectacular. The Markets and Markets team feel more like colleagues than vendors and their services have helped us change our culture where statements of things like growth opportunities and competitive position are always backed by industry research.

Rich Gibson,
Director, Corporate Strategy
Milliken & Company,
Leading Industrial Manufacturer of specialty chemical, floor covering, performance and protective textile materials, and healthcaremilliken.com
MarketsandMarkets is a trusted resource that helps us to better understand markets that are near-adjacencies-whether its technology, value chain or geography. Their Knowledge Store platform provides a dashboard of markets and their characteristics which is easy to use and saves us time.
Adam Shaw,
Market Development and Strategy Manager
AdvanSix Inc. USA,
An American Leader in Chemicalswww.advansix.com
The Knowledge Store from MarketsandMarkets is a valuable tool which has helped my team acquire greater insight in to the end markets that our business serves. This has enabled us to help our company build stronger strategies throughout our planning process.
TOSHIO KINOSHITA
Senior Chif Consultion Research & Consulting Division
Mitsubishi Chemical Research Corporation,
Leading Manufacturer of Chemical Productswww.mitsubishichem-res.co.jp/en/

We recently engaged with MarketsandMarkets for a study, the team not only clearly understood our business objectives but was also extremely professional in the way they handled the entire project. The study was efficiently conducted in a phase-wise manner, and the engagement model furnished us with high-quality business insights that far exceeded our expectations at each phase. We were especially happy that MarketsandMarkets could provide us with both, an English as well as a Japanese version of the study. A special thanks to the Analyst Team and Client Services Team, whose fluency in Japanese enhanced our comfort level, as we could converse with them in our preferred language.
Independent entrepreneurs
Arrow Precision
We approached MarketsandMarkets for study on Proppants Market, and their work exceeded our expectations. The study conducted was comprehensive and enabled us to view the market through the various dimensions. In addition, the team was extraordinarily responsive throughout the process and resolved our queries on time. I strongly recommend MarketsandMarkets and will certainly consider them for additional market assessments we will need in the future.
Global engineering company, Japan
Deputy Manager,
Strategic Planning OfficeThe high-quality insights shared by the MarketsandMarkets team helped us understand the pharmaceutical plant designers in a specific geography. It also captured the risks that we may likely face in communicating with our potential partners. The study would enable us identify partners, which would impact our future growth.
Growth opportunities and latent adjacency in Specialty Oilfield Chemicals Market


Ana
May, 2015
Interested in Specialty Oifield Chemicals Market.
Joyce
Nov, 2018
General information on specialty oilfield chemicals.
Shantanu
Mar, 2015
Interested in report sections: Demulsifier Used in Oilfield, Demulsifiers Market Size, By Region, 2012-2019 only.
Didier
Mar, 2015
Information on Oilfield prodcution additives.
Moin
Nov, 2018
Oil and gas upstream, downstream and water treatment (including desalination) for MEQuery not Clear region.
rached
Feb, 2014
Requires a sample of Oilfield Chemicals report.
frank
Oct, 2015
Production chemical market and Market size of Production chemical testing services.
James
Sep, 2014
Information on EOR market.
Cliff
Sep, 2014
Data and segmentation needed specifically for Canada market from Production Chemicals Market report.
Jorge
Apr, 2019
speciality chemicals outlook for the next 3 years to present my business plan to a bank for a business credit line..
Ashish
Feb, 2014
Interested in reports on organophosphonate and related polymers.
Ashish
Feb, 2014
Interested in cusotmoised report .
Bernardo
Feb, 2014
Multiple reports around Corrosion & Scale Inhibitors, Biocides, Demulsifiers, Pour Point Depressants, Surfactants, Advanced Polymers, Well Stimulation, Production Chemicals, EOR.
Irina
Jan, 2014
General information on mineral markets by types.
Irina
Jan, 2014
market size and value chain of calcium carbonate, bentonite, barite, organoclay, micas, etc..