Fractional Flow Reserve Market by Technology (Invasive Monitoring, Non-invasive Monitoring), Invasive Monitoring Product (Pressure Guidewires, FFR Measurement Systems), Application, and Region - Global Forecasts to 2024
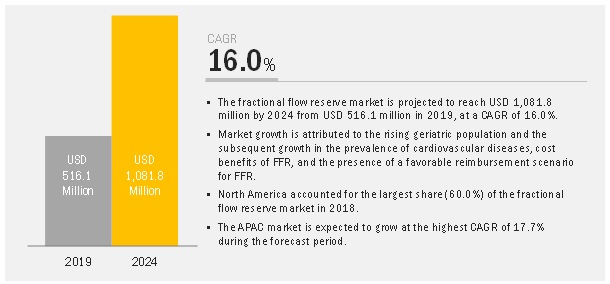
The fractional flow reserve market is projected to reach USD 1,082 million by 2024, at a CAGR of 16.0%. Growth in this market is primarily attributed to the rising geriatric population and the subsequent increase in the prevalence of cardiovascular diseases, cost benefits of FFR, and the presence of a favorable reimbursement scenario for FFR.
Fractional flow reserve is a measurement for the evaluation of the functional significance of stenosis in the epicardial coronary artery. Fractional flow reserve (FFR) is calculated by using the distal coronary pressure of the stenosis divided by the aortic pressure during maximal hyperemia. FFR is considered as a gold standard to assess whether particular stenosis is responsible for inducible ischemia.

Fractional Flow Reserve Market Dynamics
Drivers: Rising geriatric population and the subsequent growth in the prevalence of CVD
Over the years, there has been a significant increase in the geriatric population across the globe. According to the UN World Population Ageing Report 2017, the global geriatric population (aged 60 years and above) is expected to reach 2.1 billion by 2050 from 962 million in 2017.
As this population segment is highly susceptible to CVD and other target diseases, the demand for advanced diagnostic and treatment options is expected to increase in the coming years. Changing lifestyle, smoking, hypertension, high blood cholesterol levels, physical inactivity, high BMI, and high blood sugar levels are the leading risk factors for heart disease and stroke. With the rising prevalence of CVD, the number of related diagnostic and treatment procedures is expected to increase significantly across the globe in the coming years. In this scenario, the demand for fractional flow reserve is likely to increase as it provides various benefits, such as assessing if the stenosis is required, which in turn helps in avoiding surgeries (in cases where stenosis is not needed).
Restraints: Reluctance of interventional cardiologists to adopt FFR
Despite the availability of clear evidence about the better clinical outcomes of FFR when compared to angiography, several interventional cardiologists continue to rely on the visual assessment of stenosis severity alone, rather than performing FFR. The potential reasons for this include the logistical efforts needed for performing FFR, concerns regarding possible complications and the uncertainty about the optimal performance and interpretation of FFR measurements (particularly in complex situations, such as multivessel disease, left main stenoses, serial stenosis, or in patients with aortocoronary bypass grafts). Also, though performing FFR is not technically challenging, several relevant procedural aspects have to be taken into account to avoid incorrect measurements or the misinterpretation of results. Owing to these factors, interventional cardiologists are reluctant to adopt FFR, which is expected to restrain market growth in the coming years.
Opportunities: Growth potential in emerging economies
Emerging countries such as India and China are expected to offer potential growth opportunities for players operating in the fractional flow reserve market. More than half of the world’s population resides in India and China, owing to which, these countries are home to a large target patient base. Rapid economic growth and increasing disposable incomes in emerging markets are encouraging patients in these countries to spend on quality healthcare services, thereby helping players in the fractional flow reserve market to expand their presence in these emerging markets. Furthermore, regulatory policies in Asia are considered to be more adaptive and business-friendly due to the presence of less-stringent regulations and data requirements.
Challenges: Technical limitations of invasive FFR
The guidewires that are currently available in the market have certain restrictions in terms of support, drift, and connectivity. Almost all coronary FFR measurements are performed with a 0.014” pressure wire (PW), incorporating a distal electrically-based pressure sensor. The need to provide electrical connections to the sensor near the distal end of the guidewire means that the “wire” is a thin-walled hollow tube. This PW may be challenging to deliver through tortuous vessels and is prone to kink. Moreover, the assessment of diffuse disease or multiple lesions requires the withdrawal of the PW and may lead to the loss of wire position across the stenosis. These limitations of wire-based systems for the measurement of intracoronary pressure may have impeded the adoption of FFR.
By technology, invasive monitoring segment to account for the largest market share during the forecast period
Based on technology, the fractional flow reserve market is segmented into invasive and non-invasive monitoring. The invasive monitoring segment accounted for the largest share of the market in 2018 and will continue to do so during the forecast period. Invasive FFR monitoring is considered the gold standard for determining the hemodynamic impact of coronary lesions. This technology utilizes pressure guidewires and monitoring systems for the measurement of fractional flow reserve. The pressure guidewire measures the flow and pressure of the blood before and after the blockage to produce a ratio.
By application, single-vessel diseases segment will dominate the market during the forecast period
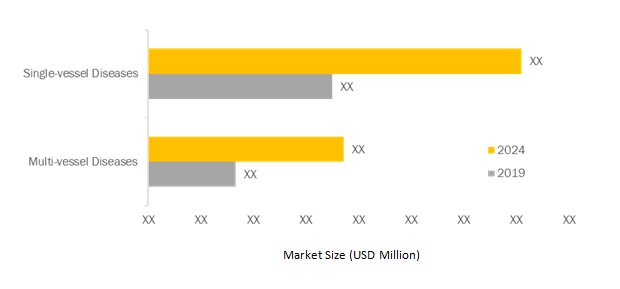
Based on application, the fractional flow reserve market is segmented into single-vessel diseases and multi-vessel diseases. In 2018, the single-vessel disease segment accounted for the larger share of the fractional flow reserve market. The large share of this segment can be attributed to the high prevalence of single-vessel coronary artery disease.

Asia Pacific to register the highest CAGR during the forecast period
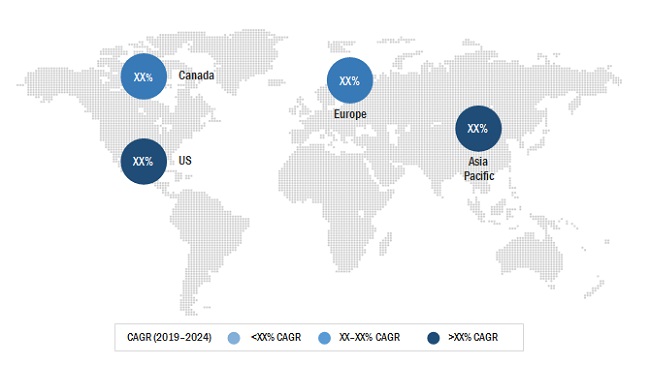
Market growth in the Asia Pacific is mainly driven by the rapid growth in the geriatric population and the increasing prevalence of cardiovascular diseases.

Scope of the Report
|
Report Metric |
Details |
|
Market size available for years |
2017–2024 |
|
Base year considered |
2018 |
|
Forecast period |
2019-2024 |
|
Forecast units |
USD Million (Value) |
|
Segments covered |
Technology, Application, and Region |
|
Geographies covered |
North America, Europe, Asia Pacific, and RoW |
|
Companies covered |
Abbott (US), Boston Scientific (US), ACIST Medical Systems (US), Koninklijke Philips N.V. (Netherlands), Opsens, Inc. (Canada), HeartFlow, Inc. (US), Siemens Healthineers (Germany), Pie Medical Imaging (Netherlands), CathWorks (Israel), and Medis Medical Imaging Systems BV (Netherlands) |
This research report categorizes the fractional flow reserve market based on technology, application, and region.
By Technology:
-
Invasive Monitoring
- Pressure Guidewires
- FFR Measurement Systems
- Non-invasive Monitoring
By Application:
- Single-vessel Diseases
- Multi-vessel Diseases
By Region:
-
North America
- US
- Canada
-
Europe
- Germany
- France
- UK
- Italy
- Spain
- Rest of Europe (RoE)
-
Asia Pacific
- China
- India
- Japan
- Rest of Asia Pacific (RoAPAC)
- Rest of the World
Key Market Players
Abbott (US), Boston Scientific (US), ACIST Medical Systems (US), Koninklijke Philips N.V. (Netherlands), Opsens, Inc. (Canada)
Recent Developments
- In March 2019, the US FDA approved Abbott's Resting Full-cycle Ratio (RFR) intravascular diagnostic test, a new type of fractional flow reserve (FFR)
- In January 2019, Opsens received CE mark certification for its diastolic pressure algorithm (“dPR”) Proprietary Resting Index.
- In March 2018, HeartFlow Inc. entered into a collaborative research agreement with the Imperial College London to work on joint projects in the areas of medical imaging and deep learning.
- In July 2017, Siemens Healthineers and HeartFlow Inc., collaborated to develop integrated, non-invasive care solutions for the improved management of coronary artery disease; the collaboration’s joint solution pairs CT scanners from Siemens Healthineers with the HeartFlow FFRct Analysis.
- In January 2017, Abbott acquired St. Jude Medical, Inc. (US). This acquisition enhanced Abbott’s product portfolio as it gained access to St. Jude Medical’s cardiovascular products.
Key Questions Addressed by the Report
- Which are the key players in the market, and how intense is the competition?
- Emerging countries present immense opportunities for the growth of fractional flow reserve market. Will this situation persist?
- Which product will markets dominate in the future?
- What are the challenges hindering the adoption of fractional flow reserve solutions?
To speak to our analyst for a discussion on the above findings, click Speak to Analyst

Table of Contents
1 Introduction (Page No. - 13)
1.1 Objectives of the Study
1.2 Market Definition
1.3 Market Scope
1.3.1 Markets Covered
1.3.2 Years Considered for the Study
1.4 Currency
1.5 Limitations
1.6 Stakeholders
2 Research Methodology (Page No. - 16)
2.1 Research Data
2.1.1 Secondary Data
2.1.1.1 Key Data From Secondary Sources
2.1.2 Primary Data
2.1.2.1 Key Data From Primary Sources
2.1.2.2 Key Industry Insights
2.2 Market Size Estimation
2.2.1 Market Data Validation and Triangulation
2.3 Assumptions for the Study
3 Executive Summary (Page No. - 25)
4 Premium Insights (Page No. - 28)
4.1 Fractional Flow Reserve: Market Overview
4.2 North America: Fractional Flow Reserve Market, By Technology (2018)
4.3 Fractional Flow Reserve Market: Geographic Growth Opportunities
5 Market Overview (Page No. - 31)
5.1 Introduction
5.2 Market Dynamics
5.2.1 Drivers
5.2.1.1 Rising Geriatric Population and the Subsequent Growth in the Prevalence of CVD
5.2.1.2 Cost Benefit and Favorable Reimbursement Scenario
5.2.2 Restraints
5.2.2.1 Reluctance of Interventional Cardiologists to Adopt FFR
5.2.3 Opportunities
5.2.3.1 Growth Potential in Emerging Economies
5.2.4 Challenges
5.2.4.1 Technical Limitations of Invasive FFR
6 Fractional Flow Reserve Market, By Technology (Page No. - 35)
6.1 Introduction
6.2 Invasive Monitoring
6.2.1 Pressure Guidewires
6.2.1.1 Growth in the Number of Pci Procedures to Drive the Demand for Pressure Guidewires
6.2.2 FFR Measurement Systems
6.2.2.1 Monitoring Systems are Multi-Modal and Offer the Options to Change the Modality Based on the Examination Required
6.3 Non-Invasive Monitoring
6.3.1 No Risk of Procedural Complications and Presence of Clinical Evidence Supporting Its Efficacy are the Major Factors Driving the Demand for Non-Invasive Monitoring
7 Fractional Flow Reserve Market, By Application (Page No. - 41)
7.1 Introduction
7.2 Single-Vessel Diseases
7.2.1 Single-Vessel Diseases Dominate the Market, By Application
7.3 Multi-Vessel Diseases
7.3.1 Superior Outcomes, Product Launches are Driving Growth in the Multi-Vessel Diseases Segment
8 Fractional Flow Reserve Market, By Region (Page No. - 45)
8.1 Introduction
8.2 North America
8.2.1 US
8.2.1.1 US Commands the Largest Share of the North American Market
8.2.2 Canada
8.2.2.1 Rising Incidence and Prevalence of CVD Will Support Market Growth in Canada
8.3 Europe
8.3.1 Germany
8.3.1.1 Germany Dominates the European Market for Fractional Flow Reserve Devices
8.3.2 France
8.3.2.1 Rapid Growth in the Aging Population and Availability of Reimbursement are Key Growth Drivers for the French Market
8.3.3 UK
8.3.3.1 The Rising Number of Percutaneous Coronary Interventions Will Boost Market Growth in the UK
8.3.4 Italy
8.3.4.1 Escalating Costs are Driving Attention Toward Value-Based Healthcare in Italy
8.3.5 Spain
8.3.5.1 Rising Lifestyle Disease Prevalence has Contributed to the Overall Number of CVD Cases in Spain
8.3.6 Rest of Europe
8.4 Asia Pacific
8.4.1 China
8.4.1.1 China’s Large Population Makes It A Key Market for Fractional Flow Reserve Devices
8.4.2 Japan
8.4.2.1 Availability of Health Insurance has Enabled Easy Access to Healthcare
8.4.3 India
8.4.3.1 Growth in the Aging Population and Rising Prevalence of CVD are Driving the Demand for Imaging Technologies in India
8.4.4 Rest of Asia Pacific
8.5 Rest of the World
9 Competitive Landscape (Page No. - 77)
9.1 Introduction
9.2 Market Share Analysis
9.2.1 Abbott Laboratories
9.2.2 Koninklijke Philips N.V.
9.2.3 Boston Scientific Corporation
9.3 Competitive Scenario/Competitive Situation and Trends
9.3.1 Product Launches
9.3.2 Agreements, Collaborations, and Partnerships
9.3.3 Acquisitions
10 Company Profile (Page No. - 81)
(Introduction, Products & Services, Strategy, & Analyst Insights, Developments, MnM View)*
10.1 Abbott
10.2 Koninklijke Philips N.V.
10.3 Boston Scientific Corporation
10.4 Acist Medical Systems (Subsidiary of Bracco Diagnostic Inc)
10.5 Opsens
10.6 Heartflow, Inc.
10.7 Siemens Healthineers
10.8 Pie Medical Imaging
10.9 Cathworks
10.10 Medis Medical Imaging Systems Bv
*Details on Marketsandmarkets View, Introduction, Product & Services, Strategy, & Analyst Insights, New Developments Might Not Be Captured in Case of Unlisted Companies.
11 Appendix (Page No. - 99)
11.1 Discussion Guide
11.2 Knowledge Store: Marketsandmarkets’ Subscription Portal
11.3 Available Customizations
11.4 Related Reports
11.5 Author Details
List of Tables (64 Tables)
Table 1 Fractional Flow Reserve: Market, By Technology, 2017–2024 (USD Million)
Table 2 Invasive Monitoring Market, By Region, 2017–2024 (USD Million)
Table 3 Invasive Monitoring Market, By Product, 2017–2024 (USD Million)
Table 4 Pressure Guidewires Market, By Region, 2017–2024 (USD Million)
Table 5 FFR Measurement Systems Market, By Region, 2017–2024 (USD Million)
Table 6 Non-Invasive Monitoring Market, By Region, 2017–2024 (USD Million)
Table 7 Market, By Application, 2017–2024 (USD Million)
Table 8 Market for Single-Vessel Diseases, By Region, 2017–2024 (USD Million)
Table 9 Market for Multi-Vessel Diseases, By Region, 2017–2024 (USD Million)
Table 10 Market, By Region, 2017–2024 (USD Million)
Table 11 North America: Market, By Country, 2017–2024 (USD Million)
Table 12 North America: Market, By Technology, 2017–2024 (USD Million)
Table 13 North America: Invasive Monitoring Market, By Product, 2017–2024 (USD Million)
Table 14 North America: Market, By Application, 2017–2024 (USD Million)
Table 15 US: Market, By Technology, 2017–2024 (USD Million)
Table 16 US: Invasive Monitoring Market, By Product, 2017–2024 (USD Million)
Table 17 US: Market, By Application, 2017–2024 (USD Million)
Table 18 Canada: Market, By Technology, 2017–2024 (USD Million)
Table 19 Canada: Invasive Monitoring Market, By Product, 2017–2024 (USD Million)
Table 20 Canada: Market, By Application, 2017–2024 (USD Million)
Table 21 Europe: Market, By Country, 2017–2024 (USD Million)
Table 22 Europe: Market, By Technology, 2017–2024 (USD Million)
Table 23 Europe: Invasive Monitoring Market, By Product, 2017–2024 (USD Million)
Table 24 Europe: Market, By Application, 2017–2024 (USD Million)
Table 25 Germany: Market, By Technology, 2017–2024 (USD Million)
Table 26 Germany: Invasive Monitoring Market, By Product, 2017–2024 (USD Million)
Table 27 Germany: Market, By Application, 2017–2024 (USD Million)
Table 28 France: Market, By Technology, 2017–2024 (USD Million)
Table 29 France: Invasive Monitoring Market, By Product, 2017–2024 (USD Million)
Table 30 France: Market, By Application, 2017–2024 (USD Million)
Table 31 UK: Market, By Technology, 2017–2024 (USD Million)
Table 32 UK: Invasive Monitoring Market, By Product, 2017–2024 (USD Million)
Table 33 UK: Market, By Application, 2017–2024 (USD Million)
Table 34 Italy: Market, By Technology, 2017–2024 (USD Million)
Table 35 Italy: Invasive Monitoring Market, By Product, 2017–2024 (USD Million)
Table 36 Italy: Market, By Application, 2017–2024 (USD Million)
Table 37 Spain: Market, By Technology, 2017–2024 (USD Million)
Table 38 Spain: Invasive Monitoring Market, By Product, 2017–2024 (USD Million)
Table 39 Spain: Market, By Application, 2017–2024 (USD Million)
Table 40 RoE: Market, By Technology, 2017–2024 (USD Million)
Table 41 RoE: Invasive Monitoring Market, By Product, 2017–2024 (USD Million)
Table 42 RoE: Market, By Application, 2017–2024 (USD Million)
Table 43 Asia Pacific: Market, By Country, 2017–2024 (USD Million)
Table 44 Asia Pacific: Market, By Technology, 2017–2024 (USD Million)
Table 45 Asia Pacific: Invasive Monitoring Market, By Product, 2017–2024 (USD Million)
Table 46 Asia Pacific: Market, By Application, 2017–2024 (USD Million)
Table 47 China: Market, By Technology, 2017–2024 (USD Million)
Table 48 China: Invasive Monitoring Market, By Product, 2017–2024 (USD Million)
Table 49 China: Market, By Application, 2017–2024 (USD Million)
Table 50 Japan: Market, By Technology, 2017–2024 (USD Million)
Table 51 Japan: Invasive Monitoring Market, By Product, 2017–2024 (USD Million)
Table 52 Japan: Market, By Application, 2017–2024 (USD Million)
Table 53 India: Market, By Technology, 2017–2024 (USD Million)
Table 54 India: Invasive Monitoring Market, By Product, 2017–2024 (USD Million)
Table 55 India: Market, By Application, 2017–2024 (USD Million)
Table 56 RoAPAC: Market, By Technology, 2017–2024 (USD Million)
Table 57 RoAPAC: Invasive Monitoring Market, By Product, 2017–2024 (USD Million)
Table 58 RoAPAC: Market, By Application, 2017–2024 (USD Million)
Table 59 RoW: Market, By Technology, 2017–2024 (USD Million)
Table 60 RoW: Invasive Monitoring Market, By Product, 2017–2024 (USD Million)
Table 61 RoW: Market, By Application, 2017–2024 (USD Million)
Table 62 Product Launches
Table 63 Agreements, Collaborations, and Partnerships
Table 64 Acquisitions
List of Figures (29 Figures)
Figure 1 Market Segmentation
Figure 2 Market: Research Methodology
Figure 3 Research Design
Figure 4 Breakdown of Primary Interviews: By Company Type, Designation, and Region
Figure 5 Market Size Estimation Methodology: Bottom-Up Approach
Figure 6 Market Size Estimation Methodology: Top-Down Approach
Figure 7 Data Triangulation Methodology
Figure 8 Market, By Technology, 2019 vs 2024 (USD Million)
Figure 9 Invasive Monitoring Market, By Product, 2019 vs 2024 (USD Million)
Figure 10 Market, By Application, 2019 vs 2024 (USD Million)
Figure 11 North America Accounted for the Largest Share of the Fractional Flow Reserve: Market in 2018
Figure 12 Increasing Prevalence of Cardiovascular Diseases is the Key Factor Driving the Growth of This Market
Figure 13 Invasive Monitoring Segment Accounted for the Largest Share of the North American Fractional Flow Reserve Market in 2018
Figure 14 Asia Pacific Market to Register the Highest Growth Rate During the Forecast Period
Figure 15 Market: Drivers, Restraints, Opportunities, and Challenges
Figure 16 Market, By Technology, 2019 vs 2024 (USD Million)
Figure 17 Market, By Application, 2019 vs 2024 (USD Million)
Figure 18 Market, By Region, 2019 & 2024
Figure 19 North America: Fractional Flow Reserve: Market Snapshot
Figure 20 Europe: Fractional Flow Reserve: Market Snapshot
Figure 21 Asia Pacific: Fractional Flow Reserve: Market Snapshot
Figure 22 RoW: Fractional Flow Reserve: Market Snapshot
Figure 23 Market Share Ranking, By Key Player (2018)
Figure 24 Strategies Adopted By Market Players (2015–2018)
Figure 25 Company Snapshot: Abbott (2018)
Figure 26 Koninklijke Philips N.V.: Company Snapshot (2018)
Figure 27 Boston Scientific: Company Snapshot (2018)
Figure 28 Company Snapshot: Opsens, Inc (2018)
Figure 29 Company Snapshot: Siemens Healthineers (2018)
The study involved four major activities in estimating the current market size for fractional flow reserve market. Exhaustive secondary research was done to collect information about the market, peer markets, and the parent market. The next step was to validate these findings, assumptions, and sizing with industry experts across the value chain through primary research. Thirdly, both top-down and bottom-up approaches were employed to estimate the complete market size. Finally, the market breakdown and data triangulation were used to estimate the market size of segments and subsegments.
Secondary Research
In the secondary research process, various secondary sources such as the American Heart Association (AHA), Centers for Disease Control and Prevention (CDC), Cardiovascular Health Study (CHS), American College of Cardiology (ACC), American College of Cardiology Foundation (ACCF), Canadian Chronic Disease Surveillance System (CCDSS), Canadian Association of Interventional Cardiology, German Cardiac Society, European Association of Percutaneous Cardiovascular Interventions (EAPCI), French Cardiac Society, French Group of Atheroma and Interventional Cardiology (GACI), Organisation for Economic Co-operation and Development (OECD), The British Cardiovascular Society, British Society of Cardiovascular Imaging (BSCI), National Health Service (NHS), National Congress Italian Society of Invasive Cardiology (GISE), Italian Society of Cardiology, Spanish Society of Cardiology, Spanish Cardiac Catheterization and Coronary Intervention Registry, Turkish Society of Cardiology, Belorussian Society of Cardiologists, Annual Reports, Press Releases, and Corporate Presentations, have been used to identify and collect information useful for the study of this market.
Primary Research
In the primary research process, various sources from both the supply and demand sides were interviewed to obtain qualitative and quantitative information for this report. The primary sources from the supply side include industry experts such as CEOs, vice presidents, marketing directors, technology and innovation directors, and related key executives from various key companies and organizations operating in the fractional flow reserve market. The primary sources from the demand side include personnel from interventional cardiologists, research organizations, academic institutes, and purchase managers.
- A robust primary research methodology has been adopted to validate the contents of the report
- Both telephonic and e-mail interviews of primary participants were conducted through questionnaires
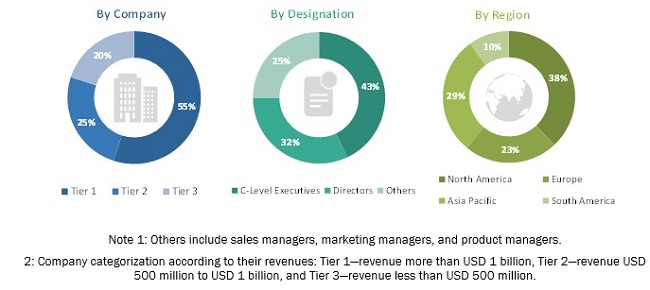
A breakdown of primary respondents is provided below:

To know about the assumptions considered for the study, download the pdf brochure
Market Size Estimation
Top-down and bottom-up approaches were used to validate the size of the fractional flow reserve market and estimate the size of other dependent submarkets. These methods were also used extensively to estimate the size of various subsegments in the market. The research methodology used to estimate the market size includes the following:
- The key players in the industry and markets have been identified through extensive secondary research.
- The industry’s market size, in terms of value, was determined through primary and secondary research processes.
- All percentage shares, splits, and breakdowns have been determined using secondary sources and verified through primary sources.
Data Triangulation
After arriving at the overall market size—using the market size estimation processes as explained above—the market was split into several segments and subsegments. To complete the overall market engineering process and arrive at the exact statistics of each market segment and subsegment, the data triangulation and market breakdown procedures were employed, wherever applicable. The data was triangulated by studying various factors and trends from both the demand and supply sides.
Report Objectives
- To define, describe, and forecast the fractional flow reserve market by technology, application, and region
- To provide detailed information regarding factors influencing market growth (such as drivers, restraints, opportunities, and challenges)
- To strategically analyze micromarkets with respect to individual growth trends, prospects, and contributions to the overall market
- To analyze market opportunities for stakeholders and provide details of the competitive landscape for key players
- To strategically analyze the market structure and profile the key players of the fractional flow reserve market and comprehensively analyze their core competencies
- To forecast the size of the market segments in North America, Europe, Asia Pacific (APAC), and the Rest of the World (RoW)
- To track and analyze competitive developments such as product launches and approvals, acquisitions, partnerships, collaborations, and agreements
Available customizations
With the given market data, MarketsandMarkets offers customizations as per the company’s specific needs. The following customization options are available for the report:
Product Analysis
- Product matrix, which gives a detailed comparison of the product portfolios of each company
Company Information
- Detailed analysis and profiling of additional market players (up to 3)


 Generating Response ...


Growth opportunities and latent adjacency in Fractional Flow Reserve Market