FRP Grating Market by Resin Type (Polyester, Vinyl Ester, Phenolic), Process (Molded, Pultruded), Application (Stair Treads, Walkways, Platforms), End-use Industry (Industrial, Water Management, Cooling Towers, Marine), and Region - Global Forecast to 2021


[149 Pages Report] The FRP Grating Market is expected to reach USD 574.2 Million by 2021, at a CAGR of 4.24% from 2016 to 2021. The properties of FRP grating, such as high strength, light weight, and resistance to corrosion make them suitable for use in the petrochemical, water treatment, oil & gas, shipbuilding, and offshore industries. The base year considered for the study is 2015, and the market size is projected between 2016 and 2021.
Objectives of the Study:
The report analyzes the FRP grating market, in terms of volume (million square meters) and value (USD million). The report also estimates the market size and growth potential of the FRP grating market, which has been segmented based on resin type, process, application, end-use industry, and region. It forecasts the market size for regions, namely, Asia-Pacific, North America, Europe, the Middle East & Africa, and Latin America. The study also covers market opportunities and competitive benchmarking for stakeholders and market leaders.
The research methodology used to estimate and forecast the FRP grating market began with gathering data on key company revenues and raw material costs through secondary sources such as Factiva, Hoovers, and Manta, among others. Product offerings of different companies were taken into consideration to determine market segmentation. The bottom-up approach was used to arrive at the overall market size of FRP grating from the revenues of key players. After arriving at the total market size, the overall market was split into several segments and subsegments, which were then verified through primary research through extensive interviews with CEOs, VPs, directors, and executives. Data triangulation and market breakdown procedures were used to complete the overall market engineering process and arrive at the estimated values of all the segments and subsegments.
The breakdown of profiles of primaries is shown in the figure below:
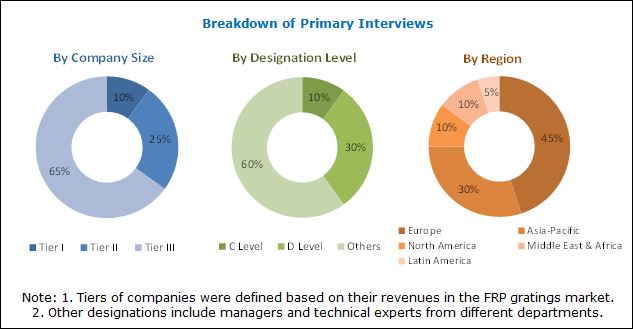
To know about the assumptions considered for the study, download the pdf brochure
The value chain of the FRP grating industry includes manufacturers of resins, fibers, and adhesives. Key players in the FRP grating market are Strongwell Corporation (U.S.), Techno Composites Domine GmbH (U.K.), Meiser GmbH (Germany), Bedford Reinforced Plastics (U.S.), AGC Matex Co. Ltd. (Japan), Kemrock Industries & Exports Ltd. (India), Eurograte Fiberglass Grating (Italy), Ferrotech International FZE (UAE), and Exel Composites (Finland). FRP grating are used in walkways, stair treads, platforms, and other applications.
Target Audience
- FRP Grating Manufacturers
- Raw Material Suppliers
- Distributors and Suppliers
- Industry Associations
�The study answers several questions for the stakeholders, primarily which market segments they need to focus on during the next two to five years to prioritize their efforts and investments.�
Scope of the Report
The research report segments the FRP grating market into the following:
Based on Process:
- Molded
- Pultruded
Based on Resin Type:
- Polyester
- Vinyl Ester
- Phenolic
- Others
Based on Application:
- Stair treads
- Walkways
- Platforms
- Others
Based on End-use Industry:
- Industrial
- Water management
- Cooling towers
- Marine
- Others
Based on Region:
- North America
- Europe
- Asia-Pacific
- Middle East & Africa
- Latin America
Available Customizations
Along with the given market data, MarketsandMarkets offers customizations according to the company�s specific needs. The following customization options are available for the report:
Product Analysis
- Product matrix, which gives a detailed comparison of the product portfolio of each company
Regional Analysis:
- Further breakdown of the North America FRP grating market
- Further breakdown of the Europe FRP grating market
- Further breakdown of the Asia-Pacific FRP grating market
- Further breakdown of the Middle East & Africa FRP grating market
- Further breakdown of the Latin American FRP grating market
Company Information:
- Detailed analysis and profiles of additional market players
The FRP grating market is projected to reach USD 574.2 Million by 2021, at a CAGR of 4.24% from 2016 to 2021. FRP grating are being used in various industries, owing to their properties, such as corrosion resistance, high strength, impact resistance, and light weight. These properties make them suitable for use in water management, the industrial sector, cooling towers, and the marine industry, among others.
Based on type, the FRP grating market has been segmented into molded and pultruded. The pultruded grating segment is projected to witness a higher growth in the coming years, owing the high stiffness, corrosion resistance, and superior strength of pultruded grating.
Based on application, the FRP grating market has been segmented into walkways, stair treads, and platforms, among others. Contractors, architects, and construction companies are increasingly using FRP grating for both functional and aesthetic purposes, such as in walkways, flooring, ceilings, and platforms. These grating can be easily installed, require low maintenance, and are lightweight.
Product performance of FRP grating can be enhanced with the use of resins or glass fiber. FRP grating are used with different resins, to exhibit different properties and enhance the performance of a product, depending on the application that they are used in. Polyester is a resin that is widely used with FRP grating to manufacture lightweight and high-strength grating.
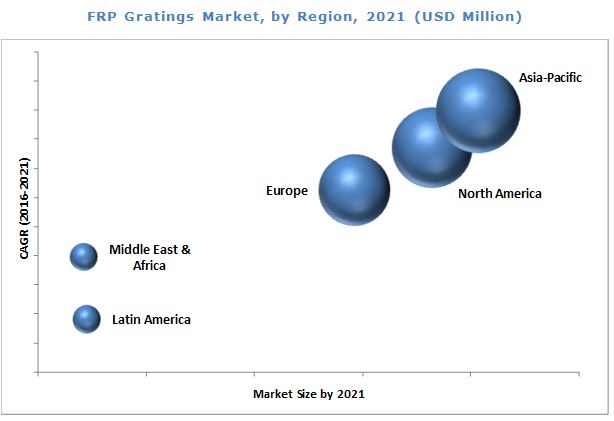
Asia-Pacific is estimated to be the largest market for FRP grating. The FRP markets in China, India, and Japan are expected to witness high growth in near future because of the growing industrial sector in these countries.
The high cost of production and the availability of low-cost substitutes can restrain the growth of the FRP grating market.
Major manufacturers of FRP grating include Strongwell Corporation (U.S.), Techno Composites Domine GmbH (U.K.), McNichols Company (U.S.), Meiser GmbH (Germany), Bedford Reinforced Plastics (U.S.), AGC Matex Co. Ltd. (Japan), Kemrock Industries & Exports Ltd. (India), Eurograte Fiberglass Grating (Italy), Ferrotech International FZE (UAE), and Exel Composites (Finland).
To speak to our analyst for a discussion on the above findings, click Speak to Analyst
 Exclusive indicates content/data unique to MarketsandMarkets and not available with any competitors.
Table of Contents
1 Introduction (Page No. - 15)
1.1 Objectives of the Study
1.2 Market Definition
1.3 Market Scope
1.3.1 Markets Covered
1.3.2 Regional Scope
1.3.3 Years Considered for the Study
1.4 Currency
1.5 Package Size
1.6 Stakeholders
2 Research Methodology (Page No. - 19)
2.1 Research Data
2.1.1 Secondary Data
2.1.1.1 Key Data From Secondary Sources
2.1.2 Primary Data
2.1.2.1 Key Data From Primary Sources
2.1.2.2 Key Industry Insights
2.1.2.3 Breakdown of Primary Interviews
2.2 Market Size Estimation
2.2.1 Bottom-Up Approach
2.2.2 Top-Down Approach
2.3 Data Triangulation
2.3.1 Research Assumptions
2.4 Limitations
3 Executive Summary (Page No. - 28)
4 Premium Insights (Page No. - 33)
4.1 Significant Growth Opportunities in FRP Grating Market
4.2 FRP Grating Market, By Application
4.3 FRP Grating Market Share, By Region and End-Use Industry, 2015
4.4 FRP Grating Market, By Country
4.5 FRP Grating Market, By Resin Type
4.6 FRP Grating Market, By Process
5 Macroeconomic Overview (Page No. - 37)
5.1 Introduction
5.2 Trends and Forecast of GDP
5.3 Per Capita GDP vs Per Capita Composite Demand
5.4 Trends and Forecast of Construction Industry and Its Effect on Construction Composites Market
5.4.1 Trends and Forecast of Construction Industry in North America
5.4.2 Trends and Forecast of Construction Industry in Europe
5.4.2.1 Construction Industry Trend in Europe
5.4.3 Trends and Forecast of Construction Industry in Asia-Pacific
5.4.3.1 Construction Industry Trend in Asia-Pacific
5.4.4 Trends and Forecast of Construction Industry in Middle East & Africa
5.4.5 Trends and Forecast of Construction Industry in Latin America
6 Market Overview (Page No. - 46)
6.1 Market Dynamics
6.1.1 Drivers
6.1.1.1 Increasing Demand for Non-Corrosive and High-Performance Grating From Major Industries
6.1.1.2 Low Life Cycle Costs of FRP Grating
6.1.2.1 High Production Costs of FRP Grating
6.1.2.2 Availability of Low-Cost Substitutes
6.1.3 Opportunities
6.1.3.1 Increase in Use of FRP Grating in Various Industries
6.1.4 Challenges
6.1.4.1 Recyclability and Disposal Costs of FRP Grating
6.2 Porter�s Five Forces Analysis
6.2.1 Threat of Substitutes
6.2.2 Bargaining Power of Suppliers
6.2.3 Bargaining Power of Buyers
6.2.4 Threat of New Entrants
6.2.5 Intensity of Competitive Rivalry
7 FRP Grating Market, By Process (Page No. - 54)
7.1 Introduction
7.2 Molded FRP Grating
7.3 Pultruded FRP Grating
8 FRP Grating Market, By Resin Type (Page No. - 58)
8.1 Introduction
8.2 Polyester Resin
8.2.1 Orthophthalic Polyester Resin
8.2.2 Isophthalic Polyester Resin
8.3 Vinyl Ester Resin
8.4 Phenolic Resin
8.5 Other Resins
8.5.1 Epoxy
8.5.2 Polyurethane
9 FRP Grating Market, By Application (Page No. - 64)
9.1 Introduction
9.2 Stair Treads
9.3 Walkways
9.4 Platforms
9.5 Other Applications
10 FRP Grating Market, By End-Use Industry (Page No. - 70)
10.1 Introduction
10.2 Industrial
10.2.1 Petrochemical
10.2.2 Pulp & Paper
10.2.3 Food & Beverage
10.2.4 Mining
10.2.5 Pharmaceutical
10.2.6 Oil & Gas
10.3 Water Management
10.4 Cooling Towers
10.5 Marine
10.6 Others
10.6.1 Transportation
10.6.2 Civil Engineering
11 Regional Analysis (Page No. - 78)
11.1 Introduction
11.2 North America
11.2.1 U.S.
11.2.2 Canada
11.3 Europe
11.3.1 Germany
11.3.2 U.K.
11.3.3 France
11.3.4 Italy
11.3.5 Spain
11.3.6 Netherlands
11.3.7 Rest of Europe
11.4 Asia-Pacific
11.4.1 China
11.4.2 Japan
11.4.3 India
11.5 Middle East & Africa
11.5.1 UAE
11.5.2 Rest of Middle East & Africa
11.6 Latin America
11.6.1 Brazil
11.6.2 Mexico.
12 Dive, FRP Grating Market (Page No. - 101)
12.1 Introduction
12.1.1 Dynamics
12.1.2 Innovators
12.1.3 Vanguards
12.1.4 Emerging
12.2 Overview
12.3 Product Offerings
12.4 Business Strategy
13 Company Profiles (Page No. - 105)
(Overview, Financial*, Products & Services, Strategy, and Developments)
13.1 Strongwell Corporation
13.2 Techno Composites Domine GmbH
13.3 Meiser GmbH
13.4 Bedford Reinforced Plastics
13.5 AGC Matex Co. Ltd
13.6 Liberty Pultrusions
13.7 Delta Composites LLC
13.8 Mcnichols Co.
13.9 National Grating
13.10 Lionweld Kennedy
13.11 Kemrock Industries & Exports Ltd.
13.12 Locker Group
13.13 Eurograte Fiberglass Grating
13.14 Ferrotech International FZE
13.15 Suzhou Grating Co., Ltd. (iGrid)
13.16 Fibergrate Composite Structures Ltd.
13.17 Exel Composites
13.18 Arham Hi-Tech Design and Solution Pvt. Ltd.
13.19 Indiana Group
13.20 Diakure Co. Ltd.
13.21 Jiangyin Runlin Molding New Materials Co., Ltd.
13.22 Fibrolux GmbH
13.23 Amico Seasafe Inc.
13.24 Flexxcon Bv
13.25 Webforge
*Details Might Not Be Captured in Case of Unlisted Companies
14 Appendix (Page No. - 142)
14.1 Insights From Industry Experts
14.2 Discussion Guide
14.3 Knowledge Store: Marketsandmarkets� Subscription Portal
14.4 Introducing RT: Real-Time Market Intelligence
14.5 Available Customizations
14.6 Related Reports
14.7 Author Details
List of Tables (71 Tables)
Table 1 FRP Grating Market Size, 2014�2021
Table 2 Trends and Forecast of Gdp, 2015�2021 (USD Billion)
Table 3 Per Capita GDP vs Per Capita Composite Demand, 2015
Table 4 Contribution of Construction Industry to GDP of North America, (USD Billion) 2014�2021
Table 5 Contribution of Construction Industry to GDP of Europe, (USD Billion) 2014�2021
Table 6 Contribution of Construction Industry to GDP of Asia-Pacific, (USD Billion) 2014�2021
Table 7 Contribution of Construction Industry to GDP in Middle East & Africa, (USD Billion) 2014�2021
Table 8 Contribution of Construction Industry to GDP in Latin America, (USD Billion) 2014�2021
Table 9 FRP Grating Market Size, By Process, 2014�2021 (USD Million)
Table 10 FRP Grating Market Size, By Process, 2014�2021 (Million Square Meter)
Table 11 Molded FRP Grating Market Size, By Region, 2014�2021 (USD Million)
Table 12 Pultruded FRP Grating Market Size, By Region, 2014�2021 (USD Million)
Table 13 FRP Grating Market Size, By Resin Type, 2014�2021 (USD Million)
Table 14 FRP Grating Market Size, By Resin Type, 2014�2021 (Million Square Meter)
Table 15 Polyester Resin-Based FRP Grating Market Size, By Region, 2014�2021 (USD Million)
Table 16 Vinyl Ester Resin-Based FRP Grating Market Size, By Region, 2014�2021 (USD Million)
Table 17 Phenolic Resin-Based FRP Grating Market Size, By Region, 2014�2021 (USD Million)
Table 18 Other Resins-Based FRP Grating Market Size, By Region, 2014�2021 (USD Million)
Table 19 By Market Size, By Application, 2014�2021 (USD Million)
Table 20 By Market Size, By Application, 2014�2021 (Million Square Meter)
Table 21 By Market Size in Stair Treads, By Region, 2014�2021 (USD Million)
Table 22 By Market Size in Walkways, By Region, 2014�2021 (USD Million)
Table 23 By Market Size in Platforms, By Region, 2014�2021 (USD Million)
Table 24 By Market Size in Other Applications, By Region, 2014�2021 (USD Million)
Table 25 By Market Size, By End-Use Industry, 2014�2021 (USD Million)
Table 26 By Market Size, By End-Use Industry, 2014�2021 (Million Square Meter)
Table 27 By Market Size in Industrial Segment, By Region, 2014�2021 (USD Million)
Table 28 By Market Size in Water Management, By Region, 2014�2021 (USD Million)
Table 29 By Market Size in Cooling Towers, By Region, 2014�2021 (USD Million)
Table 30 By Market Size in Marine, By Region, 2014�2021 (USD Million)
Table 31 By Market Size in Other End-Use Industries, By Region, 2014�2021 (USD Million)
Table 32 By Market Size, By Region, 2014�2021 (USD Million)
Table 33 North America: By Market Size, By Country, 2014�2021 (USD Million)
Table 34 North America: By Market Size, By Process, 2014�2021 (USD Million)
Table 35 North America: By Market Size, By Resin Type, 2014�2021 (USD Million)
Table 36 North America: By Market Size, By Application, 2014�2021 (USD Million)
Table 37 North America: By Market Size, By End-Use Industry, 2014�2021 (USD Million)
Table 38 U.S.: By Market Size, By End-Use Industry, 2014�2021 (USD Million)
Table 39 Canada: By Market Size, By End-Use Industry, 2014�2021 (USD Million)
Table 40 Europe: By Market Size, By Country, 2014�2021 (USD Million)
Table 41 Europe: By Market Size, By Process, 2014�2021 (USD Million)
Table 42 Europe: By Market Size, By Resin Type, 2014�2021 (USD Million)
Table 43 Europe: By Market Size, By Application, 2014�2021 (USD Million)
Table 44 Europe: By Market Size, By End-Use Industry, 2014�2021 (USD Million)
Table 45 Germany: By Market Size, End-Use Industry, 2014�2021 (USD Million)
Table 46 U.K.: By Market Size, By End-Use Industry, 2014�2021 (USD Million)
Table 47 France: By Market Size, By End-Use Industry, 2014�2021 (USD Million)
Table 48 Italy: By Market Size, By End-Use Industry, 2014�2021 (USD Million)
Table 49 Spain: By Market Size, By End-Use Industry, 2014�2021 (USD Million)
Table 50 Netherlands: By Market Size, By End-Use Industry, 2014�2021 (USD Million)
Table 51 Asia-Pacific: By Market Size, By Country, 2014�2021 (USD Million)
Table 52 Asia-Pacific: By Market Size, By Process, 2014�2021 (USD Million)
Table 53 Asia-Pacific: By Market Size, By Resin Type, 2014�2021 (USD Million)
Table 54 Asia-Pacific: By Market Size, By Application, 2014�2021 (USD Million)
Table 55 Asia-Pacific: By Market Size, By End-Use Industry, 2014�2021 (USD Million)
Table 56 China: By Market Size, By End-Use Industry, 2014�2021 (USD Million)
Table 57 Japan: By Market Size, By End-Use Industry, 2014�2021 (USD Million)
Table 58 India: By Market Size, By End-Use Industry, 2014�2021 (USD Million)
Table 59 Middle East & Africa: By Market Size, By Country, 2014�2021 (USD Million)
Table 60 Middle East & Africa: By Market Size, By Process, 2014�2021 (USD Million)
Table 61 Middle East & Africa: By Market Size, By Resin Type, 2014�2021 (USD Million)
Table 62 Middle East & Africa: By Market Size, By Application, 2014�2021 (USD Million)
Table 63 Middle East & Africa: By Market Size, By End-Use Industry, 2014�2021 (USD Million)
Table 64 UAE: By Market Size, By End-Use Industry, 2014�2021 (USD Million)
Table 65 Latin America: By Market Size, By Country, 2014�2021 (USD Million)
Table 66 Latin America: By Market Size, By Process, 2014�2021 (USD Million)
Table 67 Latin America: By ting Market Size, By Resin Type, 2014�2021 (USD Million)
Table 68 Latin America: By Market Size, By Application, 2014�2021 (USD Million)
Table 69 Latin America: By Market Size, By End-Use Industry, 2014�2021 (USD Million)
Table 70 Brazil: By Market Size, By End-Use Industry, 2014�2021 (USD Million)
Table 71 Mexico: By Market Size, By End-Use Industry, 2014�2021 (USD Million)
List of Figures (69 Figures)
Figure 1 FRP Grating Market Segmentation
Figure 2 FRP Grating Market: Research Design
Figure 3 Market Size Estimation: Bottom-Up Approach
Figure 4 Market Size Estimation: Top-Down Approach
Figure 5 FRP Grating: Data Triangulation
Figure 6 Industrial Segment to Drive FRP Grating Market, 2016�2021
Figure 7 China to Be the Fastest-Growing FRP Grating Market, 2016�2021
Figure 8 Polyester to Dominate FRP Grating Market, By Resin Type
Figure 9 Walkways to Be the Fastest-Growing Application in FRP Grating Market Between 2016 and 2021
Figure 10 Asia-Pacific to Be the Largest and Fastest-Growing FRP Grating Market
Figure 11 Corrosion Resistant and High Strength of FRP Grating to Drive the Market During Forecast Period
Figure 12 Walkways to Be the Fastest-Growing Application Segment of FRP Grating Market Between 2016 and 2021
Figure 13 Asia-Pacific is the Largest Market for FRP Grating, in Terms of Value
Figure 14 China to Be the Fastest-Growing Market, 2016�2021
Figure 15 Polyester Resin to Dominate FRP Grating Market
Figure 16 Pultruded FRP Grating to Be the Fastest-Growing Segment During Forecast Period
Figure 17 Trends and Forecast of Gdp,2016-2021 (USD Billion)
Figure 18 Per Capita GDP vs Per Capita Composite Demand
Figure 19 Trends and Forecast of Construction Industry in North America
Figure 20 Trends and Forecast of Construction Industry in Europe
Figure 21 Trends and Forecast of Construction Industry in Asia-Pacific
Figure 22 Construction Industry in Saudi Arabia Contributes the Maximum to GDP in Middle East & Africa, USD Billion, 2016 vs 2021
Figure 23 Construction Industry in Brazil Contributes the Maximum to GDP in Latin America, USD Billion, 2016 vs 2021
Figure 24 Drivers, Restraints, Opportunities, and Challenges in FRP Grating Market
Figure 25 Porter�s Five Forces Analysis
Figure 26 Pultruded FRP Grating to Register the Highest CAGR in Asia-Pacific Between 2016 and 2021
Figure 27 Asia-Pacific to Dominate Polyester Resin-Based FRP Grating Market During Forecast Period
Figure 28 Asia-Pacific Dominated Phenolic Resin-Based FRP Grating Market in 2016
Figure 29 FRP Grating Market in Walkways to Register the Highest CAGR Between 2016 and 2021
Figure 30 Asia-Pacific to Dominate FRP Grating Market in Other Applications
Figure 31 Asia-Pacific Dominated the Industrial Segment in FRP Grating Market, in Terms of Value (2016�2021)
Figure 32 North America to Be the Fastest-Growing FRP Grating Market in Marine Industry, in Terms of Value (2016�2021)
Figure 33 China to Drive the FRP Grating Market in Asia-Pacific
Figure 34 North America FRP Grating Market Snapshot: U.S. to Lead the Market
Figure 35 Europe FRP Grating Market Snapshot: U.K. to Lead the Market
Figure 36 Asia-Pacific FRP Grating Market Snapshot: China to Lead the Market
Figure 37 Dive Chart
Figure 38 Strongwell Corporation: Product Offering Scorecard
Figure 39 Strongwell Corporation: Business Strategy Scorecard
Figure 40 Techno Composites Domine GmbH: Product Offering Scorecard
Figure 41 Techno Composites Domine GmbH: Business Strategy Scorecard
Figure 42 Meiser GmbH: Product Offering Scorecard
Figure 43 Meiser GmbH: Business Strategy Scorecard
Figure 44 Bedford Reinforced Plastics: Product Offering Scorecard
Figure 45 Bedford Reinforced Plastics: Business Strategy Scorecard
Figure 46 AGC Matex Co. Ltd.: Product Offering Scorecard
Figure 47 AGC Matex Co. Ltd.: Business Strategy Scorecard
Figure 48 Liberty Pultrusions: Product Offering Scorecard
Figure 49 Liberty Pultrusions: Business Strategy Scorecard
Figure 50 Delta Composites LLC: Product Offering Scorecard
Figure 51 Delta Composites LLC: Business Strategy Scorecard
Figure 52 Mcnichols Co.: Product Offering Scorecard
Figure 53 Mcnichols Co.: Business Strategy Scorecard
Figure 54 National Grating: Product Offering Scorecard
Figure 55 National Grating: Business Strategy Scorecard
Figure 56 Lionweld Kennedy: Product Offering Scorecard
Figure 57 Lionweld Kennedy: Business Strategy Scorecard
Figure 58 Kemrock Industries & Exports Ltd: Product Offering Scorecard
Figure 59 Kemrock Industries & Exports Ltd: Business Strategy Scorecard
Figure 60 Locker Group: Product Offering Scorecard
Figure 61 Locker Group: Business Strategy Scorecard
Figure 62 Eurograte Fiberglass Grating: Product Offering Scorecard
Figure 63 Eurograte Fiberglass Grating: Business Strategy Scorecard
Figure 64 Ferrotech International FZE: Product Offering Scorecard
Figure 65 Ferrotech International FZE: Business Strategy Scorecard
Figure 66 Suzhou Grating Co. Ltd.: Product Offering Scorecard
Figure 67 Suzhou Grating Co. Ltd.: Business Strategy Scorecard
Figure 68 Fibergrate Composite Structures Ltd.: Product Offering Scorecard
Figure 69 Fibergrate Composite Structures Ltd.: Business Strategy Scorecard


Growth opportunities and latent adjacency in FRP Grating Market
We want to know the potential in India specifically.
Need contact details of FRP, GRP, PVDF, PIPESA FLANGES AND GRATINGS manufacturers.