Vinyl Ester Market

Vinyl Ester Market by Product Type (Bisphenol A, Novolac, Brominated Fire Retardant, Elastomer Modified), End-Use (Pipes & Tanks, Marine, Wind Energy, FGD & Precipitators, Building & Construction, Aerospace & Defense), and Region - Global Forecast to 2029

Report Code: CH 5719 Sep, 2024, by marketsandmarkets.com

Vinyl Ester Market

The global vinyl ester market is valued at USD 1.04 billion in 2024 and is projected to reach USD 1.29 billion by 2029, growing at 4.4% cagr from 2024 to 2029. Pipes & tanks, marine, and wind energy sectors are driving the growth in the vinyl ester market. In industrial applications, they ensure high-performance material for excellent tensile strength and enhanced chemical resistance. The pipes & tanks sector benefits from high-performance bisphenol A vinyl ester. In the marine sector, vinyl ester enables the development of lightweight, durable, and corrosion-resistance materials, supporting the rise of composite materials.

Attractive Opportunities in Vinyl Ester Market

Vinyl Ester Market

To know about the assumptions considered for the study, Request for Free Sample Report

Vinyl Ester Market

Vinyl Ester Market Dynamics

Driver: Superior chemical resistance

The superior chemical resistance properties of vinyl ester resins make them ideal for applications involving resistance to corrosion, temperature, and durability in several industries. This is critical for industries such as infrastructure, where materials are exposed to the harsh environment for an extended time. Vinyl esters also have applications in chemical processing and marine industries. They are distinguished by distinct molecular structures comprising an unsaturated carboxylic acid backbone supported by epoxy. A polymer with higher resistance to various chemicals, such as acids, alkalis, solvents, and other corrosive substances, is produced because of this combination. Since vinyl ester resists much more than ordinary polyester resins, it is an ideal choice for several industries.

Restraints: Low shelf life of vinyl ester

When exposed to air, vinyl esters form a gel faster than unsaturated polyester resins, which makes their storage difficult, leading to a shorter shelf life. According to Trojan Fiberglass, vinyl ester products typically have a four-to-six-month shelf life. Shelf life is to give a reasonable expectation of usable life; however, they exceed these time frames. Additives such as promoters and inhibitors are added to vinyl ester resins to increase their shelf life. This must be carefully monitored to ensure that any beneficial properties are not diminished. The low shelf life of vinyl ester resins imposes significant constraints on the supply chain and inventory management. Manufacturers and distributors need to maintain stringent control over storage conditions, including temperature and humidity, to prevent resin degradation. Additionally, end users, particularly in industries such as chemical processing, marine, and construction, need to plan their procurement and usage schedules precisely to ensure that the resin is utilized within its usable life. Difficulties in storing combined with the short shelf life are the major factors inhibiting growth in the market.

Opportunity: Increasing installation of wind turbines

The wind energy sector keeps outgrowing itself, with ever-growing investments in renewable energy and government incentives to reduce carbon emissions. Indeed, wind turbines and sub-components will experience an increase in demand as more countries set ambitious renewable energy targets. The increasing wind energy projects worldwide open a wide window for vinyl esters. These are used to manufacture turbine blades because they bear fatigue and improve the reliability and lifespan of turbines. Growing demand for renewable energy sources accelerates the need for vinyl ester resins in manufacturing turbine blades. High strength-to-weight and superior fatigue make these products suitable for this application. The booming wind energy sector has led to increased demand for sustainable materials. Vinyl esters are being utilized in manufacturing these components, which prove to be an important opportunity for market players.

Challenge: Fluctuation in raw material prices

One of the major factors affecting the vinyl ester market is raw material price volatility. The prices of materials directly affect production costs and profit margins. Key raw materials in vinyl ester manufacturing are derived from epoxy resins, methacrylic acid, and styrene monomer, whose prices fluctuate. They are derivatives of petrochemicals; thus, their prices have a strong correlation with the global oil market and are subject to rapid and unpredictable changes. Unexpected rises in the prices of raw materials cause manufacturers to produce at high costs, which are sometimes difficult to pass on to customers, especially in very competitive markets. This depresses profit margins, creating financial pressure on companies, most of which are normally a part of small players and may have less financial flexibility to absorb these costs. Given the unpredictable nature of raw material prices, long-term planning and innovation investment are difficult to achieve. Even in cases where the costs are unstable, companies may be unwilling to commit resources.

Vinyl Ester Market: Ecosystem

Prominent companies in this market include well-established and financially stable manufacturers of vinyl ester market. These companies have been operating in the market for several years and possess a diversified product portfolio and strong global sales and marketing networks. Prominent companies in this market include INEOS Composites (US), Interplastic Corporation (US), Reichhold LLC (US), Sino Polymer Co. (China), and Swancor Holding Co., Ltd. (Taiwan).

Vinyl Ester Market Ecosystem

The Bisphenol A segment, by product type, is estimated to account for the highest CAGR during the forecast period.

Bisphenol A is one of the most versatile vinyl esters available for marine and industrial applications. The product of the reaction of Bisphenol A and vinyl acetate, highly cross-linked, thermosetting resin, possesses superior strength, excellent durability, and chemical, abrasion, and hydrolysis resistance. Bisphenol A vinyl ester is normally used in the fabrication of hulls, decks, and superstructures of marine applications and in industries where the application is made onto pipes, tanks, and coatings. Bisphenol A vinyl ester contributes to the service life and performance of the structure with its mechanical properties and corrosion resistance. As the demand for composite materials continues to grow, the use of bisphenol A in the vinyl ester market is expected to increase, contributing to the development of advanced and reliable composite materials. The demand for bisphenol A is expected to rise further due to the expanding needs in the marine industry and automotive parts.

The pipes & tanks segment, by end-use industry, is estimated to account for the highest CAGR during the forecast period.

The demand for vinyl esters is primarily driven by the pipes & tanks end-use industry, which is expected to be the largest segment during the forecast period. Vinyl ester pipes are ideal for handling and transporting aggressive chemicals in the most corrosive of environments and applications, including chemical processing, wastewater treatment, and oil & gas production. Vinyl ester tanks are commonly used to store hazardous materials, corrosive liquids, and other substances that require strong and leakage-proof containment vessels. Strength, chemical resistance, and durability make vinyl ester for pipes & tanks an ideal material in demanding industrial applications. Hence, the growing demand for vinyl ester in the pipes & tanks industry is likely to drive the segment in the coming time.

Asia Pacific is estimated to account for the highest CAGR during the forecast period.

The demand for vinyl ester is also high in the Asia Pacific because of rapid industrialization, infrastructure development, and unmet demand for durable and anti-corrosive materials. China, India, and South Korea significantly contribute to the regional market, while the focus on application sectors such as marine, chemical processing, oil & gas, and infrastructure is growing. The growing shipbuilding industry in this region and the demand for chemical plants to have high-performance materials, even in wastewater treatment, created a surge in the demand for vinyl ester resins. The increasing awareness of the long-term benefits of vinyl ester also drives its consumption in various industries across the region. Thus, the Asia Pacific holds the highest CAGR in the vinyl ester market during the forecast period.

Vinyl Ester Market by Region

Source: Secondary Research, Interviews with Experts, and MarketsandMarkets Analysis

To know about the assumptions considered for the study, download the pdf brochure

Vinyl Ester Market Players

Major companies in the vinyl ester market include INEOS Composites (US), Polynt S.p.A. (Italy), SWANCOR (Taiwan), Interplastic Corporation (US), AOC (US), Sino Polymer Co., Ltd. (China), Resonac Holdings Corporation (Japan), Reichhold LLC (US), BUFA Composites (Germany), Allnex GmbH (Germany), Scott Bader Company Ltd. (UK), Hexion Inc. (US), DIC Corporation (Japan), Poliya (Turkey), and Nivitex Fibreglass & Resins (South Africa), among others. A total of 15 major players have been covered. These players have adopted agreements, partnerships, investments, acquisitions, and expansions as the major strategies to consolidate their position in the market.

Vinyl Ester Market Report Scope

Report Metric

Details

Market size available for years

2020 – 2029

Base year considered

2023

Forecast period

2024 – 2029

Forecast units

Value (USD Million) and Volume (Tons)

Segments covered

Product Type, End-use Industry, and Region.

Geographies covered

North America, Asia Pacific, Europe, Middle East & Africa, and South America

Companies covered

The major market players include INEOS Composites (US), Polynt S.p.A. (Italy), SWANCOR (Taiwan), Interplastic Corporation (US), AOC (US), Sino Polymer Co., Ltd. (China), Resonac Holdings Corporation (Japan), Reichhold LLC (US), BUFA Composites (Germany), Allnex GmbH (Germany), Scott Bader Company Ltd. (UK), Hexion Inc. (US), DIC Corporation (Japan), Poliya (Turkey), Nivitex Fibreglass & Resins (South Africa), and Others.

This research report categorizes the Vinyl ester market based on Source, Battery Chemistry, Recycling Process, Battery Component, and Region.

Based on Product Type, the Vinyl ester market has been segmented as follows:
  • Bisphenol A
  • Novolac
  • Brominate Fire Retardant
  • Elastomer Modified
  • Others
Based on End-Use, the Vinyl ester market has been segmented as follows:
  • Pipes & Tanks
  • Marine
  • Wind Energy
  • FGD & Percipitators
  • Building & Construction
  • Land Transportation
  • Aerospace & Defence
  • Others
Based on region, the Vinyl ester market has been segmented as follows:
  • Asia Pacific
  • Europe
  • North America
  • South America
  • Middle East & Africa

Recent Developments

  • In April 2023, AOC and BÜFA Composite Systems signed an agreement that targeted to expand their distribution in Southeast Europe through Büfa Composites Austria. Customers in the region will receive better service with various high-quality formulations, gelcoats, and auxiliary materials.
  • In April 2023, BÜFA Composite Systems acquired the composite division from Joh. Klinglhuber & Söhne Handelsgesellschaft mbH. This constituted a strategic purchase by Büfa Composites to significantly raise its presence and visibility throughout the Austrian domestic market and wider Eastern Europe.
  • In December 2023, Scott Bader Company Ltd and Bodotex entered into an agreement giving Bodotex the right and authority to control different product lines of distribution processes, composite materials, functional polymer solutions, and structural adhesive products. Geographically, this agreement is targeted at two different regions, South Africa and Denmark.
  • In June 2024, Scott Bader established a fully independent operational presence in Brazil. This will come a decade after a long, ongoing joint venture with NOVAPOL PLÁSTICOS LTDA, a subsidiary operating under the umbrella of GRUPO IMSA S.A.
  • In March 2022, The Mahad plant remained the only production facility that supplied to manufacturing units of Allnex GmbH. The company acquired the Coating Resins Business from D.R. Coats Ink & Resins Pvt. Ltd.

Frequently Asked Questions (FAQ):

To speak to our analyst for a discussion on the above findings, click Speak to Analyst

TABLE OF CONTENTS
 
1 INTRODUCTION
2 RESEARCH METHODOLOGY
3 EXECUTIVE SUMMARY
 
4 PREMIUM INSIGHTS (Page No. - 42)
    4.1 ATTRACTIVE OPPORTUNITIES FOR PLAYERS IN VINYL ESTER MARKET 
    4.2 VINYL ESTER MARKET, BY REGION 
    4.3 VINYL ESTER MARKET, BY PRODUCT TYPE 
    4.4 VINYL ESTER MARKET, BY END-USE INDUSTRY 
 
5 MARKET OVERVIEW (Page No. - 44)
    5.1 INTRODUCTION 
    5.2 MARKET DYNAMICS 
           5.2.1 DRIVERS
                    5.2.1.1 Superior chemical resistance
                    5.2.1.2 Booming pipes & tanks sector
           5.2.2 RESTRAINTS
                    5.2.2.1 Low shelf life
                    5.2.2.2 Availability of substitutes
                    5.2.2.3 High toxicity of resins
           5.2.3 OPPORTUNITIES
                    5.2.3.1 Increasing installation of wind turbines
                    5.2.3.2 Growing use of vinyl esters in railways
           5.2.4 CHALLENGES
                    5.2.4.1 Fluctuating raw material prices
    5.3 PORTER’S FIVE FORCES ANALYSIS 
           5.3.1 BARGAINING POWER OF SUPPLIERS
           5.3.2 BARGAINING POWER OF BUYERS
           5.3.3 THREAT OF NEW ENTRANTS
           5.3.4 THREAT OF SUBSTITUTES
           5.3.5 INTENSITY OF COMPETITIVE RIVALRY
 
6 INDUSTRY TRENDS (Page No. - 51)
    6.1 MACROECONOMIC OUTLOOK 
           6.1.1 GDP
           6.1.2 RESEARCH & DEVELOPMENT EXPENDITURE
           6.1.3 GROWTH OF PIPES & TANKS SEGMENT
    6.2 SUPPLY CHAIN ANALYSIS 
    6.3 ECOSYSTEM ANALYSIS 
    6.4 PRICING ANALYSIS 
           6.4.1 AVERAGE PRICE OF VINYL ESTER, BY PRODUCT TYPE, 2023
    6.5 TARIFF & REGULATORY LANDSCAPE 
           6.5.1 TARIFF DATA
           6.5.2 REGULATORY LANDSCAPE
                    6.5.2.1 Regulatory bodies, government agencies, and other organizations
    6.6 KEY CONFERENCES & EVENTS, 2024–2025 
    6.7 KEY STAKEHOLDERS & BUYING CRITERIA 
           6.7.1 KEY STAKEHOLDERS IN BUYING PROCESS
           6.7.2 BUYING CRITERIA
    6.8 PATENT ANALYSIS 
    6.9 TECHNOLOGY ANALYSIS 
           6.9.1 KEY TECHNOLOGIES
                    6.9.1.1 Bio-based vinyl ester resins
           6.9.2 ADJACENT TECHNOLOGIES
                    6.9.2.1 Thermoplastic resins
    6.10 TRADE ANALYSIS 
           6.10.1 IMPORT DATA
           6.10.2 EXPORT DATA
    6.11 TRENDS/DISRUPTIONS IMPACTING CUSTOMERS’ BUSINESSES 
    6.12 INVESTMENT & FUNDING SCENARIO 
    6.13 IMPACT OF GENERATIVE AI ON VINYL ESTER MARKET 
           6.13.1 PROCESS OPTIMIZATION
           6.13.2 QUALITY CONTROL
           6.13.3 SUPPLY CHAIN MANAGEMENT
 
7 VINYL ESTER MARKET, BY PRODUCT TYPE (Page No. - 70)
    7.1 INTRODUCTION 
    7.2 BISPHENOL A 
           7.2.1 ENHANCED CHEMICAL RESISTANCE, MECHANICAL STRENGTH, AND LONGEVITY TO DRIVE MARKET
    7.3 NOVOLAC 
           7.3.1 RISING USE IN CHEMICAL PROCESSING FACTORIES AND WASTE TREATMENT FACILITIES TO FAVOR GROWTH
    7.4 BROMINATED FIRE RETARDANT 
           7.4.1 RISING EMPHASIS ON FIRE SAFETY TO FUEL MARKET
    7.5 ELASTOMER-MODIFIED 
           7.5.1 IMPROVED FLEXIBILITY, IMPACT RESISTANCE, AND DURABILITY TO EXPEDITE GROWTH
    7.6 OTHER PRODUCT TYPES 
 
8 VINYL ESTER MARKET, BY END-USE INDUSTRY (Page No. - 82)
    8.1 INTRODUCTION 
    8.2 PIPES & TANKS 
           8.2.1 LOWER MAINTENANCE COSTS AND DOWNTIME TO SUPPORT GROWTH
    8.3 MARINE 
           8.3.1 BOOMING BOAT AND SHIP-BUILDING ACTIVITIES TO PROMOTE GROWTH
    8.4 WIND ENERGY 
           8.4.1 INCREASED FOCUS ON RENEWABLE ENERGY SOURCES TO PROPEL MARKET
    8.5 FGD & PRECIPITATORS 
           8.5.1 GROWING UTILIZATION IN POWER STATIONS AND INDUSTRIAL FACILITIES TO AID MARKET GROWTH
    8.6 BUILDING & CONSTRUCTION 
           8.6.1 GLOBAL TREND TOWARD INFRASTRUCTURE DEVELOPMENT AND RESTORATION PROJECTS TO AUGMENT GROWTH
    8.7 LAND TRANSPORTATION 
           8.7.1 RISING NEED FOR DURABLE AND IMPACT-RESISTANT MATERIALS TO STIMULATE GROWTH
    8.8 AEROSPACE & DEFENSE 
           8.8.1 INCREASING MILITARY AND COMMERCIAL AIRCRAFT MANUFACTURING TO FACILITATE GROWTH
    8.9 OTHER END-USE INDUSTRIES 
 
9 VINYL ESTER MARKET, BY REGION (Page No. - 99)
    9.1 INTRODUCTION 
    9.2 ASIA PACIFIC 
           9.2.1 CHINA
                    9.2.1.1 Growing environmental concerns and regulatory requirements for limiting emissions to propel market
           9.2.2 JAPAN
                    9.2.2.1 Rising demand for corrosion-resistant materials in infrastructure projects to expedite growth
           9.2.3 INDIA
                    9.2.3.1 Increasing population and rapidly growing economy to accelerate growth
           9.2.4 AUSTRALIA & NEW ZEALAND
                    9.2.4.1 Increased commitment toward environmental sustainability to sustain growth
           9.2.5 SOUTH KOREA
                    9.2.5.1 Rising urbanization and ongoing infrastructure initiatives to contribute to market growth
           9.2.6 INDONESIA
                    9.2.6.1 Increasing emphasis on renewable energy and maritime operations to fuel market
           9.2.7 REST OF ASIA PACIFIC
    9.3 EUROPE 
           9.3.1 GERMANY
                    9.3.1.1 Rising emphasis on sustainable construction methods to boost market
           9.3.2 UK
                    9.3.2.1 Booming aircraft component manufacturing industry to augment growth
           9.3.3 FRANCE
                    9.3.3.1 Increasing focus on industrial modernization to support market growth
           9.3.4 ITALY
                    9.3.4.1 Increasing demand from aerospace & defense and marine sectors to fuel market
           9.3.5 TURKEY
                    9.3.5.1 Booming wind energy sector to favor market growth
           9.3.6 REST OF EUROPE
    9.4 NORTH AMERICA 
           9.4.1 US
                    9.4.1.1 Dominant presence of chemical, marine, and automotive industries to boost market
           9.4.2 CANADA
                    9.4.2.1 Rising demand for high-performance materials in building & construction sector to aid growth
           9.4.3 MEXICO
                    9.4.3.1 Growing demand for vinyl ester in pipes & tanks and aerospace & defense sectors to support market growth
    9.5 MIDDLE EAST & AFRICA 
           9.5.1 SAUDI ARABIA
                    9.5.1.1 Need for chemical-resistant materials in transit systems and railway applications to drive growth
           9.5.2 UAE
                    9.5.2.1 Rising use in infrastructure and industrial applications to boost market
           9.5.3 SOUTH AFRICA
                    9.5.3.1 Increased demand for high-performance materials in aerospace and military industries to favor market growth
           9.5.4 REST OF MIDDLE EAST & AFRICA
    9.6 SOUTH AMERICA 
           9.6.1 BRAZIL
                    9.6.1.1 Rising disposable incomes to speed up market growth
           9.6.2 ARGENTINA
                    9.6.2.1 Growing focus on increasing military capabilities to fuel market
           9.6.3 REST OF SOUTH AMERICA
 
10 COMPETITIVE LANDSCAPE (Page No. - 172)
     10.1 INTRODUCTION 
     10.2 KEY PLAYER STRATEGY/RIGHT TO WIN 
             10.2.1 OVERVIEW OF STRATEGIES ADOPTED BY KEY MARKET PLAYERS, 2020–2024
     10.3 REVENUE ANALYSIS, 2019–2023 
     10.4 MARKET SHARE ANALYSIS, 2022–2023 
             10.4.1 INEOS COMPOSITES (US)
             10.4.2 POLYNT S.P.A (ITALY)
             10.4.3 AOC (US)
             10.4.4 INTERPLASTIC CORPORATION (US)
             10.4.5 SWANCOR (TAIWAN)
     10.5 COMPANY EVALUATION MATRIX: KEY PLAYERS, 2023 
             10.5.1 STARS
             10.5.2 EMERGING LEADERS
             10.5.3 PERVASIVE PLAYERS
             10.5.4 PARTICIPANTS
             10.5.5 COMPANY FOOTPRINT: KEY PLAYERS, 2023
                        10.5.5.1 Company footprint
                        10.5.5.2 Product type footprint
                        10.5.5.3 End-use industry footprint
                        10.5.5.4 Region footprint
     10.6 COMPANY EVALUATION MATRIX: STARTUPS/SMES, 2023 
             10.6.1 PROGRESSIVE COMPANIES
             10.6.2 RESPONSIVE COMPANIES
             10.6.3 DYNAMIC COMPANIES
             10.6.4 STARTING BLOCKS
             10.6.5 COMPETITIVE BENCHMARKING: STARTUPS/SMES, 2023
     10.7 COMPANY VALUATION & FINANCIAL METRICS 
     10.8 BRAND/PRODUCT COMPARISON 
             10.8.1 INEOS COMPOSITES
             10.8.2 POLYNT S.P.A.
             10.8.3 AOC
             10.8.4 INTERPLASTIC CORPORATION
             10.8.5 SWANCOR
     10.9 COMPETITIVE SCENARIO 
             10.9.1 DEALS
             10.9.2 EXPANSIONS
 
11 COMPANY PROFILES (Page No. - 191)
     11.1 KEY PLAYERS 
             11.1.1 INEOS COMPOSITES
                        11.1.1.1 Business overview
                        11.1.1.2 Products offered
                        11.1.1.3 MnM view
                                     11.1.1.3.1 Right to win
                                     11.1.1.3.2 Strategic choices
                                     11.1.1.3.3 Weaknesses and competitive threats
             11.1.2 POLYNT S.P.A.
                        11.1.2.1 Business overview
                        11.1.2.2 Products offered
                        11.1.2.3 MnM view
                                     11.1.2.3.1 Right to win
                                     11.1.2.3.2 Strategic choices
                                     11.1.2.3.3 Weaknesses and competitive threats
             11.1.3 AOC
                        11.1.3.1 Business overview
                        11.1.3.2 Products offered
                        11.1.3.3 Recent developments
                                     11.1.3.3.1 Deals
                        11.1.3.4 MnM view
                                     11.1.3.4.1 Right to win
                                     11.1.3.4.2 Strategic choices
                                     11.1.3.4.3 Weaknesses and competitive threats
             11.1.4 INTERPLASTIC CORPORATION
                        11.1.4.1 Business overview
                        11.1.4.2 Products offered
                        11.1.4.3 MnM view
                                     11.1.4.3.1 Right to win
                                     11.1.4.3.2 Strategic choices
                                     11.1.4.3.3 Weaknesses and competitive threats
             11.1.5 SWANCOR
                        11.1.5.1 Business overview
                        11.1.5.2 Products offered
                        11.1.5.3 MnM view
                                     11.1.5.3.1 Right to win
                                     11.1.5.3.2 Strategic choices
                                     11.1.5.3.3 Weaknesses and competitive threats
             11.1.6 REICHHOLD LLC
                        11.1.6.1 Business overview
                        11.1.6.2 Products offered
                        11.1.6.3 MnM view
                                     11.1.6.3.1 Right to win
                                     11.1.6.3.2 Strategic choices
                                     11.1.6.3.3 Weaknesses and competitive threats
             11.1.7 SINO POLYMER CO.
                        11.1.7.1 Business overview
                        11.1.7.2 Products offered
                        11.1.7.3 MnM view
                                     11.1.7.3.1 Right to win
                                     11.1.7.3.2 Strategic choices
                                     11.1.7.3.3 Weaknesses and competitive threats
             11.1.8 RESONAC HOLDINGS CORPORATION
                        11.1.8.1 Business overview
                        11.1.8.2 Products offered
             11.1.9 BÜFA COMPOSITES
                        11.1.9.1 Business overview
                        11.1.9.2 Products offered
                        11.1.9.3 Recent developments
                                     11.1.9.3.1 Deals
             11.1.10 SCOTT BADER COMPANY LTD.
                        11.1.10.1 Business overview
                        11.1.10.2 Products offered
                        11.1.10.3 Recent developments
                                     11.1.10.3.1 Deals
                                     11.1.10.3.2 Expansions
             11.1.11 ALLNEX GMBH
                        11.1.11.1 Business overview
                        11.1.11.2 Products offered
                        11.1.11.3 Recent developments
                                     11.1.11.3.1 Deals
             11.1.12 HEXION INC.
                        11.1.12.1 Business overview
                        11.1.12.2 Products offered
             11.1.13 POLIYA
                        11.1.13.1 Business overview
                        11.1.13.2 Products offered
             11.1.14 DIC CORPORATION
                        11.1.14.1 Business overview
                        11.1.14.2 Products offered
             11.1.15 NIVITEX FIBREGLASS & RESINS
                        11.1.15.1 Business overview
                        11.1.15.2 Products offered
     11.2 OTHER PLAYERS 
             11.2.1 CHANGZHOU TIANMA GROUP CO., LTD.
             11.2.2 MECHEMCO
             11.2.3 ECE BOYA KIMYA
             11.2.4 ANDARA RESINS, LLC
             11.2.5 ORCA COMPOSITES
             11.2.6 SATYEN POLYMERS PVT. LTD.
             11.2.7 ITW PERFORMANCE POLYMERS
             11.2.8 WEE TEE TONG CHEMICALS PTE LTD.
             11.2.9 PLIOGRIP RESINS & CHEMICALS
             11.2.10 CREST SPECIALTY RESINS
             11.2.11 REVEX PLASTICIZERS PVT. LTD.
             11.2.12 RESOLTECH
             11.2.13 PROTECTIVE INDUSTRIAL POLYMERS
             11.2.14 HELIOS RESINS
             11.2.15 ADVANCE COATINGS COMPANY
             11.2.16 ARJAY TECHNOLOGIES

12 ADJACENT AND RELATED MARKETS (Page No. - 245)
     12.1 INTRODUCTION 
     12.2 STUDY LIMITATIONS 
     12.3 INTERCONNECTED MARKETS 
     12.4 EPOXY RESIN MARKET 
             12.4.1 MARKET DEFINITION
             12.4.2 MARKET OVERVIEW
             12.4.3 EPOXY RESIN MARKET, BY PHYSICAL FORM
     12.5 SOLID EPOXY RESIN 
             12.5.1 GROWING DEMAND FOR LIGHTWEIGHT MATERIALS AND HIGH-PERFORMANCE COMPOSITES TO DRIVE MARKET
     12.6 LIQUID EPOXY RESIN 
             12.6.1 INCREASING DEMAND FROM AUTOMOTIVE, OIL & GAS, AND CONSTRUCTION INDUSTRIES TO FUEL MARKET
     12.7 SOLUTION EPOXY RESIN 
             12.7.1 RISING CONSTRUCTION ACTIVITIES AND CONSUMER GOODS MANUFACTURING TO BOOST MARKET

13 APPENDIX (Page No. - 248)
     13.1 DISCUSSION GUIDE 
     13.2 KNOWLEDGESTORE: MARKETSANDMARKETS’ SUBSCRIPTION PORTAL 
     13.3 CUSTOMIZATION OPTIONS 
     13.4 RELATED REPORTS 
     13.5 AUTHOR DETAILS 
 
 
LIST OF TABLES (296 TABLES)
 
TABLE 1 VINYL ESTER MARKET: INCLUSIONS AND EXCLUSIONS
TABLE 2 VINYL ESTER MARKET SNAPSHOT: 2024 VS. 2029
TABLE 3 VINYL ESTER MARKET: PORTER’S FIVE FORCES ANALYSIS
TABLE 4 REAL GDP GROWTH, BY KEY COUNTRY, 2021–2023  (ANNUAL PERCENTAGE CHANGE)
TABLE 5 UNEMPLOYMENT RATE (%), BY KEY COUNTRY, 2021–2023
TABLE 6 INFLATION RATE (%), BY KEY COUNTRY, 2021–2023
TABLE 7 FOREIGN DIRECT INVESTMENT, BY REGION, 2022 VS. 2023
TABLE 8 VINYL ESTER MARKET: ROLE OF COMPANIES IN ECOSYSTEM
TABLE 9 TARIFF DATA FOR HS CODE 390599, 2024
TABLE 10 NORTH AMERICA: REGULATORY BODIES, GOVERNMENT AGENCIES, AND OTHER ORGANIZATIONS
TABLE 11 EUROPE: REGULATORY BODIES, GOVERNMENT AGENCIES, AND OTHER ORGANIZATIONS
TABLE 12 ASIA PACIFIC: REGULATORY BODIES, GOVERNMENT AGENCIES, AND OTHER ORGANIZATIONS
TABLE 13 VINYL ESTER MARKET: KEY CONFERENCES & EVENTS, 2024–2025
TABLE 14 INFLUENCE OF STAKEHOLDERS ON BUYING PROCESS FOR MAJOR END-USE INDUSTRIES (%)
TABLE 15 KEY BUYING CRITERIA FOR MAJOR END-USE INDUSTRIES
TABLE 16 INNOVATIONS AND PATENT REGISTRATIONS
TABLE 17 IMPORT DATA FOR HS CODE 390599, 2019–2023 (USD THOUSAND)
TABLE 18 EXPORT DATA FOR HS CODE 390599, 2019–2023 (USD THOUSAND)
TABLE 19 VINYL ESTER MARKET, BY PRODUCT TYPE, 2020–2022 (USD MILLION)
TABLE 20 VINYL ESTER MARKET, BY PRODUCT TYPE, 2023–2029 (USD MILLION)
TABLE 21 VINYL ESTER MARKET, BY PRODUCT TYPE, 2020–2022 (TONS)
TABLE 22 VINYL ESTER MARKET, BY PRODUCT TYPE, 2023–2029 (TONS)
TABLE 23 BISPHENOL A: VINYL ESTER MARKET, BY REGION, 2020–2022 (USD MILLION)
TABLE 24 BISPHENOL A: VINYL ESTER MARKET, BY REGION, 2023–2029 (USD MILLION)
TABLE 25 BISPHENOL A: VINYL ESTER MARKET, BY REGION, 2020–2022 (TONS)
TABLE 26 BISPHENOL A: VINYL ESTER MARKET, BY REGION, 2023–2029 (TONS)
TABLE 27 NOVOLAC: VINYL ESTER MARKET, BY REGION, 2020–2022 (USD MILLION)
TABLE 28 NOVOLAC: VINYL ESTER MARKET, BY REGION, 2023–2029 (USD MILLION)
TABLE 29 NOVOLAC: VINYL ESTER MARKET, BY REGION, 2020–2022 (TONS)
TABLE 30 NOVOLAC: VINYL ESTER MARKET, BY REGION, 2023–2029 (TONS)
TABLE 31 BROMINATED FIRE RETARDANT: VINYL ESTER MARKET, BY REGION,  2020–2022 (USD MILLION)
TABLE 32 BROMINATED FIRE RETARDANT: VINYL ESTER MARKET, BY REGION,  2023–2029 (USD MILLION)
TABLE 33 BROMINATED FIRE RETARDANT: VINYL ESTER MARKET, BY REGION,  2020–2022 (TONS)
TABLE 34 BROMINATED FIRE RETARDANT: VINYL ESTER MARKET, BY REGION,  2023–2029 (TONS)
TABLE 35 ELASTOMER-MODIFIED: VINYL ESTER MARKET, BY REGION,  2020–2022 (USD MILLION)
TABLE 36 ELASTOMER-MODIFIED: VINYL ESTER MARKET, BY REGION,  2023–2029 (USD MILLION)
TABLE 37 ELASTOMER-MODIFIED: VINYL ESTER MARKET, BY REGION, 2020–2022 (TONS)
TABLE 38 ELASTOMER-MODIFIED: VINYL ESTER MARKET, BY REGION, 2023–2029 (TONS)
TABLE 39 OTHER PRODUCT TYPES: VINYL ESTER MARKET, BY REGION,  2020–2022 (USD MILLION)
TABLE 40 OTHER PRODUCT TYPES: VINYL ESTER MARKET, BY REGION,  2023–2029 (USD MILLION)
TABLE 41 OTHER PRODUCT TYPES: VINYL ESTER MARKET, BY REGION, 2020–2022 (TONS)
TABLE 42 OTHER PRODUCT TYPES: VINYL ESTER MARKET, BY REGION, 2023–2029 (TONS)
TABLE 43 VINYL ESTER MARKET, BY END-USE INDUSTRY, 2020–2022 (USD MILLION)
TABLE 44 VINYL ESTER MARKET, BY END-USE INDUSTRY, 2023–2029 (USD MILLION)
TABLE 45 VINYL ESTER MARKET, BY END-USE INDUSTRY, 2020–2022 (TONS)
TABLE 46 VINYL ESTER MARKET, BY END-USE INDUSTRY, 2023–2029 (TONS)
TABLE 47 PIPES & TANKS: VINYL ESTER MARKET, BY REGION, 2020–2022 (USD MILLION)
TABLE 48 PIPES & TANKS: VINYL ESTER MARKET, BY REGION, 2023–2029 (USD MILLION)
TABLE 49 PIPES & TANKS: VINYL ESTER MARKET, BY REGION, 2020–2022 (TONS)
TABLE 50 PIPES & TANKS: VINYL ESTER MARKET, BY REGION, 2023–2029 (TONS)
TABLE 51 MARINE: VINYL ESTER MARKET, BY REGION, 2020–2022 (USD MILLION)
TABLE 52 MARINE: VINYL ESTER MARKET, BY REGION, 2023–2029 (USD MILLION)
TABLE 53 MARINE: VINYL ESTER MARKET, BY REGION, 2020–2022 (TONS)
TABLE 54 MARINE: VINYL ESTER MARKET, BY REGION, 2023–2029 (TONS)
TABLE 55 WIND ENERGY: VINYL ESTER MARKET, BY REGION, 2020–2022 (USD MILLION)
TABLE 56 WIND ENERGY: VINYL ESTER MARKET, BY REGION, 2023–2029 (USD MILLION)
TABLE 57 WIND ENERGY: VINYL ESTER MARKET, BY REGION, 2020–2022 (TONS)
TABLE 58 WIND ENERGY: VINYL ESTER MARKET, BY REGION, 2023–2029 (TONS)
TABLE 59 FGD & PRECIPITATORS: VINYL ESTER MARKET, BY REGION,  2020–2022 (USD MILLION)
TABLE 60 FGD & PRECIPITATORS: VINYL ESTER MARKET, BY REGION,  2023–2029 (USD MILLION)
TABLE 61 FGD & PRECIPITATORS: VINYL ESTER MARKET, BY REGION, 2020–2022 (TONS)
TABLE 62 FGD & PRECIPITATORS: VINYL ESTER MARKET, BY REGION, 2023–2029 (TONS)
TABLE 63 BUILDING & CONSTRUCTION: VINYL ESTER MARKET, BY REGION,  2020–2022 (USD MILLION)
TABLE 64 BUILDING & CONSTRUCTION: VINYL ESTER MARKET, BY REGION,  2023–2029 (USD MILLION)
TABLE 65 BUILDING & CONSTRUCTION: VINYL ESTER MARKET, BY REGION,  2020–2022 (TONS)
TABLE 66 BUILDING & CONSTRUCTION: VINYL ESTER MARKET, BY REGION,  2023–2029 (TONS)
TABLE 67 LAND TRANSPORTATION: VINYL ESTER MARKET, BY REGION,  2020–2022 (USD MILLION)
TABLE 68 LAND TRANSPORTATION: VINYL ESTER MARKET, BY REGION,  2023–2029 (USD MILLION)
TABLE 69 LAND TRANSPORTATION: VINYL ESTER MARKET, BY REGION, 2020–2022 (TONS)
TABLE 70 LAND TRANSPORTATION: VINYL ESTER MARKET, BY REGION, 2023–2029 (TONS)
TABLE 71 AEROSPACE & DEFENSE: VINYL ESTER MARKET, BY REGION,  2020–2022 (USD MILLION)
TABLE 72 AEROSPACE & DEFENSE: VINYL ESTER MARKET, BY REGION,  2023–2029 (USD MILLION)
TABLE 73 AEROSPACE & DEFENSE: VINYL ESTER MARKET, BY REGION, 2020–2022 (TONS)
TABLE 74 AEROSPACE & DEFENSE: VINYL ESTER MARKET, BY REGION, 2023–2029 (TONS)
TABLE 75 OTHER END-USE INDUSTRIES: VINYL ESTER MARKET, BY REGION,  2020–2022 (USD MILLION)
TABLE 76 OTHER END-USE INDUSTRIES: VINYL ESTER MARKET, BY REGION,  2023–2029 (USD MILLION)
TABLE 77 OTHER END-USE INDUSTRIES: VINYL ESTER MARKET, BY REGION,  2020–2022 (TONS)
TABLE 78 OTHER END-USE INDUSTRIES: VINYL ESTER MARKET, BY REGION,  2023–2029 (TONS)
TABLE 79 VINYL ESTER MARKET, BY REGION, 2020–2022 (USD MILLION)
TABLE 80 VINYL ESTER MARKET, BY REGION, 2023–2029 (USD MILLION)
TABLE 81 VINYL ESTER MARKET, BY REGION, 2020–2022 (TONS)
TABLE 82 VINYL ESTER MARKET, BY REGION, 2023–2029 (TONS)
TABLE 83 ASIA PACIFIC: VINYL ESTER MARKET, BY COUNTRY, 2020–2022 (USD MILLION)
TABLE 84 ASIA PACIFIC: VINYL ESTER MARKET, BY COUNTRY, 2023–2029 (USD MILLION)
TABLE 85 ASIA PACIFIC: VINYL ESTER MARKET, BY COUNTRY, 2020–2022 (TONS)
TABLE 86 ASIA PACIFIC: VINYL ESTER MARKET, BY COUNTRY, 2023–2029 (TONS)
TABLE 87 ASIA PACIFIC: VINYL ESTER MARKET, BY PRODUCT TYPE,  2020–2022 (USD MILLION)
TABLE 88 ASIA PACIFIC: VINYL ESTER MARKET, BY PRODUCT TYPE,  2023–2029 (USD MILLION)
TABLE 89 ASIA PACIFIC: VINYL ESTER MARKET, BY PRODUCT TYPE, 2020–2022 (TONS)
TABLE 90 ASIA PACIFIC: VINYL ESTER MARKET, BY PRODUCT TYPE, 2023–2029 (TONS)
TABLE 91 ASIA PACIFIC: VINYL ESTER MARKET, BY END-USE INDUSTRY,  2020–2022 (USD MILLION)
TABLE 92 ASIA PACIFIC: VINYL ESTER MARKET, BY END-USE INDUSTRY,  2023–2029 (USD MILLION)
TABLE 93 ASIA PACIFIC: VINYL ESTER MARKET, BY END-USE INDUSTRY, 2020–2022 (TONS)
TABLE 94 ASIA PACIFIC: VINYL ESTER MARKET, BY END-USE INDUSTRY, 2023–2029 (TONS)
TABLE 95 CHINA: VINYL ESTER MARKET, BY END-USE INDUSTRY, 2020–2022 (USD MILLION)
TABLE 96 CHINA: VINYL ESTER MARKET, BY END-USE INDUSTRY, 2023–2029 (USD MILLION)
TABLE 97 CHINA: VINYL ESTER MARKET, BY END-USE INDUSTRY, 2020–2022 (TONS)
TABLE 98 CHINA: VINYL ESTER MARKET, BY END-USE INDUSTRY, 2023–2029 (TONS)
TABLE 99 JAPAN: VINYL ESTER MARKET, BY END-USE INDUSTRY, 2020–2022 (USD MILLION)
TABLE 100 JAPAN: VINYL ESTER MARKET, BY END-USE INDUSTRY, 2023–2029 (USD MILLION)
TABLE 101 JAPAN: VINYL ESTER MARKET, BY END-USE INDUSTRY, 2020–2022 (TONS)
TABLE 102 JAPAN: VINYL ESTER MARKET, BY END-USE INDUSTRY, 2023–2029 (TONS)
TABLE 103 INDIA: VINYL ESTER MARKET, BY END-USE INDUSTRY, 2020–2022 (USD MILLION)
TABLE 104 INDIA: VINYL ESTER MARKET, BY END-USE INDUSTRY, 2023–2029 (USD MILLION)
TABLE 105 INDIA: VINYL ESTER MARKET, BY END-USE INDUSTRY, 2020–2022 (TONS)
TABLE 106 INDIA: VINYL ESTER MARKET, BY END-USE INDUSTRY, 2023–2029 (TONS)
TABLE 107 AUSTRALIA & NEW ZEALAND: VINYL ESTER MARKET, BY END-USE INDUSTRY, 2020–2022 (USD MILLION)
TABLE 108 AUSTRALIA & NEW ZEALAND: VINYL ESTER MARKET, BY END-USE INDUSTRY, 2023–2029 (USD MILLION)
TABLE 109 AUSTRALIA & NEW ZEALAND: VINYL ESTER MARKET, BY END-USE INDUSTRY, 2020–2022 (TONS)
TABLE 110 AUSTRALIA & NEW ZEALAND: VINYL ESTER MARKET, BY END-USE INDUSTRY, 2023–2029 (TONS)
TABLE 111 SOUTH KOREA: VINYL ESTER MARKET, BY END-USE INDUSTRY,  2020–2022 (USD MILLION)
TABLE 112 SOUTH KOREA: VINYL ESTER MARKET, BY END-USE INDUSTRY,  2023–2029 (USD MILLION)
TABLE 113 SOUTH KOREA: VINYL ESTER MARKET, BY END-USE INDUSTRY,  2020–2022 (TONS)
TABLE 114 SOUTH KOREA: VINYL ESTER MARKET, BY END-USE INDUSTRY,  2023–2029 (TONS)
TABLE 115 INDONESIA: VINYL ESTER MARKET, BY END-USE INDUSTRY,  2020–2022 (USD MILLION)
TABLE 116 INDONESIA: VINYL ESTER MARKET, BY END-USE INDUSTRY,  2023–2029 (USD MILLION)
TABLE 117 INDONESIA: VINYL ESTER MARKET, BY END-USE INDUSTRY, 2020–2022 (TONS)
TABLE 118 INDONESIA: VINYL ESTER MARKET, BY END-USE INDUSTRY, 2023–2029 (TONS)
TABLE 119 REST OF ASIA PACIFIC: VINYL ESTER MARKET, BY END-USE INDUSTRY,  2020–2022 (USD MILLION)
TABLE 120 REST OF ASIA PACIFIC: VINYL ESTER MARKET, BY END-USE INDUSTRY,  2023–2029 (USD MILLION)
TABLE 121 REST OF ASIA PACIFIC: VINYL ESTER MARKET, BY END-USE INDUSTRY,  2020–2022 (TONS)
TABLE 122 REST OF ASIA PACIFIC: VINYL ESTER MARKET, BY END-USE INDUSTRY,  2023–2029 (TONS)
TABLE 123 EUROPE: VINYL ESTER MARKET, BY COUNTRY, 2020–2022 (USD MILLION)
TABLE 124 EUROPE: VINYL ESTER MARKET, BY COUNTRY, 2023–2029 (USD MILLION)
TABLE 125 EUROPE: VINYL ESTER MARKET, BY COUNTRY, 2020–2022 (TONS)
TABLE 126 EUROPE: VINYL ESTER MARKET, BY COUNTRY, 2023–2029 (TONS)
TABLE 127 EUROPE: VINYL ESTER MARKET, BY PRODUCT TYPE, 2020–2022 (USD MILLION)
TABLE 128 EUROPE: VINYL ESTER MARKET, BY PRODUCT TYPE, 2023–2029 (USD MILLION)
TABLE 129 EUROPE: VINYL ESTER MARKET, BY PRODUCT TYPE, 2020–2022 (TONS)
TABLE 130 EUROPE: VINYL ESTER MARKET, BY PRODUCT TYPE, 2023–2029 (TONS)
TABLE 131 EUROPE: VINYL ESTER MARKET, BY END-USE INDUSTRY,  2020–2022 (USD MILLION)
TABLE 132 EUROPE: VINYL ESTER MARKET, BY END-USE INDUSTRY,  2023–2029 (USD MILLION)
TABLE 133 EUROPE: VINYL ESTER MARKET, BY END-USE INDUSTRY, 2020–2022 (TONS)
TABLE 134 EUROPE: VINYL ESTER MARKET, BY END-USE INDUSTRY, 2023–2029 (TONS)
TABLE 135 GERMANY: VINYL ESTER MARKET, BY END-USE INDUSTRY,  2020–2022 (USD MILLION)
TABLE 136 GERMANY: VINYL ESTER MARKET, BY END-USE INDUSTRY,  2023–2029 (USD MILLION)
TABLE 137 GERMANY: VINYL ESTER MARKET, BY END-USE INDUSTRY, 2020–2022 (TONS)
TABLE 138 GERMANY: VINYL ESTER MARKET, BY END-USE INDUSTRY, 2023–2029 (TONS)
TABLE 139 UK: VINYL ESTER MARKET, BY END-USE INDUSTRY, 2020–2022 (USD MILLION)
TABLE 140 UK: VINYL ESTER MARKET, BY END-USE INDUSTRY, 2023–2029 (USD MILLION)
TABLE 141 UK: VINYL ESTER MARKET, BY END-USE INDUSTRY, 2020–2022 (TONS)
TABLE 142 UK: VINYL ESTER MARKET, BY END-USE INDUSTRY, 2023–2029 (TONS)
TABLE 143 FRANCE: VINYL ESTER MARKET, BY END-USE INDUSTRY,  2020–2022 (USD MILLION)
TABLE 144 FRANCE: VINYL ESTER MARKET, BY END-USE INDUSTRY,  2023–2029 (USD MILLION)
TABLE 145 FRANCE: VINYL ESTER MARKET, BY END-USE INDUSTRY, 2020–2022 (TONS)
TABLE 146 FRANCE: VINYL ESTER MARKET, BY END-USE INDUSTRY, 2023–2029 (TONS)
TABLE 147 ITALY: VINYL ESTER MARKET, BY END-USE INDUSTRY, 2020–2022 (USD MILLION)
TABLE 148 ITALY: VINYL ESTER MARKET, BY END-USE INDUSTRY, 2023–2029 (USD MILLION)
TABLE 149 ITALY: VINYL ESTER MARKET, BY END-USE INDUSTRY, 2020–2022 (TONS)
TABLE 150 ITALY: VINYL ESTER MARKET, BY END-USE INDUSTRY, 2023–2029 (TONS)
TABLE 151 TURKEY: VINYL ESTER MARKET, BY END-USE INDUSTRY,  2020–2022 (USD MILLION)
TABLE 152 TURKEY: VINYL ESTER MARKET, BY END-USE INDUSTRY,  2023–2029 (USD MILLION)
TABLE 153 TURKEY: VINYL ESTER MARKET, BY END-USE INDUSTRY, 2020–2022 (TONS)
TABLE 154 TURKEY: VINYL ESTER MARKET, BY END-USE INDUSTRY, 2023–2029 (TONS)
TABLE 155 REST OF EUROPE: VINYL ESTER MARKET, BY END-USE INDUSTRY,  2020–2022 (USD MILLION)
TABLE 156 REST OF EUROPE: VINYL ESTER MARKET, BY END-USE INDUSTRY,  2023–2029 (USD MILLION)
TABLE 157 REST OF EUROPE: VINYL ESTER MARKET, BY END-USE INDUSTRY,  2020–2022 (TONS)
TABLE 158 REST OF EUROPE: VINYL ESTER MARKET, BY END-USE INDUSTRY,  2023–2029 (TONS)
TABLE 159 NORTH AMERICA: VINYL ESTER MARKET, BY COUNTRY,  2020–2022 (USD MILLION)
TABLE 160 NORTH AMERICA: VINYL ESTER MARKET, BY COUNTRY,  2023–2029 (USD MILLION)
TABLE 161 NORTH AMERICA: VINYL ESTER MARKET, BY COUNTRY, 2020–2022 (TONS)
TABLE 162 NORTH AMERICA: VINYL ESTER MARKET, BY COUNTRY, 2023–2029 (TONS)
TABLE 163 NORTH AMERICA: VINYL ESTER MARKET, BY PRODUCT TYPE,  2020–2022 (USD MILLION)
TABLE 164 NORTH AMERICA: VINYL ESTER MARKET, BY PRODUCT TYPE,  2023–2029 (USD MILLION)
TABLE 165 NORTH AMERICA: VINYL ESTER MARKET, BY PRODUCT TYPE, 2020–2022 (TONS)
TABLE 166 NORTH AMERICA: VINYL ESTER MARKET, BY PRODUCT TYPE, 2023–2029 (TONS)
TABLE 167 NORTH AMERICA: VINYL ESTER MARKET, BY END-USE INDUSTRY,  2020–2022 (USD MILLION)
TABLE 168 NORTH AMERICA: VINYL ESTER MARKET, BY END-USE INDUSTRY,  2023–2029 (USD MILLION)
TABLE 169 NORTH AMERICA: VINYL ESTER MARKET, BY END-USE INDUSTRY,  2020–2022 (TONS)
TABLE 170 NORTH AMERICA: VINYL ESTER MARKET, BY END-USE INDUSTRY,  2023–2029 (TONS)
TABLE 171 US: VINYL ESTER MARKET, BY END-USE INDUSTRY, 2020–2022 (USD MILLION)
TABLE 172 US: VINYL ESTER MARKET, BY END-USE INDUSTRY, 2023–2029 (USD MILLION)
TABLE 173 US: VINYL ESTER MARKET, BY END-USE INDUSTRY, 2020–2022 (TONS)
TABLE 174 US: VINYL ESTER MARKET, BY END-USE INDUSTRY, 2023–2029 (TONS)
TABLE 175 CANADA: VINYL ESTER MARKET, BY END-USE INDUSTRY,  2020–2022 (USD MILLION)
TABLE 176 CANADA: VINYL ESTER MARKET, BY END-USE INDUSTRY,  2023–2029 (USD MILLION)
TABLE 177 CANADA: VINYL ESTER MARKET, BY END-USE INDUSTRY, 2020–2022 (TONS)
TABLE 178 CANADA: VINYL ESTER MARKET, BY END-USE INDUSTRY, 2023–2029 (TONS)
TABLE 179 MEXICO: VINYL ESTER MARKET, BY END-USE INDUSTRY,  2020–2022 (USD MILLION)
TABLE 180 MEXICO: VINYL ESTER MARKET, BY END-USE INDUSTRY,  2023–2029 (USD MILLION)
TABLE 181 MEXICO: VINYL ESTER MARKET, BY END-USE INDUSTRY, 2020–2022 (TONS)
TABLE 182 MEXICO: VINYL ESTER MARKET, BY END-USE INDUSTRY, 2023–2029 (TONS)
TABLE 183 MIDDLE EAST & AFRICA: VINYL ESTER MARKET, BY COUNTRY,  2020–2022 (USD MILLION)
TABLE 184 MIDDLE EAST & AFRICA: VINYL ESTER MARKET, BY COUNTRY,  2023–2029 (USD MILLION)
TABLE 185 MIDDLE EAST & AFRICA: VINYL ESTER MARKET, BY COUNTRY, 2020–2022 (TONS)
TABLE 186 MIDDLE EAST & AFRICA: VINYL ESTER MARKET, BY COUNTRY, 2023–2029 (TONS)
TABLE 187 MIDDLE EAST & AFRICA: VINYL ESTER MARKET, BY PRODUCT TYPE,  2020–2022 (USD MILLION)
TABLE 188 MIDDLE EAST & AFRICA: VINYL ESTER MARKET, BY PRODUCT TYPE,  2023–2029 (USD MILLION)
TABLE 189 MIDDLE EAST & AFRICA: VINYL ESTER MARKET, BY PRODUCT TYPE,  2020–2022 (TONS)
TABLE 190 MIDDLE EAST & AFRICA: VINYL ESTER MARKET, BY PRODUCT TYPE,  2023–2029 (TONS)
TABLE 191 MIDDLE EAST & AFRICA: VINYL ESTER MARKET, BY END-USE INDUSTRY,  2020–2022 (USD MILLION)
TABLE 192 MIDDLE EAST & AFRICA: VINYL ESTER MARKET, BY END-USE INDUSTRY,  2023–2029 (USD MILLION)
TABLE 193 MIDDLE EAST & AFRICA: VINYL ESTER MARKET, BY END-USE INDUSTRY,  2020–2022 (TONS)
TABLE 194 MIDDLE EAST & AFRICA: VINYL ESTER MARKET, BY END-USE INDUSTRY,  2023–2029 (TONS)
TABLE 195 SAUDI ARABIA: VINYL ESTER MARKET, BY END-USE INDUSTRY,  2020–2022 (USD MILLION)
TABLE 196 SAUDI ARABIA: VINYL ESTER MARKET, BY END-USE INDUSTRY,  2023–2029 (USD MILLION)
TABLE 197 SAUDI ARABIA: VINYL ESTER MARKET, BY END-USE INDUSTRY, 2020–2022 (TONS)
TABLE 198 SAUDI ARABIA: VINYL ESTER MARKET, BY END-USE INDUSTRY, 2023–2029 (TONS)
TABLE 199 UAE: VINYL ESTER MARKET, BY END-USE INDUSTRY, 2020–2022 (USD MILLION)
TABLE 200 UAE: VINYL ESTER MARKET, BY END-USE INDUSTRY, 2023–2029 (USD MILLION)
TABLE 201 UAE: VINYL ESTER MARKET, BY END-USE INDUSTRY, 2020–2022 (TONS)
TABLE 202 UAE: VINYL ESTER MARKET, BY END-USE INDUSTRY, 2023–2029 (TONS)
TABLE 203 SOUTH AFRICA: VINYL ESTER MARKET, BY END-USE INDUSTRY,  2020–2022 (USD MILLION)
TABLE 204 SOUTH AFRICA: VINYL ESTER MARKET, BY END-USE INDUSTRY,  2023–2029 (USD MILLION)
TABLE 205 SOUTH AFRICA: VINYL ESTER MARKET, BY END-USE INDUSTRY,  2020–2022 (TONS)
TABLE 206 SOUTH AFRICA: VINYL ESTER MARKET, BY END-USE INDUSTRY,  2023–2029 (TONS)
TABLE 207 REST OF MIDDLE EAST & AFRICA: VINYL ESTER MARKET, BY END-USE INDUSTRY, 2020–2022 (USD MILLION)
TABLE 208 REST OF MIDDLE EAST & AFRICA: VINYL ESTER MARKET, BY END-USE INDUSTRY, 2023–2029 (USD MILLION)
TABLE 209 REST OF MIDDLE EAST & AFRICA: VINYL ESTER MARKET, BY END-USE INDUSTRY, 2020–2022 (TONS)
TABLE 210 REST OF MIDDLE EAST & AFRICA: VINYL ESTER MARKET, BY END-USE INDUSTRY, 2023–2029 (TONS)
TABLE 211 SOUTH AMERICA: VINYL ESTER MARKET, BY COUNTRY,  2020–2022 (USD MILLION)
TABLE 212 SOUTH AMERICA: VINYL ESTER MARKET, BY COUNTRY,  2023–2029 (USD MILLION)
TABLE 213 SOUTH AMERICA: VINYL ESTER MARKET, BY COUNTRY, 2020–2022 (TONS)
TABLE 214 SOUTH AMERICA: VINYL ESTER MARKET, BY COUNTRY, 2023–2029 (TONS)
TABLE 215 SOUTH AMERICA: VINYL ESTER MARKET, BY PRODUCT TYPE,  2020–2022 (USD MILLION)
TABLE 216 SOUTH AMERICA: VINYL ESTER MARKET, BY PRODUCT TYPE,  2023–2029 (USD MILLION)
TABLE 217 SOUTH AMERICA: VINYL ESTER MARKET, BY PRODUCT TYPE, 2020–2022 (TONS)
TABLE 218 SOUTH AMERICA: VINYL ESTER MARKET, BY PRODUCT TYPE, 2023–2029 (TONS)
TABLE 219 SOUTH AMERICA: VINYL ESTER MARKET, BY END-USE INDUSTRY,  2020–2022 (USD MILLION)
TABLE 220 SOUTH AMERICA: VINYL ESTER MARKET, BY END-USE INDUSTRY,  2023–2029 (USD MILLION)
TABLE 221 SOUTH AMERICA: VINYL ESTER MARKET, BY END-USE INDUSTRY,  2020–2022 (TONS)
TABLE 222 SOUTH AMERICA: VINYL ESTER MARKET, BY END-USE INDUSTRY,  2023–2029 (TONS)
TABLE 223 BRAZIL: VINYL ESTER MARKET, BY END-USE INDUSTRY,  2020–2022 (USD MILLION)
TABLE 224 BRAZIL: VINYL ESTER MARKET, BY END-USE INDUSTRY,  2023–2029 (USD MILLION)
TABLE 225 BRAZIL: VINYL ESTER MARKET, BY END-USE INDUSTRY, 2020–2022 (TONS)
TABLE 226 BRAZIL: VINYL ESTER MARKET, BY END-USE INDUSTRY, 2023–2029 (TONS)
TABLE 227 ARGENTINA: VINYL ESTER MARKET, BY END-USE INDUSTRY,  2020–2022 (USD MILLION)
TABLE 228 ARGENTINA: VINYL ESTER MARKET, BY END-USE INDUSTRY,  2023–2029 (USD MILLION)
TABLE 229 ARGENTINA: VINYL ESTER MARKET, BY END-USE INDUSTRY, 2020–2022 (TONS)
TABLE 230 ARGENTINA: VINYL ESTER MARKET, BY END-USE INDUSTRY, 2023–2029 (TONS)
TABLE 231 REST OF SOUTH AMERICA: VINYL ESTER MARKET, BY END-USE INDUSTRY,  2020–2022 (USD MILLION)
TABLE 232 REST OF SOUTH AMERICA: VINYL ESTER MARKET, BY END-USE INDUSTRY,  2023–2029 (USD MILLION)
TABLE 233 REST OF SOUTH AMERICA: VINYL ESTER MARKET, BY END-USE INDUSTRY,  2020–2022 (TONS)
TABLE 234 REST OF SOUTH AMERICA: VINYL ESTER MARKET, BY END-USE INDUSTRY,  2023–2029 (TONS)
TABLE 235 VINYL ESTER MARKET: DEGREE OF COMPETITION
TABLE 236 VINYL ESTER MARKET: PRODUCT TYPE FOOTPRINT
TABLE 237 VINYL ESTER MARKET: END-USE INDUSTRY FOOTPRINT
TABLE 238 VINYL ESTER MARKET: REGION FOOTPRINT
TABLE 239 VINYL ESTER MARKET: DETAILED LIST OF KEY STARTUPS/SMES
TABLE 240 VINYL ESTER MARKET: COMPETITIVE BENCHMARKING OF KEY STARTUPS/SMES
TABLE 241 VINYL ESTER MARKET: DEALS, JANUARY 2020–JULY 2024
TABLE 242 VINYL ESTER MARKET: EXPANSIONS, JANUARY 2020–JULY 2024
TABLE 243 INEOS COMPOSITES: COMPANY OVERVIEW
TABLE 244 INEOS COMPOSITES: PRODUCTS OFFERED
TABLE 245 POLYNT S.P.A.: COMPANY OVERVIEW
TABLE 246 POLYNT S.P.A.: PRODUCTS OFFERED
TABLE 247 AOC: COMPANY OVERVIEW
TABLE 248 AOC: PRODUCTS OFFERED
TABLE 249 AOC: DEALS, JANUARY 2020–JUNE 2024
TABLE 250 INTERPLASTIC CORPORATION: COMPANY OVERVIEW
TABLE 251 INTERPLASTIC CORPORATION: PRODUCTS OFFERED
TABLE 252 SWANCOR: COMPANY OVERVIEW
TABLE 253 SWANCOR: PRODUCTS OFFERED
TABLE 254 REICHHOLD LLC: COMPANY OVERVIEW
TABLE 255 REICHHOLD LLC: PRODUCTS OFFERED
TABLE 256 SINO POLYMER CO.: COMPANY OVERVIEW
TABLE 257 SINO POLYMER CO.: PRODUCTS OFFERED
TABLE 258 RESONAC HOLDINGS CORPORATION: COMPANY OVERVIEW
TABLE 259 RESONAC HOLDINGS CORPORATION: PRODUCTS OFFERED
TABLE 260 BÜFA COMPOSITES: COMPANY OVERVIEW
TABLE 261 BÜFA COMPOSITES: PRODUCTS OFFERED
TABLE 262 BÜFA COMPOSITES: DEALS, JANUARY 2020–JUNE 2024
TABLE 263 SCOTT BADER COMPANY LTD.: COMPANY OVERVIEW
TABLE 264 SCOTT BADER COMPANY LTD.: PRODUCTS OFFERED
TABLE 265 SCOTT BADER COMPANY LTD.: DEALS, JANUARY 2020–JUNE 2024
TABLE 266 SCOTT BADER COMPANY LTD.: EXPANSIONS, JANUARY 2020–JUNE 2024
TABLE 267 ALLNEX GMBH: COMPANY OVERVIEW
TABLE 268 ALLNEX GMBH: PRODUCTS OFFERED
TABLE 269 ALLNEX GMBH: DEALS, JANUARY 2020–JUNE 2024
TABLE 270 ALLNEX GMBH: EXPANSIONS, JANUARY 2020–JUNE 2024
TABLE 271 HEXION INC.: COMPANY OVERVIEW
TABLE 272 HEXION INC.: PRODUCTS OFFERED
TABLE 273 POLIYA: COMPANY OVERVIEW
TABLE 274 POLIYA: PRODUCTS OFFERED
TABLE 275 DIC CORPORATION: COMPANY OVERVIEW
TABLE 276 DIC CORPORATION: PRODUCTS OFFERED
TABLE 277 NIVITEX FIBREGLASS & RESINS: COMPANY OVERVIEW
TABLE 278 NIVITEX FIBREGLASS & RESINS: PRODUCT OFFERED
TABLE 279 CHANGZHOU TIANMA GROUP CO., LTD.: COMPANY OVERVIEW
TABLE 280 MECHEMCO: COMPANY OVERVIEW
TABLE 281 ECE BOYA KIMYA: COMPANY OVERVIEW
TABLE 282 ANDARA RESINS, LLC: COMPANY OVERVIEW
TABLE 283 ORCA COMPOSITES: COMPANY OVERVIEW
TABLE 284 SATYEN POLYMERS PVT LTD.: COMPANY OVERVIEW
TABLE 285 ITW PERFORMANCE POLYMERS: COMPANY OVERVIEW
TABLE 286 WEE TEE TONG CHEMICALS PTE LTD.: COMPANY OVERVIEW
TABLE 287 PLIOGRIP RESINS & CHEMICALS: COMPANY OVERVIEW
TABLE 288 CREST SPECIALTY RESINS: COMPANY OVERVIEW
TABLE 289 REVEX PLASTICIZERS PVT. LTD.: COMPANY OVERVIEW
TABLE 290 RESOLTECH: COMPANY OVERVIEW
TABLE 291 PROTECTIVE INDUSTRIAL POLYMERS: COMPANY OVERVIEW
TABLE 292 HELIOS RESINS: COMPANY OVERVIEW
TABLE 293 ADVANCE COATINGS COMPANY: COMPANY OVERVIEW
TABLE 294 ARJAY TECHNOLOGIES: COMPANY OVERVIEW
TABLE 295 EPOXY RESIN MARKET, BY PHYSICAL FORM, 2019–2022 (USD MILLION)
TABLE 296 EPOXY RESIN MARKET, BY PHYSICAL FORM, 2023–2028 (USD MILLION)
 
 
LIST OF FIGURES (48 FIGURES)
 
FIGURE 1 VINYL ESTER MARKET SEGMENTATION
FIGURE 2 VINYL ESTER MARKET: RESEARCH DESIGN
FIGURE 3 BREAKDOWN OF PRIMARY INTERVIEWS: BY COMPANY TYPE, DESIGNATION,  AND REGION
FIGURE 4 DEMAND-SIDE ANALYSIS
FIGURE 5 MARKET SIZE ESTIMATION METHODOLOGY: BOTTOM-UP APPROACH
FIGURE 6 MARKET SIZE ESTIMATION METHODOLOGY: TOP-DOWN APPROACH
FIGURE 7 METHODOLOGY FOR SUPPLY-SIDE SIZING OF VINYL ESTER MARKET (1/2)
FIGURE 8 METHODOLOGY FOR SUPPLY-SIDE SIZING OF VINYL ESTER MARKET (2/2)
FIGURE 9 VINYL ESTER MARKET: DATA TRIANGULATION
FIGURE 10 ELASTOMER-MODIFIED SEGMENT TO HAVE HIGHEST GROWTH DURING FORECAST PERIOD
FIGURE 11 PIPE & TANKS SEGMENT TO ACCOUNT FOR LARGEST MARKET SHARE DURING FORECAST PERIOD
FIGURE 12 ASIA PACIFIC REGION TO RECORD HIGHEST CAGR IN VINYL ESTER MARKET DURING FORECAST PERIOD
FIGURE 13 INCREASING USE OF VINYL ESTERS IN PIPES & TANKS END-USE INDUSTRY TO DRIVE MARKET
FIGURE 14 ASIA PACIFIC TO DOMINATE MARKET DURING FORECAST PERIOD
FIGURE 15 BISPHENOL A SEGMENT TO LEAD MARKET DURING FORECAST PERIOD
FIGURE 16 FGD & PRECIPITATORS SEGMENT TO REGISTER HIGHEST CAGR DURING FORECAST PERIOD
FIGURE 17 VINYL ESTER MARKET: DRIVERS, RESTRAINTS, OPPORTUNITIES, AND CHALLENGES
FIGURE 18 PRODUCTION OF WIND ELECTRICITY (MW), 2015–2023
FIGURE 19 VINYL ESTER MARKET: PORTER’S FIVE FORCES ANALYSIS
FIGURE 20 VINYL ESTER MARKET: SUPPLY CHAIN ANALYSIS
FIGURE 21 VINYL ESTER MARKET: ECOSYSTEM ANALYSIS
FIGURE 22 VINYL ESTER MARKET: AVERAGE SELLING PRICE, BY REGION (USD/TON)
FIGURE 23 AVERAGE PRICE OF VINYL ESTER, BY PRODUCT TYPE, 2023
FIGURE 24 INFLUENCE OF STAKEHOLDERS ON BUYING PROCESS FOR MAJOR  END-USE INDUSTRIES
FIGURE 25 KEY BUYING CRITERIA FOR MAJOR END-USE INDUSTRIES
FIGURE 26 VINYL ESTER MARKET: PATENT ANALYSIS, 2013–2023
FIGURE 27 IMPORT DATA FOR HS CODE 390599, 2019–2023 (USD THOUSAND)
FIGURE 28 EXPORT DATA FOR HS CODE 390599, 2019–2023 (USD THOUSAND)
FIGURE 29 REVENUE SHIFT IN VINYL ESTER MARKET
FIGURE 30 INVESTMENT & FUNDING SCENARIO
FIGURE 31 VINYL ESTER MARKET, BY PRODUCT TYPE, 2024 VS. 2029 (USD MILLION)
FIGURE 32 VINYL ESTER MARKET, BY END-USE INDUSTRY, 2024 VS. 2029 (USD MILLION)
FIGURE 33 VINYL ESTER MARKET, BY REGION, 2024 VS. 2029 (USD MILLION)
FIGURE 34 ASIA PACIFIC: VINYL ESTER MARKET SNAPSHOT
FIGURE 35 EUROPE: VINYL ESTER MARKET SNAPSHOT
FIGURE 36 NORTH AMERICA: VINYL ESTER MARKET SNAPSHOT
FIGURE 37 REVENUE ANALYSIS OF KEY COMPANIES, 2019–2023
FIGURE 38 MARKET SHARE ANALYSIS OF KEY COMPANIES, 2022–2023
FIGURE 39 VINYL ESTER MARKET: COMPANY EVALUATION MATRIX (KEY PLAYERS), 2023
FIGURE 40 VINYL ESTER MARKET: COMPANY FOOTPRINT
FIGURE 41 VINYL ESTER MARKET: COMPANY EVALUATION MATRIX (STARTUP/SMES), 2023
FIGURE 42 EV/EBIDTA OF KEY PLAYERS
FIGURE 43 COMPANY VALUATION
FIGURE 44 YEAR-TO-DATE (YTD) PRICE TOTAL RETURN AND FIVE-YEAR STOCK BETA  OF KEY MANUFACTURERS
FIGURE 45 BRAND/PRODUCT COMPARISON
FIGURE 46 SWANCOR: COMPANY SNAPSHOT (2023)
FIGURE 47 RESONAC HOLDINGS CORPORATION: COMPANY SNAPSHOT (2023)
FIGURE 48 DIC CORPORATION: COMPANY SNAPSHOT (2023)

The study involved four major activities in estimating the current size of the Vinyl ester market. Exhaustive secondary research was done to collect information on the market, peer markets, and parent market. The next step was to validate these findings, assumptions, and sizing with the industry experts across the vinyl ester value chain through primary research. Both top-down and bottom-up approaches were employed to estimate the complete market size. Thereafter, market breakdown and data triangulation were used to estimate the market size of segments and subsegments.

Secondary Research

Secondary sources for this research study include annual reports, press releases, and investor presentations of companies; white papers; certified publications; and articles by recognized authors; gold- and silver-standard websites; vinyl ester manufacturing companies, regulatory bodies, trade directories, and databases. The secondary research was mainly used to obtain key information about the industry’s supply chain, the total pool of key players, market classification, and segmentation according to industry trends to the bottom-most level and regional markets. It has also been used to obtain information about key developments from a market-oriented perspective.

Primary Research

The Vinyl ester market comprises several stakeholders, such as such as raw material suppliers, technology support providers, and regulatory organizations in the supply chain. Various primary sources from both the supply and demand sides of the market were interviewed to obtain qualitative and quantitative information. Primary sources from the supply side included industry experts such as Chief Executive Officers (CEOs), vice presidents, marketing directors, technology and innovation directors, and related key executives from various key companies and organizations operating in the Vinyl ester market . Primary sources from the demand side included directors, marketing heads, and purchase managers from various sourcing industries. Following is the breakdown of the primary respondents:
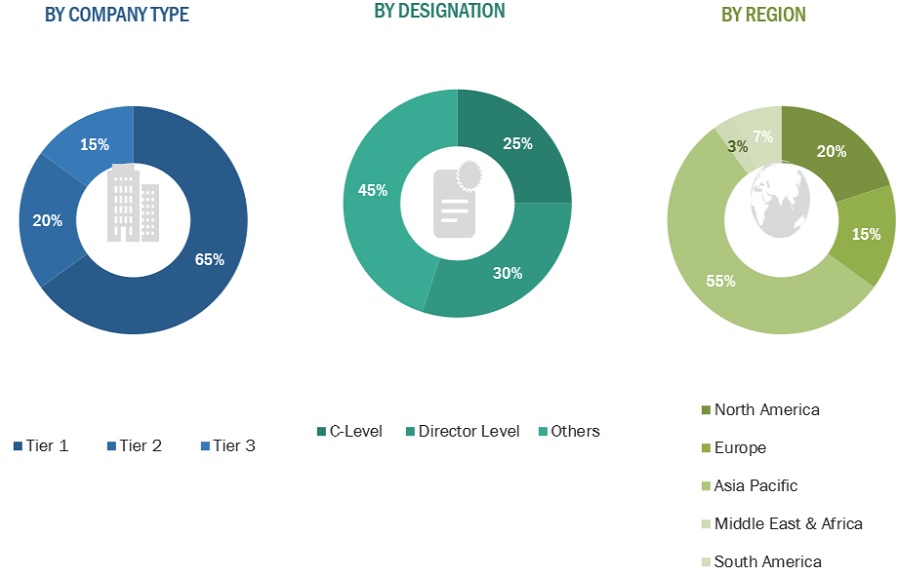
Vinyl Ester Market Size, and Share

To know about the assumptions considered for the study, download the pdf brochure

Market Size Estimation

Both the top-down and bottom-up approaches have been used to estimate and validate the total size of the Vinyl ester market. These approaches have also been used extensively to estimate the size of various dependent subsegments of the market. The research methodology used to estimate the market size included the following:

The following segments provide details about the overall market size estimation process employed in this study

  • The key players in the market were identified through secondary research.
  • The market shares in the respective regions were identified through primary and secondary research.
  • The value chain and market size of the Vinyl ester market, in terms of value, were determined through primary and secondary research.
  • All percentage shares, splits, and breakdowns were determined using secondary sources and verified through primary sources.
  • All possible parameters that affect the market covered in this research study were accounted for, viewed in extensive detail, verified through primary research, and analyzed to obtain the final quantitative and qualitative data.
  • The research included the study of annual and financial reports of the top market players and interviews with industry experts, such as CEOs, VPs, directors, sales managers, and marketing executives, for key insights, both quantitative and qualitative.

Global Vinyl Ester market  Size: Bottom-Up Approach

Vinyl Ester Market Size, and Share

To know about the assumptions considered for the study, Request for Free Sample Report

Global Vinyl Ester market  Size: Top-Down Approach

Vinyl Ester Market Size, and Share

Data Triangulation

After arriving at the overall market size using the market size estimation processes as explained above, the market was split into several segments and sub-segments. To complete the overall market engineering process and arrive at the exact statistics of each market segment and subsegment, the data triangulation and market breakdown procedures were employed, wherever applicable. The data was triangulated by studying various factors and trends from both the demand and supply sides in the oil & gas sector.

Market Definition

Vinyl esters are a type of thermosetting resin produced by esterifying epoxy resins with unsaturated monocarboxylic acids. Vinyl esters, known for their exceptional chemical resistance, mechanical strength, and thermal stability, are frequently utilized in industries that require long-lasting materials that can survive harsh conditions. These resins are highly utilized in end-use industries like maritime, chemical processing, building and construction, and wind energy. Corrosion-resistant pipes and tanks, coatings, and composite materials are some of its common applications in infrastructure, automotive, aerospace, and defense industries. Vinyl esters play an important role in demanding applications due to their versatility and durability in harsh environments.

Key Stakeholders

  • Vinyl ester manufacturers
  • Vinyl ester suppliers
  • Vinyl ester traders
  • Vinyl ester traders, distributors, and suppliers
  • Investment Banks and Private Equity Firms
  • End-use industries operating in the vinyl ester supply chain
  • Government and research organizations
  • Consulting companies/ consultants in the chemicals and materials sectors
  • Industry associations

Report Objectives

  • To analyze and forecast the market size of Vinyl ester market in terms of value
  • To provide detailed information regarding the major factors (drivers, restraints, challenges, and opportunities) influencing the regional market
  • To analyze and forecast the global Vinyl ester market on the basis of product type, end-use, and region
  • To analyze the opportunities in the market for stakeholders and provide details of a competitive landscape for market leaders
  • To forecast the size of various market segments based on four major regions: North America, Europe, Asia Pacific, South America, and the Middle East & Africa, along with their respective key countries
  • To track and analyze the competitive developments, such as acquisitions, partnerships, collaborations, agreements and expansions in the market
  • To strategically profile the key players and comprehensively analyze their market shares and core competencies

Available Customizations

With the given market data, MarketsandMarkets offers customizations according to the client-specific needs.

The following customization options are available for the report:

  • Additional country-level analysis of the Vinyl ester market
  • Profiling of additional market players (up to 5)

Product Analysis

  • Product matrix, which gives a detailed comparison of the product portfolio of each company.
Custom Market Research Services

We will customize the research for you, in case the report listed above does not meet with your exact requirements. Our custom research will comprehensively cover the business information you require to help you arrive at strategic and profitable business decisions.

Request Customization
Report Code
CH 5719
Published ON
Sep, 2024
Choose License Type
BUY NOW
  • SHARE
X
Request Customization
Speak to Analyst
Speak to Analyst
OR FACE-TO-FACE MEETING
PERSONALIZE THIS RESEARCH
  • Triangulate with your Own Data
  • Get Data as per your Format and Definition
  • Gain a Deeper Dive on a Specific Application, Geography, Customer or Competitor
  • Any level of Personalization
REQUEST A FREE CUSTOMIZATION
LET US HELP YOU!
  • What are the Known and Unknown Adjacencies Impacting the Vinyl Ester Market
  • What will your New Revenue Sources be?
  • Who will be your Top Customer; what will make them switch?
  • Defend your Market Share or Win Competitors
  • Get a Scorecard for Target Partners
CUSTOMIZED WORKSHOP REQUEST
  • Call Us
  • +1-888-600-6441 (Corporate office hours)
  • +1-888-600-6441 (US/Can toll free)
  • +44-800-368-9399 (UK office hours)
CONNECT WITH US
ABOUT TRUST ONLINE
©2024 MarketsandMarkets Research Private Ltd. All rights reserved
DMCA.com Protection Status
Website Feedback