Gas Turbine Services Market by Type (Heavy Duty, and Aero-Derivative), Service (Maintenance, Repair, and Overhaul), End-User (Power Generation, Oil & Gas), Service Provider (OEM, and NON-OEM), and Region - Global Forecast to 2021


[157 Pages Report] The global gas turbine services market was valued at USD 14.53 Billion in 2015, and is expected to grow at a CAGR of 4.1% from 2016 to 2021. Major drivers for gas turbine services market include upgradation of aging fleet of gas turbines, rise in gas turbine demand due to increase in shale gas production, and stringent emission norms for gas turbines.
The years considered for the study are as follows:
- Historical Year � 2014
- Base Year � 2015
- Estimated Year � 2016
- Projected Year � 2021
- Forecast Period � 2016 to 2021
2015 has been considered as the base year for company profiles. Whenever information was unavailable for the base year, the prior year has been considered.
Objectives of the Study
- To define, describe, and forecast the global gas turbine services market by type, by end-user, by service provider, by service and region
- To provide detailed information regarding major factors influencing the growth of this market (drivers, restraints, opportunities, industry-specific challenges related to the market)
- To strategically analyze the market with respect to individual growth trends, future prospects, and contribution of each segment to the market
- To strategically profile key players and comprehensively analyze their market shares and core competencies
- To track and analyze competitive developments such as contracts & agreements, expansions, new product developments, and mergers & acquisitions in this market
Research Methodology
This research study involved the use of extensive secondary sources, directories, and databases such as Hoovers, Bloomberg Businessweek, Factiva, and OneSource to identify and collect information useful for a technical, market-oriented, and commercial study of the global market. Primary sources are mainly industry experts from core and related industries, preferred suppliers, manufacturers, distributors, service providers, technology developers, standard and certification organizations of companies, and organizations related to all the segments of this industry�s value chain. The points given below explain the research methodology.
- Study of annual revenue and market developments of major players providing gas turbine services
- Analysis of major applications of and demand for gas turbine services from end-user industries
- Assessment of future trends and industrial growth of end-user industries
- Assessment of the market with respect to the type of services
- Study of market trends in various regions/countries supported by application of gas turbine services in the power generation, oil & gas and other industrial end-users
- Study of contracts and developments related to gas turbine services, for key players, across different regions
- Finalization of overall market sizes by triangulating the supply-side data, which includes product developments, and annual revenue service provider companies of gas turbine services across the globe
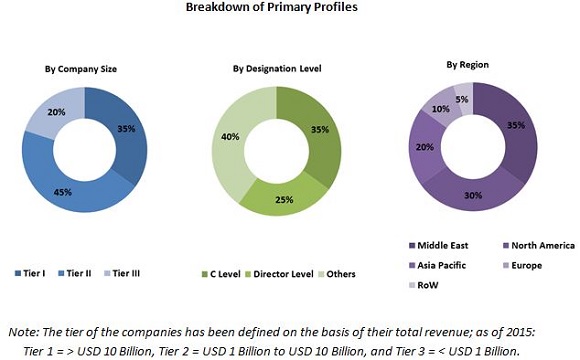
After arriving at the overall market size, the total market has been split into several segments and subsegments. The figure given below shows the breakdown of primaries on the basis of company type, designation, and region, conducted during the research study.
To know about the assumptions considered for the study, download the pdf brochure
Target Audience:
The report�s target audience includes:
- Gas turbine services manufacturers, dealers, and suppliers
- Independent gas turbine service providers
- Government and research organizations
- Environmental and industrial associations
- Banks, venture capitalists, financial institutions, and other investors
- Market research and consulting firms
Scope of the Report:
- By Type
- Heavy-duty
- Aero-derivative
- By Service
- Maintenance
- Repair
- Overhaul
- By End-User
- Power Generation
- Oil & Gas
- Other Industrial
- By Service Provider
- OEM
- NON-OEM
- By Region
- North America
- Europe
- Asia-Pacific
- Latin America
- The Middle East & Africa
Available Customizations:
With the given market data, MarketsandMarkets offers customizations as per the client�s specific needs. The following customization options are available for this report:
Regional Analysis
Further breakdown of region/country-specific analysis
Company Information
Detailed analysis and profiling of additional market players (Up to 5)
The gas turbine services market is projected to grow at a CAGR of 4.1% from 2016 to 2021 to reach a market of USD 18.45 Billion by 2021. The growth is attributed to the up gradation of aging fleet of gas turbines, stringent emission norms for gas turbines and increase in demand of gas turbines owing to the shale gas production boom.
The report segments the gas turbine services market based on end-user industry into power generation, oil & gas and other industrial. The power generation segment is expected to dominate the gas turbine services market followed by oil & gas and other industrial. Rise in gas turbine installation for combined cycle plants, along with the up gradation of current gas turbine fleet drives the market for gas turbine services for power generation segment.
On the basis of service, the gas turbine services market is categorized into maintenance, repair, and overhaul services. The maintenance segment accounted the largest market share in 2015 followed by repair and overhaul segment. Rise in the gas turbine installation will increase the demand for the inspection, monitoring, and preventive & predictive maintenance activities of gas turbines. Thus, driving the market for maintenance services. However, growth rate for overhaul services is slightly higher than the maintenance segment.
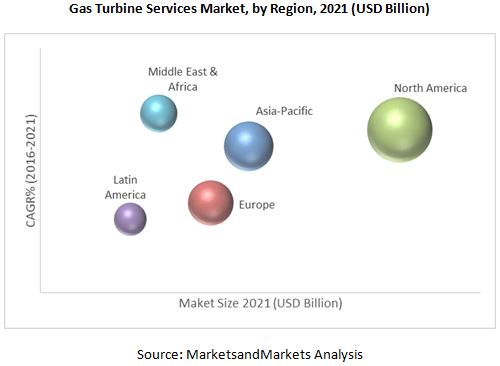
In this report, the gas turbine services market has been analysed with respect to five regions, namely, North America, Europe, Asia-Pacific, Latin America, and the Middle East & Africa. North America is expected to dominate the gas turbine services market owing to upgradation of gas turbine fleet in the U.S. region and also due to the stringent emission norms imposed by government for gas turbines. The Middle East & Africa is projected to grow at the fastest CAGR from 2016 to 2021 owing to increase in gas turbine installation for combined cycle power plants, especially in the Middle East region.
Rise in the gas turbine installation due to shale gas production boom drives the market for gas turbine services. With the rise in the shale gas production there is a rise in gas-fired power generation activities. The low cost natural gas fuel became an attractive option for use in utility power generation, and utilities have embraced natural gas-fired power plants as one the cheapest sources of large scale electricity generation. Increasing focus on renewable energy restricts the market growth of gas turbine services. Also, rising costs of labor, gas turbine spare parts, and transportation will restrict the gas turbine services market. However, the increase in number of combined cycle power plants will create a potential market for gas turbine services market during the forecast period.
Some of the leading players in the gas turbine services market include General Electric Company (U.S.), Siemens AG (Germany), EthosEnergy (U.K), Sulzer AG (Switzerland) and Ansaldo Energia, SpA (Italy). Contracts & agreements was the strategy most commonly adopted by top players in the market, constituting 71% of the total developments from 2014 to 2016. It was followed by mergers & acquisitions strategy.
To speak to our analyst for a discussion on the above findings, click Speak to Analyst
 Exclusive indicates content/data unique to MarketsandMarkets and not available with any competitors.
Table of Contents
1 Introduction (Page No. - 14)
1.1 Objectives of the Study
1.2 Market Definition
1.3 Markets Covered
1.3.1 Countries Covered
1.4 Years Considered for the Study
1.5 Currency
1.6 Limitations
1.7 Stakeholders
2 Research Methodology (Page No. - 18)
2.1 Research Data
2.1.1 Secondary Data
2.1.1.1 Key Data From Secondary Sources
2.1.2 Primary Data
2.1.2.1 Key Data From Primary Sources
2.1.2.2 Key Industry Insights
2.1.2.3 Breakdown of Primaries
2.2 Market Size Estimation
2.2.1 Bottom-Up Approach
2.2.2 Top-Down Approach
2.3 Data Triangulation
2.4 Research Assumptions
2.4.1 Assumptions
3 Executive Summary (Page No. - 26)
3.1 Introduction
3.2 Current Scenario
3.3 Future Trends
3.4 Conclusion
4 Premium Insights (Page No. - 31)
4.1 Attractive Market Opportunities for Gas Turbine Services
4.2 North America: Potential Market to Invest During the Forecast Period
4.3 Power Generation & Maintenance Segment Dominated the Gas Turbine Services Market in 2015
4.4 Gas Turbine Services Market, By Service, 2016�2021
4.5 North America to Dominate Gas Turbine Services for Power Generation Segment
4.6 Gas Turbine Services Market, By Type
5 Market Overview (Page No. - 37)
5.1 Introduction
5.2 Gas Turbine Services Market: Market Segmentation
5.2.1 By Type
5.2.2 By Service Provider
5.2.3 By Service
5.2.4 By End-User
5.2.5 By Region
5.3 Market Dynamics
5.3.1 Drivers
5.3.1.1 Stringent Emission Norms for Gas Turbine
5.3.1.2 Shale Gas Production Boom
5.3.1.3 Upgradation of Aging Fleet of Gas Turbines
5.3.2 Restraints
5.3.2.1 Increasing Focus on Renewable Energy
5.3.2.2 Rising Cost of Spare Parts, Labor Costs, & Transportation Costs
5.3.2.3 In-House Maintenance Hinders Outsourcing Service Opportunities
5.3.3 Opportunities
5.3.3.1 Increase in Number of Combined Cycle Power Plants
5.3.3.2 Rise in Demand for Condition Monitoring Services & Data Analytics
5.3.4 Challenges
5.3.4.1 Availability of Skilled Workforce
5.4 Technical Overview
6 Gas Turbine Services Market, By Type (Page No. - 48)
6.1 Introduction
6.2 Heavy Duty Type
6.3 Aeroderivative Type
7 Gas Turbine Services Market, By Service (Page No. - 53)
7.1 Introduction
7.2 Maintenance
7.3 Repair
7.4 Overhaul
8 Gas Turbine Services Market, By End-User (Page No. - 59)
8.1 Introduction
8.2 Power Generation
8.3 Oil & Gas
8.4 Other Industrial
9 Gas Turbine Services Market, By Service Provider (Page No. - 64)
9.1 Introduction
9.2 OEM Service Providers
9.3 Non-OEM Service Providers
10 Gas Turbine Services Market, By Region (Page No. - 67)
10.1 Introduction
10.2 Asia-Pacific
10.2.1 By Type
10.2.2 By Service Provider
10.2.3 By End-User
10.2.4 By Service
10.2.5 By Country
10.2.5.1 China
10.2.5.2 India
10.2.5.3 Japan
10.2.5.4 South Korea
10.2.5.5 Rest of Asia-Pacific
10.3 Europe
10.3.1 By Type
10.3.2 By Service Provider
10.3.3 By End User
10.3.4 By Service
10.3.5 By Country
10.3.5.1 Russia
10.3.5.2 U.K.
10.3.5.3 Italy
10.3.5.4 Germany
10.3.5.5 Rest of Europe
10.4 North America
10.4.1 By Type
10.4.2 By Service Provider
10.4.3 By End-User
10.4.4 By Service
10.4.5 By Country
10.4.5.1 U.S.
10.4.5.2 Canada
10.5 Middle East & Africa
10.5.1 By Type
10.5.2 By Service Provider
10.5.3 By End User
10.5.4 By Service
10.5.5 By Country
10.5.5.1 Saudi Arabia
10.5.5.2 UAE
10.5.5.3 Iran
10.5.5.4 Egypt
10.5.5.5 Rest of Middle East & Africa
10.6 Latin America
10.6.1 By Type
10.6.2 By Service Provider
10.6.3 By End-User
10.6.4 By Service
10.6.5 By Country
10.6.5.1 Mexico
10.6.5.2 Argentina
10.6.5.3 Brazil
10.6.5.4 Rest of Latin America
11 Competitive Landscape (Page No. - 100)
11.1 Overview
11.2 Competitive Situation & Trends
11.3 Contracts & Agreements
11.4 Mergers & Acquisitions
11.5 Expansions
11.6 Other Developments
12 Company Profiles (Page No. - 107)
(Overview, Products & Services, Strategies & Insights, Developments and MnM View)*
12.1 Introduction
12.2 Ethosenergy
12.3 General Electric Company
12.4 Siemens AG
12.5 Sulzer AG
12.6 Ansaldo Energia Spa
12.7 HPI LLC
12.8 Kawasaki Heavy Industries Ltd.
12.9 MAN Diesel & Turbo Se
12.10 MJB International
12.11 Mechanical Dynamics & Analysis
12.12 Mitsubishi Hitachi Power Systems
12.13 MTU Aero Engines AG
12.14 Proenergy Services LLC
12.15 Solar Turbines, Incorporated
12.16 Turbine Services and Solutions LLC
*Details on Overview, Products & Services, Strategies & Insights, Developments and MnM View Might Not Be Captured in Case of Unlisted Companies.
13 Appendix (Page No. - 149)
13.1 Insights From Industry Experts
13.2 Discussion Guide
13.3 Knowledge Store: Marketsandmarkets� Subscription Portal
13.4 Introducing RT: Real-Time Market Intelligence
13.5 Available Customizations
13.6 Related Reports
13.7 Author Details
List of Tables (65 Tables)
Table 1 Gas Turbine Services By Market Size, By Type, 2014�2021 (USD Million)
Table 2 Heavy Duty: Gas Turbine Services By Market Size, By Region, 2014�2021 (USD Million)
Table 3 Aeroderivative: Gas Turbine Services By Market Size, By Region, 2014�2021 (USD Million)
Table 4 Gas Turbine Services By Market Size, By Service, 2014�2021 (USD Million)
Table 5 Maintenance: Gas Turbine Services By Market Size, By Region, 2014�2021 (USD Million)
Table 6 Repair & Overhaul: Gas Turbine Services By Market Size, By Region, 2014�2021 (USD Million)
Table 7 Overhaul: Gas Turbine Services By Market Size, By Region, 2014�2021 (USD Million)
Table 8 Gas Turbine Services By Market Size, By End-User, 2014�2021 (USD Million)
Table 9 Power Generation: By Market Size, By Region, 2014�2021 (USD Million)
Table 10 Oil & Gas: By Market Size, By Region, 2014�2021 (USD Million)
Table 11 Other Industrial: By Market Size, By Region, 2014�2021(USD Million)
Table 12 Gas Turbine Services By Market Size, By Service Provider, 2014�2021 (USD Million)
Table 13 OEM Service Provider: Gas Turbine Services Market Size, By Region, 2014�2021 (USD Million)
Table 14 Non-OEM Service Providers: Gas Turbine Services Market Size, By Region, 2014�2021 (USD Million)
Table 15 Gas Turbine Services Market Size, By Region, 2014�2021 (USD Million)
Table 16 Asia-Pacific: Gas Turbine Services Market Size, By Type, 2014�2021 (USD Million)
Table 17 Asia-Pacific: By Market Size, By Service Provider, 2014�2021 (USD Million)
Table 18 Asia-Pacific: By Market Size, By End-User, 2014�2021 (USD Million)
Table 19 Asia-Pacific: By Market Size, By Service , 2014�2021 (USD Million)
Table 20 Asia-Pacific: By Market Size, By Country, 2014�2021 (USD Million)
Table 21 China: Gas Turbine Services Market Size, By Service, 2014�2021 (USD Million)
Table 22 India: Market Size, By Service, 2014�2021 (USD Million)
Table 23 Japan: Market Size, By Service, 2014�2021 (USD Million)
Table 24 South Korea: Market Size, By Service, 2014�2021 (USD Million)
Table 25 Rest of Asia-Pacific: Market Size, By Service, 2014�2021 (USD Million)
Table 26 Europe: Gas Turbine Services Market Size, By Type, 2014�2021 (USD Million)
Table 27 Europe: By Market Size, By Service Provider, 2014�2021 (USD Million)
Table 28 Europe: By Market Size, By End-User, 2014�2021(USD Million)
Table 29 Europe: By Market Size, By Service, 2014�2021 (USD Million)
Table 30 Europe: By Market Size, By Country, 2014�2021 (USD Million)
Table 31 Russia: Gas Turbine Services Market Size, By Service, 2014�2021 (USD Million)
Table 32 U.K.: Market Size, By Service, 2014�2021 (USD Million)
Table 33 Italy: Market Size, By Service, 2014�2021 (USD Million)
Table 34 Germany: Market Size, By Service, 2014�2021 (USD Million)
Table 35 Rest of Europe: Market Size, By Service, 2014�2021 (USD Million)
Table 36 North America: By Market Size, By Type, 2014�2021 (USD Million)
Table 37 North America: By Market Size, By Service Provider, 2014�2021 (USD Million)
Table 38 North America: By Market Size, By End-User, 2014�2021 (USD Million)
Table 39 North America: By Market Size, By Service, 2014�2021 (USD Million)
Table 40 North America: By Market Size, By Country, 2014�2021 (USD Million)
Table 41 U.S.: Gas Turbine Services Market Size, By Service, 2014�2021 (USD Million)
Table 42 Canada: Market Size, By Service, 2014�2021 (USD Million)
Table 43 Middle East & Africa: Market Size, By Type, 2014�2021 (USD Million)
Table 44 Middle East & Africa: By Market Size, By Service Provider, 2014�2021 (USD Million)
Table 45 Middle East & Africa: By Market Size, By End User, 2014�2021 (USD Million)
Table 46 Middle East & Africa: By Market Size, By Service, 2014�2021 (USD Million)
Table 47 Middle East & Africa: By Market Size, By Country, 2014�2021 (USD Million)
Table 48 Saudi Arabia: Gas Turbine Services Market Size, By Service, 2014�2021 (USD Million)
Table 49 UAE: Market Size, By Service, 2014�2021 (USD Million)
Table 50 Iran: Market Size, By Service, 2014�2021 (USD Million)
Table 51 Egypt: Market Size, By Service, 2014�2021 (USD Million)
Table 52 Rest of Middle East & Africa: Market Size, By Service, 2014�2021 (USD Million)
Table 53 Latin America: Market Size, By Type, 2014�2021 (USD Million)
Table 54 Latin America: By Market Size, By Service Provider, 2014�2021 (USD Million)
Table 55 Latin America: By Market Size, By End-User, 2014�2021 (USD Million)
Table 56 Latin America: By Market Size, By Service, 2014�2021 (USD Million)
Table 57 Latin America: By Market Size, By Country, 2014�2021 (USD Million)
Table 58 Mexico: By Market Size, By Service, 2014�2021 (USD Million)
Table 59 Argentina: By Market Size, By Service, 2014�2021 (USD Million)
Table 60 Brazil: By Market Size, By Service, 2014�2021 (USD Million)
Table 61 Rest of Latin America: By Market Size, By Service, 2014�2021 (USD Million)
Table 62 Contracts & Agreements, 2014�2016
Table 63 Mergers & Acquisitions, 2015�2016
Table 64 Expansions, 2016
Table 65 Other Developments, 2014-2016
List of Figures (47 Figures)
Figure 1 Market Segmentation: Gas Turbine Services
Figure 2 Gas Turbine Services Market: Research Design
Figure 3 Bottom-Up Approach
Figure 4 Top-Down Approach
Figure 5 Gas Turbine Market: Data Triangulation
Figure 6 Assumptions of the Research Study
Figure 7 Gas Turbine Services Market, By Region, 2015
Figure 8 Market Share, By Service, 2015
Figure 9 Market, By Region, 2016 vs 2021 (USD Billion)
Figure 10 North America: Potential Market to Demand Gas Turbine Services for Power Generation End-Use Segment
Figure 11 Upgradation of Aging Fleet of Gas Turbines Will Drive the Market for Gas Turbine Services
Figure 12 North America Dominated the Gas Turbine Services Market in 2015
Figure 13 Gas Turbine Services Market By Service vs By End-User, 2015
Figure 14 Maintenance Segment is Expected to Hold More Than Half of the Gas Turbine Services Market Size During the Forecast Period
Figure 15 Demand for Gas Turbine Services, By End-User, is Expected to Be Highest in North America
Figure 16 Heavy-Duty Type of Gas Turbine is Expected to Dominate the Gas Turbine Services Market, By Type
Figure 17 Market Segmentation of Gas Turbine Services Market
Figure 18 Gas Turbine Services: Market Dynamics
Figure 19 Gas-Fired Combustion Plants: Emission Limit Values (Mg/Nm3) for Nox & Co in Europe
Figure 20 U.S.: Natural Gas Expected to Surpass Coal in Mix of Fuel Used for Power Generation in 2016
Figure 21 Gas Turbine Orderbook for Power Generation, By Region, 2014 & 2015
Figure 22 Heavy Duty Type of Gas Turbine is Expected to Dominate the Gas Turbine Services Market During the Forecast Period
Figure 23 Maintenance Segment is Estimated to Hold the Largest Market Share (By Value) in 2015
Figure 24 Installed Capacity (GW) for Gas Turbines (<10 Years) for Middle East & Africa Region, 2010�2015
Figure 25 Installed Capacity (GW) for Gas Turbines in North America in the 10 to 20 Years Age Range, 2010�2015
Figure 26 Power Generation Segment is Estimated to Hold the Largest Market Share (By Value) in 2015
Figure 27 Market Share (Value), By Region, 2015
Figure 28 Regional Snapshot: Asia-Pacific Offers Attractive Market Opportunities
Figure 29 Regional Snapshot: Europe
Figure 30 Regional Snapshot: North America
Figure 31 Companies Adopted Various Growth Strategies From 2014 to 2016
Figure 32 Battle for Market Share: Contracts & Agreements Was the Key Strategy Adopted By the Top Players, 2014�2016
Figure 33 Market Share Analysis: General Electric Company Accounted for the Largest Market Share (Value) in 2015
Figure 34 Market Evolution Framework: Contracts & Agreements Led to Market Growth, 2014�2016
Figure 35 Regional Revenue Mix of the Top 5 Players
Figure 36 Ethosenergy: Company Snapshot
Figure 37 Ethosenergy: SWOT Analysis
Figure 38 General Electric Company: Company Snapshot
Figure 39 General Electric Company: SWOT Analysis
Figure 40 Siemens AG: Company Snapshot
Figure 41 Siemens AG: SWOT Analysis
Figure 42 Sulzer AG: Company Snapshot
Figure 43 Sulzer AG: SWOT Analysis
Figure 44 Ansaldo Energia: Company Snapshot
Figure 45 Kawasaki Heavy Industries Ltd.: Company Snapshot
Figure 46 MAN Diesel & Turbo SE: Company Snapshot
Figure 47 MTU Aero Engines AG: Company Snapshot


Growth opportunities and latent adjacency in Gas Turbine Services Market