Gasification Market by Gasifier Type (Moving/Fixed Bed, Fluidized Bed, Entrained & Others), by Feedstock (Biomass/Waste, Coal, Natural Gas & Petroleum), by Application (Chemicals, Liquid Fuels, Power & Gas Fuels) and Geography - Global Trends and Forecasts (2014 - 2019)


[240 Pages Report] The demand for gasification as a substitute for clean energy supply is growing constantly with its increased acceptance. The gasification process has found increased application in the municipal sector as well as the industrial sectors of oil and gas, chemicals, power, and others.
The demand for gasification has been estimated from the demand side in terms of volume (in MW). The report also discusses the drivers, restraints, and opportunities of the market which is directly dependent on the global gasification market. The report also tracks the activities of dominant market players and the strategies adopted by them through their contract agreements, new launches, expansions, joint ventures and others which include achievements and mergers & acquisitions.
Global Gasification Market Size, by Geography (MW)
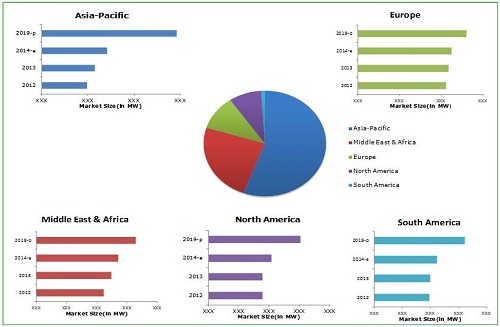
Source: MarketsandMarkets Analysis
The above figure shows the gasification market size (in MW) for various geographies for 2012 and 2019. Asia-Pacific market is the most dominant with the largest market share at present.
Major players in gasification are Royal Dutch Shell (The Netherlands), General Electric (GE)(U.S.), Air Liquide (France) and SEDIN Engineering Company Limited (China), who enjoy dominant positions in the market.
In order to get an in-depth understanding of the competition in the market, the report gives a detailed profile of ten key players in the market. The segmentation adopted for the gasification market in the report is as follows:
By Feedstock
- Biomass/Waste
- Coal
- Natural Gas
- Petroleum
By Geography
- Asia-Pacific
- Europe
- Middle East & Africa
- North America
- South America
By Application
- Chemicals
- Liquid Fuels
- Power
- Gas Fuels
By Gasifier type
- Moving/Fixed Bed
- Fluidized Bed
- Entrained
- Others (Plasma, FCC-Fluid Catalytic Cracking )
Major companies with their market revenues are covered for each of the regions. The report also deals with the market share by participants for the overall market and describes the competitive strategies adopted by these players. The gasification market segmentation is also done on the basis of applications. The leading players of the industry have also been profiled with their recent developments and other strategic industry activities. A few top players in the industry are Royal Dutch Shell (The Netherlands), General Electric (GE)(U.S.), Air Liquide (France), SEDIN Engineering Company Limited (China), Mitsubishi Heavy Industries (Japan), Siemens (Germany), KBR (U.S), Synthesis Energy Systems Inc. (U.S.), CB&I(The Netherlands) and ThyssenKrupp AG (Germany).
The global gasification market is estimated to achieve 208,684.0 MW by 2019 at a projected CAGR of 11.6%, indicating higher growth in the Asia-Pacific. Gasification is used for converting organic or carbonaceous materials into synthesis gas (syngas) and other end-products, which can be used in the chemical industry, transportation fuel, fertilizer industry, solvents, power generation, and others.
The syngas produced worldwide is forecast in MW thermal. Rate of innovation or launch of new products of gasifiers has slow movement in the market. Other competitive developments are also analyzed such as expansions, contract agreements, joint ventures and mergers & acquisitions among others.
The global gasification market has witnessed attractive growth in the Asia-Pacific region due to abundant resource availability in this area, and increased demand for energy. The biggest market for gasification is held by the Asia-Pacific region among Europe, the Middle East & Africa, North America, and South America.
Global Gasification Market Share (Volume), by Geography
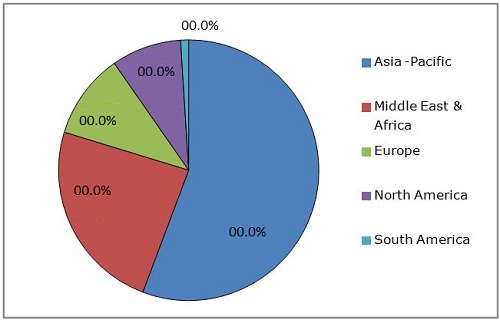
Source: Related Publications and MarketsandMarkets Analysis
 Exclusive indicates content/data unique to MarketsandMarkets and not available with any competitors.
Table Of Contents
1 Introduction (Page No. - 15)
1.1 Key Takeaways
1.2 Analyst Insights
1.3 Report Description
1.4 Market Definitions
1.5 Market Segmentation & Aspects Covered
1.6 Stakeholders
1.7 Research Methodology
1.7.1 Approach
1.7.2 Market Size Estimation
1.8 Market Crackdown & Data Triangulation
1.9 Key Data Points Taken From Secondary Sources
1.10 Key Secondary Sources Used
1.11 Key Data Points Taken From Primary Sources
1.12 Assumptions Made For This Report
2 Executive Summary (Page No. - 26)
3 Premium Insights (Page No. - 29)
3.1 Asia-Pacific Dominates the Global Market
3.2 Environmental Policy Driving Markets of Asia-Pacific
3.3 Market Share Scenario
3.4 Current Market & Growth Analysis
3.5 Gasification Market Strategies
3.6 Timeline For Gasification Developments
3.7 Regional Market Lifecycle
3.8 Entrained Bed Gasifier Holds the Largest Share (By Volume) in Gasification Market
4 Market Overview (Page No. - 40)
4.1 Introduction
4.2 Market Segmentation
4.2.1 By Gasifier Type
4.2.2 By Feedstock Type
4.2.3 By Application
4.2.4 By Geography
4.3 Value Chain Analysis
4.3.1 Feedstock
4.3.2 Gasifier
4.3.3 Gas Cleanup
4.3.4 Clean Syngas
4.3.5 Product Generation
4.3.6 Energy Generation
4.4 Supply Chain Analysis
4.4.1 Gasification Supply Chain Analysis
4.5 Market Dynamics
4.5.1 Market Drivers
4.5.1.1 Vast Resources and Worldwide Deposits of Coal
4.5.1.2 Clean Energy
4.5.1.3 Cheap End-Product
4.5.2 Market Restraints
4.5.2.1 High Capital Expenditure
4.5.2.2 Competition From Other Economical Energy Sources
4.5.3 Opportunities
4.5.3.1 Biomass/Waste Feedstock
4.5.4 Burning Issues
4.5.4.1 Development of Underground Coal Gasification Technology
4.5.5 Winning Imperatives
4.5.5.1 New Product Launches For Superior Gasification Technology
4.6 Porter�s Five Forces Analysis
4.6.1 Threat of New Entrants
4.6.2 Power of Suppliers
4.6.3 Power of Buyers
4.6.4 Threat of Product Substitutes
4.6.5 Intensity of Rivalry
5 Global Gasification Market, By Application (Page No. - 61)
5.1 Introduction
5.2 Chemicals Application Market
5.2.1 Asia-Pacific
5.2.2 Europe
5.2.3 Middle East & Africa
5.2.4 North America
5.2.5 South America
5.3 Liquid Fuels Application Market
5.3.1 Asia-Pacific
5.3.2 Middle East & Africa
5.4 Power Application Market
5.4.1 Asia-Pacific
5.4.2 Europe
5.4.3 North America
5.5 Gas Fuels Application Market
5.5.1 Asia-Pacific
5.5.2 Europe
5.5.3 North America
5.5.4 South America
6 Gasification Market, By Feedstock Type (Page No. - 88)
6.1 Introduction
6.2 Coal Feedstock Market, By Geography
6.3 Natural Gas Feedstock Market, By Geography
6.4 Petroleum Feedstock Market, By Geography
6.5 Biomass/Waste Feedstock Market, By Geography
7 Global Gasification Market, By Gasifier Type (Page No. - 99)
7.1 Introduction
7.2 Entrained Gasifier Type Market, By Geography
7.3 Moving/Fixed Bed Gasifier Market Size, By Geography
7.4 Fluidized Bed Type Market, By Geography
7.5 Other Gasifier Type Market, By Geography
8 Gasification Market, By Geography (Page No. - 109)
8.1 Introduction
8.2 Asia-Pacific
8.2.1 Overview
8.2.2 China
8.2.3 Japan
8.2.4 India
8.2.5 Malaysia
8.2.6 Singapore
8.2.7 South Korea
8.2.8 Others
8.3 The Middle East & Africa
8.3.1 Overview
8.3.2 South Africa
8.3.3 Qatar
8.3.4 Others
8.4 Europe
8.4.1 Overview
8.4.2 Germany
8.4.3 Italy
8.4.4 Czech Republic
8.4.5 Netherlands
8.4.6 Spain
8.4.7 U.K.
8.4.8 France
8.4.9 Sweden
8.4.10 Others
8.5 North America
8.5.1 Overview
8.5.2 U.S.
8.5.3 Canada
8.6 South America
8.6.1 Overview
8.6.2 Brazil
8.6.3 Dominican Republic
9 Competitive Landscape (Page No. - 160)
9.1 Introduction
9.2 Key Players of the Gasification Market
9.2.1 List of Key Players
9.3 Growth Strategies in the Gasification Market
9.4 Most Active Companies in the Market
9.5 Market Share Analysis
9.5.1 Market Rankings of the Industry Players
9.6 Contract Agreements
9.7 New Launches
9.8 Expansions
9.9 Joint Ventures
9.10 Other Developments
10 Company Profiles (Page No. - 182)
10.1 Air Liquide
10.2 Cb&I
10.3 General Electric
10.4 Kbr Inc.
10.5 Mitsubishi Heavy Industries Ltd.
10.6 Royal Dutch Shell Plc
10.7 Sedin Engineering Company Limited
10.8 Siemens
10.9 Synthesis Energy Systems Inc.
10.10 Thyssenkrupp AG
List of Tables (64 Tables)
Table 1 Gasification Market Size, By Technology, 2014-2019 (MW)
Table 2 Global Gasification Market Size, By Application, 2012�2019 (MW)
Table 3 Chemicals Market: Gasification Market Size, By Geography, 2012�2019 (MW)
Table 4 Asia-Pacific: Chemicals Application Market Size, By Country, 2012�2019 (MW)
Table 5 Europe: Chemicals Application Market Size, By Country, 2012�2019 (MW)
Table 6 North America: Chemicals Application Market Size, By Country, 2012�2019 (MW)
Table 7 South America: Chemicals Application Market Size, By Country, 2012�2019 (MW)
Table 8 Liquid Fuels Market: Gasification Market Size, By Geography, 2012�2019 (MW)
Table 9 Asia-Pacific: Liquid Fuels Application Market Size, By Country, 2012�2019 (MW)
Table 10 Middle East & Africa: Liquid Fuels Application Market Size, By Country, 2012�2019 (MW)
Table 11 Power Application: Gasification Market Size, By Geography 2012�2019 (MW)
Table 12 Asia-Pacific: Power Application Market Size, By Country, 2012�2019 (MW)
Table 13 Europe: Power Application Market Size, By Country, 2012�2019 (MW)
Table 14 Gas Fuels Application: Gasification Market Size, By Geography 2012�2019 (MW)
Table 15 Asia-Pacific: Gas Fuels Application Market Size, By Country, 2012�2019 (MW)
Table 16 Europe: Gas Fuels Application Market Size, By Country, 2012�2019 (MW)
Table 17 North America: Gas Fuels Application Market Size, By Country, 2012�2019 (MW)
Table 18 Gasification Market Size, By Feedstock Type, 2012�2019 (MW)
Table 19 Coal Feedstock Market Size, By Geography, 2012�2019 (MW)
Table 20 Natural Gas Feedstock Market Size, By Geography, 2012�2019 (MW)
Table 21 Petroleum Feedstock Type Market Size, By Geography, 2012�2019 (MW)
Table 22 Biomass/Waste Feedstock Market Size, By Geography, 2012�2019 (MW)
Table 23 Gasification Market Size, By Gasifier Type, 2012�2019 (MW)
Table 24 Entrained Gasifier Market Size, By Geography, 2012�2019 (MW)
Table 25 Moving/Fixed Bed Gasifier Market Size, By Geography, 2012�2019 (MW)
Table 26 Fluidized Gasifier Market Size, By Geography, 2012�2019 (MW)
Table 27 Other Gasifier Market Size, By Geography, 2012�2019 (MW)
Table 28 Gasification Market Size , By Geography, 2012�2019 (MW)
Table 29 Asia-Pacific: Gasification Market Size, By Gasifier Type, 2012�2019 (MW)
Table 30 Asia-Pacific: Market Size, By Feedstock Type, 2012�2019 (MW)
Table 31 Asia-Pacific: Market Size, By Geography, 2012�2019 (MW)
Table 32 China: Gasification Market Size, By Application, 2012�2019 (MW)
Table 33 Japan: Market Size, By Application, 2012�2019 (MW)
Table 34 India: Gasification Market Size, By Application, 2012�2019 (MW)
Table 35 Singapore: Gasification Market Size, By Application, 2012�2019 (MW)
Table 36 South Korea: Market Size, By Application, 2012�2019 (MW)
Table 37 Other Countries: Gasification Market Size, By Application, 2012�2019 (MW)
Table 38 Middle East & Africa: Market Size, By Gasifier Type, 2012�2019 (MW)
Table 39 Middle East & Africa: Market Size, By Feedstock Type, 2012�2019 (MW)
Table 40 Middle East & Africa: Gasification Market Size, By Geography, 2012�2019 (MW)
Table 41 Other Countries: Gasification Market Size, By Application, 2012�2019 (MW)
Table 42 Europe: Gasification Market Size, By Gasifier Type, 2012�2019 (MW)
Table 43 Europe: Market Size, By Feedstock Type, 2012�2019 (MW)
Table 44 Europe: Market Size, By Geography, 2012�2019 (MW)
Table 45 Germany: Gasification Market Size, By Application, 2012�2019 (MW)
Table 46 Italy: Gasification Market Size, By Application, 2012�2019 (MW)
Table 47 Czech Republic: Market Size, By Application, 2012�2019 (MW)
Table 48 Netherlands: Gasification Market Size, By Application, 2012�2019 (MW)
Table 49 Spain: Gasification Market Size, By Application, 2012�2019 (MW)
Table 50 U.K.: Gasification Market Size, By Application, 2012�2019 (MW)
Table 51 France: Market Size, By Application, 2012�2019 (MW)
Table 52 Sweden: Gasification Market Size, By Application, 2012�2019 (MW)
Table 53 Other Countries: Gasification Market Size, By Application, 2012�2019 (MW)
Table 54 North America: Gasification Market Size, By Gasifier Type, 2012�2019 (MW)
Table 55 North America: Market Size, By Feedstock Type, 2012�2019 (MW)
Table 56 North America: Market Size, By Country, 2012�2019 (MW)
Table 57 U.S.: Gasification Market Size, By Application, 2012�2019 (MW)
Table 58 Canada: Gasification Market Size, By Application, 2012�2019 (MW)
Table 59 South America:Gasification Market Size, By Geography, 2012�2019 (MW)
Table 60 Annual Contract Agreements,2006 � 2014
Table 61 New Launches, 2008-2014
Table 62 Expansions, 2011-2014
Table 63 Joint Ventures, 2011-2013
Table 64 Other Developments, 2012-2013
List of Figures (47 Figures)
Figure 1 Research Methodology
Figure 2 Data Triangulation Method
Figure 3 Gasification Market Share (Volume), By Application, 2013
Figure 4 Gasification Market Regional Scenario (Mw), 2012-2019
Figure 5 Market Share Comparision, 2013�2019
Figure 6 Top Players: Market Share (Value), 2013
Figure 7 Market Estimation, 2013 & Growth Analysis, 2014-2019
Figure 8 Timeline: Gasification Market
Figure 9 Market Lifecycle
Figure 10 Global Gasification Market Share (Volume), By Gasifier Type, 2013
Figure 11 Gasification Market Share (Volume), By Gasifier Type, 2013
Figure 12 Gasification Market Share (Volume), By Feedstock Type, 2013
Figure 13 Gasification Market Share (Volume), By Application 2013
Figure 14 Gasification Market Share (Volume), By Geography 2013
Figure 15 Value Chain Analysis Of The Gasification Market
Figure 16 Supply Chain Analysis Of The Gasification Market
Figure 17 Steps Of Gasification Process
Figure 18 Porter�s Five Forces Analysis
Figure 19 Global Gasification Market Size, 2012�2019 (Mw)
Figure 20 Global Gasification Market Share (Volume), By Application, 2013
Figure 21 Middle East & Africa: Chemicals Application Market Size, 2012�2019 (Mw)
Figure 22 North America: Power Application Market Size, 2012�2019 (Mw)
Figure 23 South America: Gas Fuels Application Market Size, 2012�2019 (Mw)
Figure 24 Gasification: Market Share (Volume), By Feedstock Type, 2013 (Mw)
Figure 25 Gasification Market Share (Volume), By Gasifier Type, 2013 (Mw)
Figure 26 Gasification Market Share (Volume), By Region, 2013
Figure 27 Asia-Pacific: Gasification Market Share (Volume), By Country, 2013
Figure 28 Malaysia: Gasification Market, By Application (Volume), 2012�2019 (Mw)
Figure 29 Middle East & Africa: Gasification Market Share (Volume), By Country, 2013
Figure 30 South Africa: Gasification Market Size, By Application, 2012�2019 (Mw)
Figure 31 Qatar: Gasification Market Size, By Application, 2012�2019 (Mw)
Figure 32 Europe: Gasification Market Share (Volume), By Country,2013
Figure 33 North America: Gasification Market Share (Volume), By Country, 2013
Figure 34 South America: Market Share (Volume), By Country, 2013
Figure 35 South America: Gasification Market Size, By Type, 2012�2019 (Mw)
Figure 36 South America: Market Size, By Feedstock Type, 2012�2019 (Mw)
Figure 37 Brazil: Gasification Market Size, By Application, 2012�2019 (Mw)
Figure 38 Dominican Republic: Gasification Market Size, By Application, 2012�2019 (Mw)
Figure 39 Gasification Market: Number Of Developments 2006�2014
Figure 40 Gasification Market Development Share (Volume), By Growth Strategy, 2006�2014
Figure 41 Gasification Market Activities, By Key Players, 2006�2014
Figure 42 Market Share (Value) Analysis, By Company, 2013
Figure 43 Contract Agreeement Analysis, 2006�2014
Figure 44 New Launches Analysis, 2008�2014
Figure 45 Expansions Analysis, 2010�2014
Figure 46 Joint Ventures Analysis, 2011�2013
Figure 47 Other Developments Analysis, 2012�2013


Growth opportunities and latent adjacency in Gasification Market