
Hydrogen Generation Market

Hydrogen Generation Market by Technology (SMR, ATR, POX, Coal Gasification, Electrolysis), Application (Refinery, Ammonia, Methanol, Transportation, Power Generation), Source (Blue, Green, Gray), Generation & Delivery Mode, Region - Global Forecast to 2030


OVERVIEW
Source: Secondary Research, Interviews with Experts, MarketsandMarkets Analysis
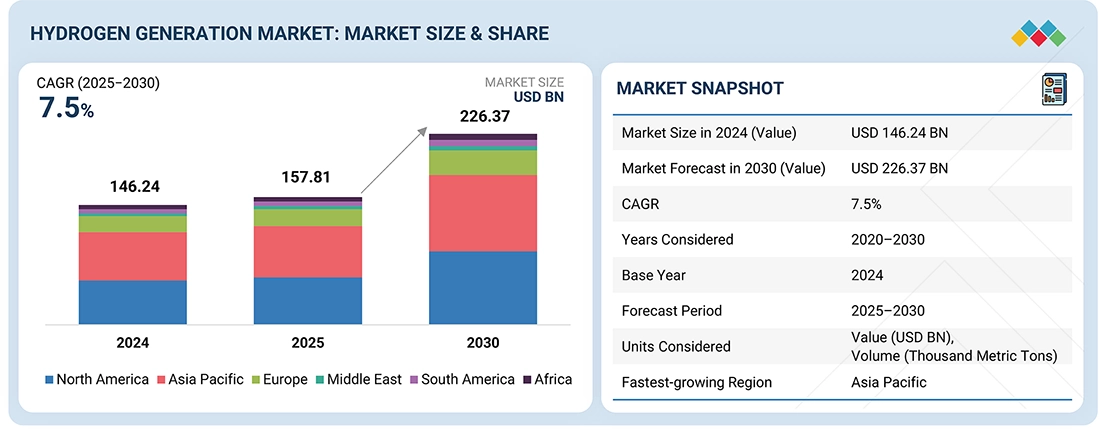
The hydrogen generation market size is projected to reach USD 226.37 billion by 2030, up from an estimated USD 157.81 billion in 2025, growing at a CAGR of 7.5% during the forecast period. The market growth is driven by increasing global efforts to decarbonize energy systems, growing demand for clean fuel alternatives, and the expanding use of hydrogen in industrial, transportation, and power generation sectors.
Market Size and Forecast:
- Market Size Value in 2024: USD 146.24 Billion
- Market Size Value in 2025: USD 157.81 Billion
- Revenue Forecast in 2030: USD 226.37 Billion
- Growth Rate: CAGR of 7.5% from 2025 to 2030
- Data available from 2020 to 2030
Key Market Trends and Insights
- Market Growth: Growth is driven by increasing global demand for low-carbon energy, government decarbonization initiatives, and rising hydrogen consumption across refining, ammonia production, transportation, and power generation sectors.
-
Green Hydrogen Impact: Advancements in electrolysis technologies and increasing investments in green hydrogen projects are accelerating the transition toward sustainable hydrogen production, supporting industrial decarbonization and energy security goals.
- Growing Trends: The market is witnessing increased adoption of green and blue hydrogen, expansion of hydrogen infrastructure, integration of carbon capture technologies, and growing use of hydrogen in transportation and power generation applications
-
Growth Opportunities: Opportunities include expanding green hydrogen production through electrolysis, increasing adoption of hydrogen fuel cells in transportation, investments in hydrogen infrastructure and storage networks, and integration of carbon capture technologies to support low-carbon hydrogen production.
-
North America Hydrogen Generation Market
- Market size USD 32.27 billion in 2025
- Market forecast USD 45.34 billion in 2030
- Market Growing at a CAGR of 7.0%
-
Europe Hydrogen Generation Market
- Market size USD 28.68 billion in 2025
- Market forecast USD 42.38 billion in 2030
- Market Growing at a CAGR of 8.1%
-
US Hydrogen Generation Market
- Market size USD 23.50 billion in 2025
- Market forecast USD 33.27 billion in 2030
- Market Growing at a CAGR of 7.2%
-
Captive Hydrogen Generation Market
- Market size USD 123.39 billion in 2022
- Market forecast USD 189.91 billion in 2030
- Market Growing at a CAGR of 7.4%
-
China Hydrogen Generation Market
- Market size USD 46.69 billion in 2024
- Market forecast USD 73.29 billion in 2030
- Market Growing at a CAGR of 7.8%
-
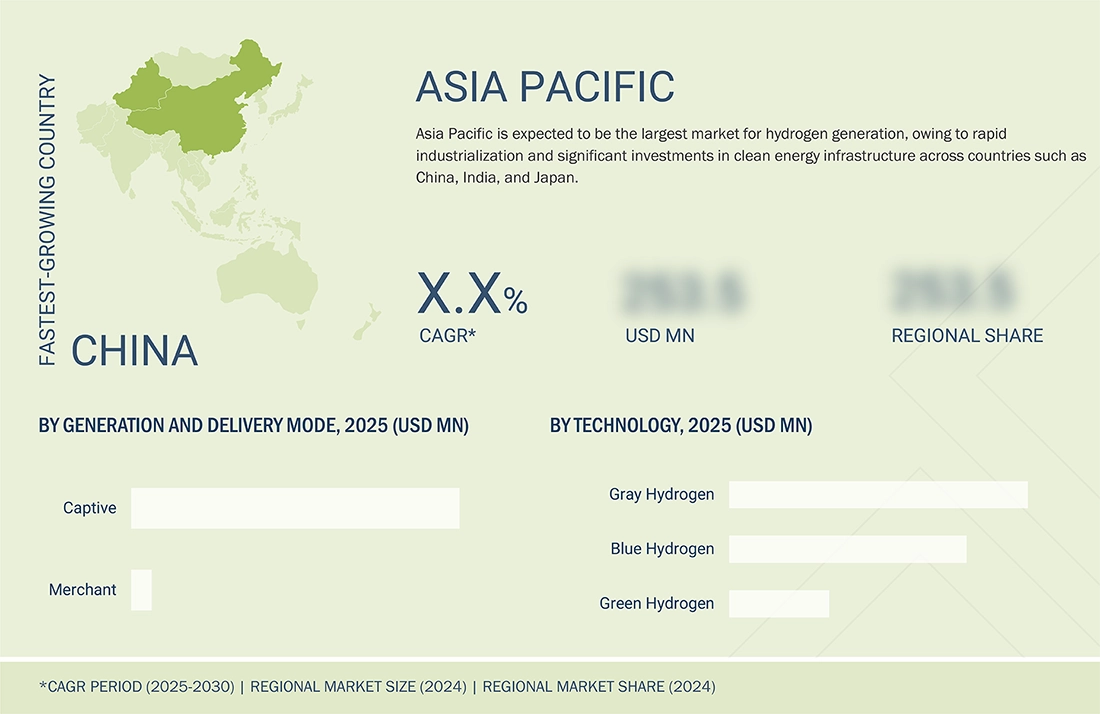
Asia Pacific Hydrogen Generation Market
- Market size USD 72.98 billion in 2025
- Market forecast USD 109.43 billion in 2030
- Market Growing at a CAGR of 8.4%
-
North America Hydrogen Generation Market
KEY TAKEAWAYS
-
BY TECHNOLOGYThe steam methane reforming segment holds the largest share in the hydrogen production market. This dominance is driven by SMR’s cost-effectiveness, technological maturity, and capacity to produce hydrogen at a large scale to meet industrial needs. SMR is widely used in the refinery, chemical, and fertilizer industries because of its reliable supply and integration with existing natural gas infrastructure. Additionally, advances in carbon capture and storage (CCS) improve the environmental performance of SMR, supporting its ongoing use. Government support and rising global hydrogen demand further solidify SMR’s leadership in the hydrogen production market.
-
BY APPLICATIONThe transportation segment is anticipated to be the most rapidly expanding application within the hydrogen generation market throughout the forecast period. This expansion is predominantly driven by the increasing adoption of hydrogen fuel cell technologies across diverse mobility sectors, including passenger vehicles, buses, trucks, trains, marine vessels, and aviation. Hydrogen fuel cells provide distinctive advantages such as high energy density, rapid refueling capabilities, and extended operational ranges relative to battery electric vehicles, thereby rendering them especially suitable for heavy-duty and long-distance applications where minimizing downtime remains a paramount concern.
-
BY SOURCEThe green hydrogen segment is anticipated to achieve the highest compound annual growth rate (CAGR) in the hydrogen generation market throughout the forecast period. This growth is propelled by the global shift toward carbon neutrality and the pressing necessity to decarbonize hard-to-abate sectors. Supportive policy frameworks expedite project development and commercialization, including tax incentives, subsidies, and national hydrogen strategies implemented worldwide. Moreover, the increasing demand for zero-emission fuels in applications such as fuel cell vehicles, power generation, and industrial feedstock establishes green hydrogen as a critical facilitator of the international transition to clean energy. Strategic collaborations, large-scale pilot initiatives, and comprehensive decarbonization roadmaps persistently contribute to the advancement of the green hydrogen sector globally.
-
BY GENERATION & DELIVERY MODEThe captive segment is the leading method for hydrogen production, especially in refinery applications, because it can provide a reliable, continuous, and cost-effective hydrogen supply directly on-site. Unlike the merchant segment, which depends on external supply chains and adds transportation and storage costs, captive generation guarantees a steady supply tailored to specific operational needs. This approach is widely used in key sectors such as oil refining, food production, metals treatment, and fertilizer manufacturing, where reliability and seamless integration are essential.
-
BY REGIONAsia Pacific holds the largest share in the hydrogen generation market, driven by rapid industrial growth, urbanization, and strong efforts to decarbonize energy systems. Countries such as China, Japan, South Korea, and India are making significant investments in hydrogen production infrastructure to support cleaner industrial processes and reduce reliance on fossil fuels. Supportive government policies, national hydrogen strategies, and substantial funding for renewable and low-carbon hydrogen projects speed up market growth. Additionally, increasing demand from refining, chemical, and mobility sectors further boosts the region’s leadership.
-
COMPETITIVE LANDSCAPEMajor market players have adopted both organic and inorganic strategies, such as forming partnerships and signing agreements. For example, Linde PLC, Saudi Arabian Oil Co., Uniper SE, and Orsted A/S have entered into several agreements and partnerships to meet the rising demand for hydrogen.
The hydrogen generation market is fueled by increasing global efforts to decarbonize energy systems, rising demand for clean fuel alternatives, and the expanding use of hydrogen in industrial, transportation, and power generation sectors. Supportive government policies, significant investments in renewable energy, and advances in electrolysis technology drive market growth. Additionally, the development of hydrogen infrastructure and a rising focus on energy security and emission reduction further boost the market’s growth across major global regions.
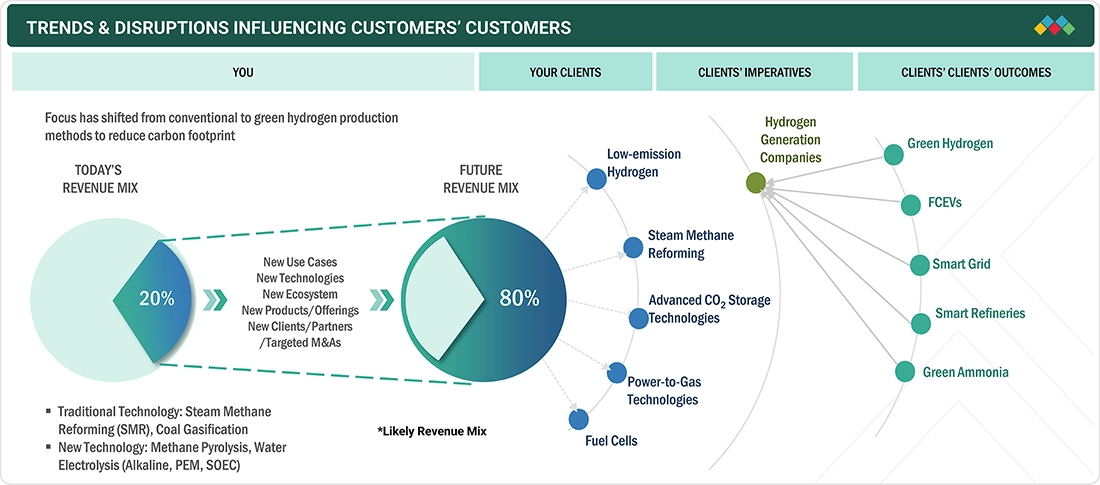
TRENDS & DISRUPTIONS IMPACTING CUSTOMERS' CUSTOMERS
The hydrogen generation market is undergoing transformative trends, with emerging technologies creating new growth opportunities. Moving from traditional fossil-based methods to low-carbon and renewable options, future revenue streams include green hydrogen from electrolysis, blue hydrogen with carbon capture, and integration with renewable energy sources. Major industries such as refining, chemicals, steel, and transportation are increasingly using hydrogen to reduce carbon emissions, supported by large-scale infrastructure investments. This shift aligns with global net-zero goals while maintaining energy security and efficiency, despite challenges in scaling up production, storage, and distribution infrastructure.
Source: Secondary Research, Interviews with Experts, MarketsandMarkets Analysis
MARKET DYNAMICS
Level
-
Enforcement of stringent regulations to curb greenhouse gas emissions

-
Government initiatives for developing hydrogen economy

Level
-
Limited hydrogen infrastructure

-
Energy loss during hydrogen production

Level
-
Rising emphasis on achieving net-zero carbon emission targets

-
Growing investment in low-emission fuels

Level
-
High costs associated with renewable hydrogen production

Source: Secondary Research, Interviews with Experts, MarketsandMarkets Analysis
Driver: Growing emphasis on developing hydrogen economy
Countries around the world emphasize the development of a hydrogen economy as part of their comprehensive strategies to realize energy transition, achieve climate objectives, and strengthen economic resilience. Hydrogen, especially green hydrogen produced via renewable energy sources, is increasingly recognized as a pivotal solution to decarbonize sectors that are challenging to transform, such as steel, cement, chemicals, and heavy transportation. To expedite this transition, various governments have enacted detailed plans, policies, subsidies, and incentive schemes to promote hydrogen development. For example, the European Union unveiled its EU Hydrogen Strategy in 2020, concentrating on expanding hydrogen production and demand, supporting investments, developing infrastructure and markets, advancing research and innovation, and fostering international collaboration. This strategy is supported by an array of complementary policies and incentive mechanisms, including the European Green Deal, the Renewable Energy Directive III (RED III), and REPowerEU, all aimed at accelerating the deployment of clean hydrogen throughout the region. Canada introduced the Clean Hydrogen Investment Tax Credit (CHITC) in 2022, which became effective in 2023. This refundable tax credit applies to eligible clean hydrogen assets acquired and operational from March 28, 2023, through December 31, 2034, and is designed to stimulate investment in qualifying hydrogen projects..
Restraint: Energy loss during hydrogen production
Hydrogen is a synthetic energy carrier. It transports energy produced by various other processes. Water electrolysis converts electrical energy into hydrogen. However, in addition to producing hydrogen, high-grade electrical energy is also utilized to compress, liquefy, transport, transfer, or store the medium. Energy is needed for hydrogen production. The energy input should ideally match the energy level of the synthetic gas. Any method of producing hydrogen, such as electrolysis and reforming, involves energy transformation. The chemical energy of hydrogen is converted from electrical energy or the chemical energy of hydrocarbons. Unfortunately, energy losses are always a part of the creation of hydrogen. Energy loss occurs across every step of hydrogen production. In the production stage, the energy needed for electrolysis is lost by around 30%. An additional 10–25% of energy is lost during conversion to other forms. Energy input is required to deliver green hydrogen, either in the form of fuel for vehicles or energy from pipes. Utilizing hydrogen in fuel cells results in more energy loss.
Opportunity: Growing investment in low-emission fuels
Biofuels, hydrogen, and hydrogen-derived fuels are low-emission options essential for reducing carbon emissions in sectors with limited electrification, like heavy industry and long-distance transportation. These fuels constitute a small share of global final energy use. Hydrogen is a notably clean transportation fuel, emitting less carbon dioxide than other fossil fuels. Growth in hydrogen production has been driven by strict environmental regulations and rigorous engine manufacturer standards. For example, India adopted a Green Hydrogen Policy aiming to produce five million tons per year (MTPA) of green hydrogen by 2030. Similarly, China announced a long-term hydrogen development plan covering 2021–2035. According to this plan, China aims to produce 100,000 to 200,000 tons of renewable hydrogen annually by 2025 and expects to operate a fleet of 50,000 hydrogen-powered vehicles. The demand for cleaner fuels is expected to rise significantly in the future, fueled by a 10% growth in automotive sales in the Asia-Pacific region, increasing sales of premium cars, and shifting consumer fuel spending habits. The IEA reports that in 2023, global investment in clean energy surpassed USD 1.7 trillion, marking a major move toward sustainable energy systems. These investments include renewable power, nuclear energy, grid upgrades, energy storage, low-emission fuels, energy-efficiency upgrades, renewable end-use technologies, and electrification efforts. Such investments offer major opportunities for hydrogen as a fuel in the growing hydrogen market.
Challenge: High costs associated with renewable hydrogen production
Green hydrogen, produced using renewable energy sources such as wind, solar, or hydropower, or other low-carbon power, is increasingly recognized as a key element for achieving deep decarbonization across energy-intensive and hard-to-abate sectors. Industries like steel, cement, chemicals, heavy-duty transportation, shipping, and aviation can use green hydrogen to significantly cut carbon footprints and meet global net-zero targets. Besides lowering emissions, green hydrogen also provides strategic advantages such as improving energy security and aiding the integration of variable renewable energy into national grids. Despite its environmental benefits, the economic viability of green hydrogen remains a major obstacle. Its cost is roughly two to four times higher than that of grey hydrogen, which is made from fossil fuels without carbon capture. Several factors drive this gap, including the high capital costs of electrolyzer systems, limited and uneven access to affordable renewable electricity, and the underdeveloped infrastructure for hydrogen production, storage, and distribution. These economic and logistical challenges continue to slow the widespread adoption of green hydrogen and limit its role in the global energy transition.
Hydrogen Generation Market: COMMERCIAL USE CASES ACROSS INDUSTRIES
| COMPANY | USE CASE DESCRIPTION | BENEFITS |
|---|---|---|
 |
SSAB, Sweden’s leading steelmaker, sought to decarbonize its operations by transitioning to hydrogen-based Direct Reduced Iron (DRI) technology. However, sourcing reliable, large-scale green hydrogen presented a significant challenge. To address this, SSAB partnered with Vattenfall and LKAB under the HYBRIT (Hydrogen Breakthrough Ironmaking Technology) initiative. The project deployed a 4.5 MW pilot electrolyzer powered by renewable electricity to produce fossil-free hydrogen for iron and steelmaking, demonstrating the feasibility of a sustainable production pathway. | The HYBRIT initiative proved that green hydrogen can replace coal in steelmaking, enabling fossil-free steel production. By integrating renewable electricity with electrolyzer technology, the project showcased a scalable solution for hydrogen generation at industrial levels. Upon full-scale commercialization, HYBRIT has the potential to reduce Sweden’s total CO2 emissions by nearly 10%, marking a major milestone in decarbonizing one of the most emission-intensive sectors. The project not only enhances hydrogen’s role as a clean industrial feedstock but also sets a blueprint for global steelmakers to adopt hydrogen-based pathways for sustainable operations. |
 |
The National Renewable Energy Laboratory (NREL) and Electric Hydrogen have entered into a three-year, USD 3.6 million collaboration to advance the development of high-performance electrolyzer components. This partnership focuses on improving the durability and efficiency of electrolysis cells by identifying degradation mechanisms and validating next-generation designs capable of operating at higher stack currents. The collaboration leverages both organizations’ technical expertise in renewable energy innovation and builds upon their prior success—several team members from both sides were part of the long-term NREL–First Solar partnership that helped commercialize cadmium telluride (CdTe) solar photovoltaics. | This joint initiative is expected to accelerate the scalability and cost-effectiveness of clean hydrogen production, enabling broader deployment of renewable hydrogen across industries. By enhancing electrolyzer performance and lifespan, the project supports decarbonization of hard-to-abate sectors such as heavy industry, energy storage, and transportation. Additionally, the partnership strengthens the knowledge base in renewable hydrogen technologies, fostering innovation and driving progress toward a sustainable, low-carbon energy ecosystem |
Logos and trademarks shown above are the property of their respective owners. Their use here is for informational and illustrative purposes only.
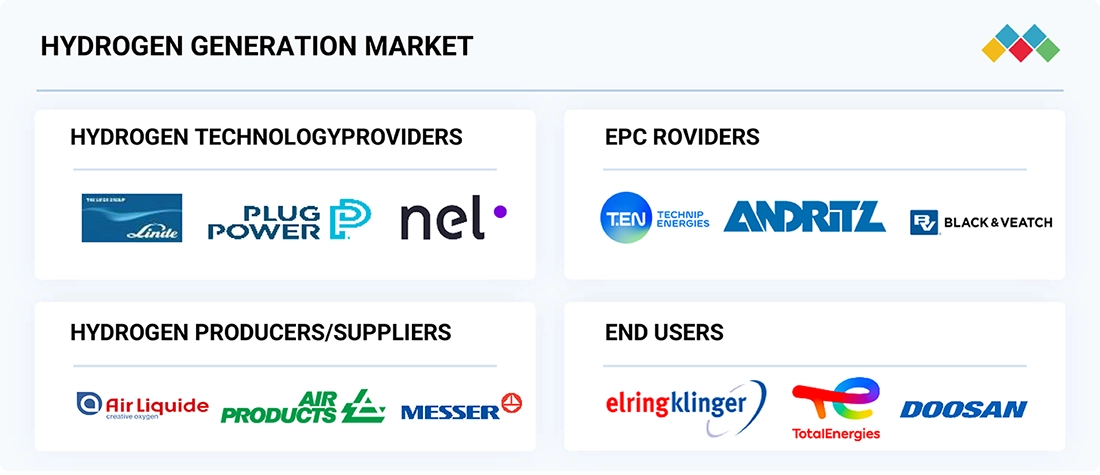
MARKET ECOSYSTEM
The hydrogen generation market operates within a complex and interconnected ecosystem, facilitating the production, storage, and use of hydrogen in industrial and energy sectors. The supply chain starts with hydrogen technology providers, who supply the technologies needed to produce hydrogen. Notable providers include Linde PLC (Ireland), Nel ASA (Norway), and Cummins Inc. (US). EPC providers deliver engineering, procurement, and construction services for hydrogen plants, with some key companies being Technip Energies (France), Black & Veatch (US), and ANDRITZ (Austria). Hydrogen producers and suppliers acquire technology from these providers to generate hydrogen. Major component suppliers include Air Liquide (France), Air Products and Chemicals, Inc. (US), and ENGIE (France). Hydrogen is utilized in various end-use applications across mobility, industry, and power sectors. Some prominent end users are ElringKlinger AG (Germany), Doosan Fuel Cell Co., Ltd. (South Korea), and TotalEnergies (France).nce
Logos and trademarks shown above are the property of their respective owners. Their use here is for informational and illustrative purposes only.
MARKET SEGMENTS
Source: Secondary Research, Interviews with Experts, MarketsandMarkets Analysis
Hydrogen GenerationMarket, By Technology
The Steam Methane Reforming (SMR) accounted for the largest market revenue share in 2024. The SMR segment maintains its dominant share mainly due to its well-established infrastructure and cost-effective production, especially for grey hydrogen. In the short to medium term, the petroleum refining sector remains the top hydrogen consumer. In this industry, hydrogen is usually produced on-site via SMR, recovered as a by-product from petrochemical processes, or sourced externally as merchant hydrogen, depending on operational needs and cost considerations.
Hydrogen Generation Market, By Source
Green hydrogen is projected to have the highest CAGR in the hydrogen generation market. The global shift toward carbon neutrality and the urgent need to decarbonize hard-to-reach sectors fuel the demand for green hydrogen. Supportive policies, including tax incentives, subsidies, and national hydrogen strategies, help speed up project development and commercialization. Furthermore, the rising demand for zero-emission fuels in applications like fuel cell vehicles, power generation, and industrial feedstock makes green hydrogen a crucial part of the worldwide clean energy transition.
Hydrogen Generation Market, By Application
The transportation segment is expected to record the highest CAGR in the hydrogen generation market during the forecast period. This growth is primarily fueled by the rising adoption of hydrogen fuel cell technologies across various mobility segments, including passenger vehicles, buses, trucks, trains, marine vessels, and even aviation. Hydrogen fuel cells offer unique advantages such as high energy density, quick refueling times, and longer operational ranges compared to battery electric vehicles, making them particularly attractive for heavy-duty and long-distance applications where minimizing downtime is critical. Stringent global emission regulations, combined with ambitious climate targets set by governments and international organizations, are accelerating the transition toward zero-emission transportation solutions. National hydrogen roadmaps and supportive policy frameworks are encouraging large-scale investments in hydrogen infrastructure, including refueling networks and production facilities. These initiatives also provide financial incentives and subsidies to adopt hydrogen-powered solutions.
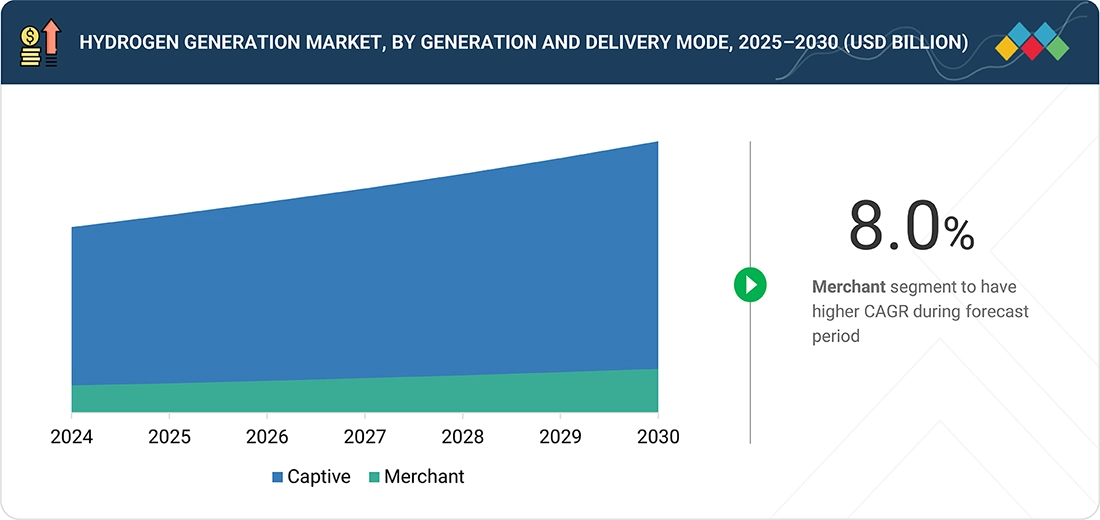
Hydrogen Generation Market, By Generation & Delivery Mode
The captive hydrogen generation segment hold the largest share in the generation & delivery mode in the hydrogen generation market due to its ability to provide a secure, continuous, and cost-effective hydrogen supply directly on-site. Unlike the merchant segment, which relies on external supply chains and incurs additional transportation and storage costs, captive generation ensures uninterrupted availability tailored to specific operational needs. This mode is extensively adopted in critical sectors, such as oil refining, food production, metals treatment, and fertilizer manufacturing, where reliability and process integration are crucial.
REGION
Asia Pacific is expected to witness the highest CAGR in global hydrogen generation market during forecast period
Asia Pacific is expected to see the highest CAGR in the hydrogen generation market during the forecast period, driven by rapid industrial growth, urbanization, and strong efforts to decarbonize energy systems. Countries like China, Japan, South Korea, and India are making significant investments in hydrogen production infrastructure to support cleaner industrial processes and reduce reliance on fossil fuels. Supportive government policies, national hydrogen strategies, and substantial funding for renewable and low-carbon hydrogen projects are boosting market growth. Additionally, increasing demand from the refining, chemical, and mobility sectors further solidifies the region’s leadership.
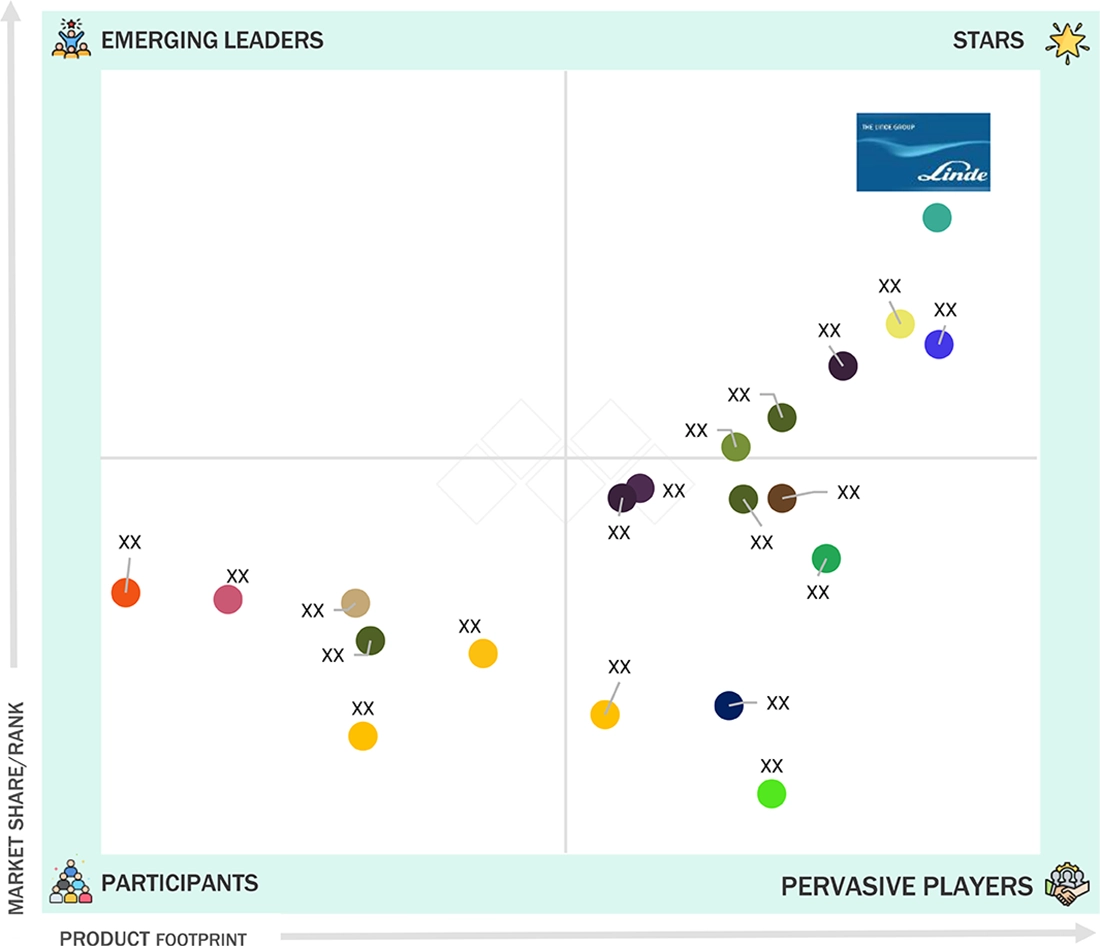
Hydrogen Generation Market: COMPANY EVALUATION MATRIX
Linde PLC (Star) leads the hydrogen generation market with significant investments in large-scale green and blue hydrogen projects, supported by its global infrastructure and extensive expertise in industrial gases. The company utilizes advanced electrolyzer technology, carbon capture solutions, and broad distribution networks to promote the adoption of clean hydrogen across mobility, refining, and heavy industry sectors. Its diversified portfolio and focus on decarbonization establish it as the leading player driving market growth, providing reliable hydrogen supply at scale and solidifying its leadership in the global energy transition.
Source: Secondary Research, Interviews with Experts, MarketsandMarkets Analysis
KEY MARKET PLAYERS
MARKET SCOPE
| REPORT METRIC | DETAILS |
|---|---|
| Market Size in 2024 (Value) | USD 146.24 Billion |
| Market Forecast in 2030 (value) | USD 226.37 Billion |
| Growth Rate | CAGR of 7.5% from 2025-2030 |
| Years Considered | 2020-2030 |
| Base Year | 2024 |
| Forecast Period | 2030 |
| Units Considered | Value (USD Million/Billion)/Volume (Thousand metric tons) |
| Report Coverage | Revenue forecast, company ranking, competitive landscape, growth factors, and trends |
| Segments Covered |
|
| Regions Covered | North America, Europe, Asia Pacific, Middle East & Africa, and South America |
WHAT IS IN IT FOR YOU: Hydrogen Generation Market REPORT CONTENT GUIDE
DELIVERED CUSTOMIZATIONS
We have successfully delivered the following deep-dive customizations:
| CLIENT REQUEST | CUSTOMIZATION DELIVERED | VALUE ADDS |
|---|---|---|
| Green Hydrogen Providers in the Europe Market | Detailed company profiles 10 green hydrogen generation & storage players in the Europe market | Identified and profiled 10-15 hydrogen generation & storage players in European market; Provided recent developments, financials, product portfolios, and business overviews |
RECENT DEVELOPMENTS
- June 2025 : Centrica entered an agreement with Equinor for a USD 25.6 billion natural gas supply deal spanning 10 years, from 2025 to 2035. Under this agreement, Equinor will deliver around 5 billion cubic metres of natural gas annually to the UK, enough to meet the heating needs of approximately 5 million homes or about 8–10% of the country’s total demand.
- May 2025 : Uniper SE entered a strategic partnership with thyssenkrupp Uhde to develop a cutting-edge ammonia cracker, designed to convert imported ammonia into hydrogen and nitrogen at its Gelsenkirchen-Scholven site. This cooperation will see the construction of one of the world’s first demonstration plants (processing around 28?t/day of ammonia) and serves as a critical first step toward a planned large-scale hydrogen import terminal in Wilhelmshaven.
- March 2025 : JERA Co., Inc. formed a collaboration with Exxon Mobil Corporation, to jointly explore the development of a large-scale low-carbon hydrogen and ammonia production facility at ExxonMobil’s Baytown Complex near Houston, Texas. Under this agreement, JERA Co., Inc. may take ownership of the project and intends to secure approximately 500,000?tonnes per year of low-carbon ammonia for supply to Japan.
- December 2024 : Saudi Arabian Oil Co. entered into a shareholders’ agreement with Linde plc and SLB to develop one of the world’s largest carbon capture and storage (CCS) hubs in Jubail, Saudi Arabia. In this deal, Aramco will hold a 60% stake, while Linde and SLB will each hold 20%. The project aims to capture and store up to 9 million tonnes of CO2 annually by 2027 through a network of pipelines and underground storage in a saline aquifer. This CCS hub is also designed to support Aramco’s blue hydrogen and ammonia programs by providing the carbon capture infrastructure needed to produce low-carbon fuels.
- November 2024 : ENGIE entered a strategic partnership with Morocco’s OCP Group to accelerate the production of green hydrogen and ammonia, alongside renewable energy, storage, electrical infrastructure, desalination, and R&D efforts. The deal commits parties to co-develop large-scale projects—feasibility studies for e-methanol and sustainable aviation fuel—supporting Morocco’s industrial decarbonization ambitions and clean energy transition.
Table of Contents
 Exclusive indicates content/data unique to MarketsandMarkets and not available with any competitors.
Methodology
The study involved major activities in estimating the current size of the hydrogen generation market. Exhaustive secondary research was done to collect information on the peer and parent markets. The next step was to validate these findings, assumptions, and sizing with industry experts across the value chain through primary research. Both top-down and bottom-up approaches were employed to estimate the complete market size. Thereafter, market breakdown and data triangulation were used to estimate the market size of the segments and subsegments.
Secondary Research
The secondary sources referred to for this research study include annual reports, press releases, investor presentations of companies, white papers, certified publications, articles from recognized authors, and databases of various companies and associations. Secondary research was mainly used to obtain key information about the industry’s supply chain, the market’s monetary chain, the total pool of key players, market classification and segmentation according to industry trends to the bottom-most level, regional markets, and key developments from market- and technology-oriented perspectives.
Primary Research
In the primary research process, various primary sources from the supply and demand sides were interviewed to obtain qualitative and quantitative information for this report. Primary sources from the supply side include industry experts, such as CEOs, vice presidents, marketing directors, technology & innovation directors, and related key executives from various companies and organizations operating in the hydrogen generation market.
In the complete market engineering process, the top-down and bottom-up approaches and several data triangulation methods were extensively used to perform market estimation and market forecasts for the overall market segments and subsegments listed in this report. Extensive qualitative and quantitative analysis was conducted on the complete market engineering process to list key information/insights throughout the report.

Note 1: Others include sales managers, marketing managers, and product managers.
Note 2: Tier 1 companies’ revenues are more than USD 10 billion; tier 2 companies’ revenues range between USD 1 and 10 billion; and tier 3 companies’ revenues range between USD 500 million and USD 1 billion.
Source: Industry Experts
To know about the assumptions considered for the study, download the pdf brochure
Market Size Estimation
The top-down and bottom-up approaches were used to estimate and validate the size of the global hydrogen generation market and to evaluate the sizes of various other dependent submarkets. Key players in the market were identified through secondary research, and their shares in the respective regions were determined through primary and secondary research. This entire procedure included the study of annual and financial reports of top market players and extensive interviews for key insights with industry leaders, such as CEOs, VPs, directors, and marketing executives. All percentage shares, splits, and breakdowns were determined using secondary sources and verified through primary sources. All possible parameters that affect the markets covered in this research study were accounted for, viewed in extensive detail, verified through primary research, and analyzed to get the final quantitative and qualitative data.
Hydrogen Generation Market : Top-Down and Bottom-Up Approach

Data Triangulation
After arriving at the overall market size from the estimation process explained below, the total market was split into several segments and subsegments. The data triangulation and market breakdown procedures were employed, wherever applicable, to complete the overall market engineering process and arrive at the exact statistics for all the segments and subsegments. The data was triangulated by studying various factors and trends from the demand and supply sides.
Market Definition
Hydrogen is the lightest and most abundant element in the universe, widely valued for its exceptional energy-carrying capacity. It can be produced either as a primary product or as a by-product from diverse energy sources, including renewables (wind and solar), fossil fuels (coal and natural gas), and nuclear power. Due to its high energy content per unit mass, hydrogen serves as a highly versatile energy carrier. It is critical in various industrial processes, chemical manufacturing, and emerging clean energy applications. The hydrogen generation market is defined as the sum of the revenue generated by companies producing hydrogen through various technologies, such as electrolysis, steam methane reforming (SMR), auto thermal reforming (ATR), partial oxidation (POX), and coal gasification.
Stakeholders
- Fuel cell electric vehicle (FCEV) manufacturers
- Government organizations
- Hydrogen charging station owners
- Hydrogen fuel pump developers and operators
- Hydrogen generation equipment manufacturers and suppliers
- Hydrogen generation infrastructure developers
- Institutional investors
- Merchant hydrogen producers
- Methanol producers
- Refinery operators
- Research institutes
Report Objectives
- To describe and forecast the hydrogen generation market, by technology, generation and delivery mode, application, source, and region, in terms of value
- To describe and forecast the hydrogen generation market, by technology, generation and delivery mode, application, source, and region, in terms of volume
- To forecast the market size across four key regions: North America, Europe, Asia Pacific, the Middle East, Africa, and South America, along with country-level analysis, in terms of value and volume
- To provide detailed information regarding key drivers, restraints, opportunities, and challenges influencing the growth of the hydrogen generation market
- To provide the supply chain analysis, trends/disruptions impacting customer business, ecosystem analysis, regulatory landscape, patent analysis, case study analysis, technology analysis, key conferences & events, the impact of AI/Gen AI, pricing analysis, porter’s five forces analysis, regulatory analysis, and the impact of 2025 US tariff on the hydrogen generation market
- To analyze opportunities for stakeholders and provide a detailed competitive landscape of the market leaders
- To strategically analyze micromarkets with respect to individual growth trends, prospects, and contributions to the overall market size
- To benchmark players within the market using the company evaluation matrix, which analyzes market players based on several parameters within the broad categories of business and product strategies
- To compare key market players with respect to product specifications and applications
- To strategically profile key players and comprehensively analyze their market rankings and core competencies
- To analyze competitive developments, such as contracts, agreements, expansions, investments, acquisitions, partnerships, collaborations, and joint ventures, in the hydrogen generation market
Available Customizations
MarketsandMarkets offers customizations according to the specific needs of the companies using the given market data.
The following customization options are available for the report:
Product Analysis
- Product matrix, which gives a detailed comparison of the product portfolio of each company
Geographic Analysis as per Feasibility
- Further breakdown of the hydrogen generation market, by country for the Europe, Asia Pacific, North America, Middle East, Africa, and South America regions
Company Information
- Detailed analysis and profiling of additional market players (up to five)
Key Questions Addressed by the Report
What was the size of the hydrogen generation market?
The size of the hydrogen generation market was USD 146.24 billion in 2024.
What are the major drivers for the hydrogen generation market?
Enforcement of stringent policies to curb greenhouse gas emissions and supportive government policies are the major drivers for the hydrogen generation market.
Which is the largest market for the hydrogen generation market during the forecast period?
Asia Pacific is the largest market for hydrogen generation. Government policies and national strategies, emerging mobility and power applications, and a strong industrial base position the region as a dominant force in the market.
Which is expected to be the largest market, by technology, of the hydrogen generation market during the forecast period?
Steam methane reforming (SMR) is expected to be the largest market, by technology, in the hydrogen generation market during the forecast period.
Which is expected to be the largest market, by application, of the hydrogen generation market during the forecast period?
Petroleum refinery is expected to be the largest market, by application, in the hydrogen generation market during the forecast period.
Need a Tailored Report?
Customize this report to your needs
Get 10% FREE Customization
Customize This ReportPersonalize This Research
- Triangulate with your Own Data
- Get Data as per your Format and Definition
- Gain a Deeper Dive on a Specific Application, Geography, Customer or Competitor
- Any level of Personalization
Let Us Help You
- What are the Known and Unknown Adjacencies Impacting the Hydrogen Generation Market
- What will your New Revenue Sources be?
- Who will be your Top Customer; what will make them switch?
- Defend your Market Share or Win Competitors
- Get a Scorecard for Target Partners

Custom Market Research Services
We Will Customise The Research For You, In Case The Report Listed Above Does Not Meet With Your Requirements
Get 10% Free CustomisationTESTIMONIALS

Kimberly Murphy
GLOBAL MARKETING DIRECTOR
Bently Nevada,
Leading Condition Monitoring & Asset Protectionwww.bakerhughesds.com/bently-nevada

MarketsandMarkets™ showed consistent rigor for success and relentlessly worked with Bently Nevada stakeholders to positively impact go-to-market strategy. Their proactiveness and flexibility has been instrumental in achieving the objectives to grow our sales pipeline in key industrial markets.

DARRICK HUEBER
Business Development Leader
Nexus Controls LLC,
Leading Manufacturer of Automation System & Electrical Panelswww.bakerhughesds.com/nexus-controls

We partnered with MarketsandMarkets to expand our business further by tapping into new industrial segments. It was critical for us to gather crucial business insights about specific markets to achieve this goal. MarketsandMarkets engagement model and client services helped us provide those insights, it was really impressive and valuable for my business. The team was extremely flexible and helpful.

Mike Schoff
Global Industrial Commercial Strategy Leader
Nexus Controls LLC
Leading Manufacturer of Automation System & Electrical Panelswww.bakerhughesds.com/nexus-controls
We consulted MarketsandMarkets for potential Partner Identification. Overall, it was a good experience. The insights provided through interviews conducted by the team helped us put together the questionnaire required for discussion with the selected partners. Their ability to provide insights through interviews with customers in a timely manner was quite impressive.
- Canada Hydrogen Generation Market
- Mexico Hydrogen Generation Market
- US Hydrogen Generation Market
- Germany Hydrogen Generation Market
- UK Hydrogen Generation Market
- France Hydrogen Generation Market
- Russia Hydrogen Generation Market
- China Hydrogen Generation Market
- Japan Hydrogen Generation Market
- India Hydrogen Generation Market
- Australia Hydrogen Generation Market
- South Korea Hydrogen Generation Market
- Brazil Hydrogen Generation Market
- Argentina Hydrogen Generation Market
- Saudi Arabia Hydrogen Generation Market
- Qatar Hydrogen Generation Market
- UAE Hydrogen Generation Market
- Iran Hydrogen Generation Market
- South Africa Hydrogen Generation Market
Growth opportunities and latent adjacency in Hydrogen Generation Market


Antonio
Jun, 2022
What is the market size and growth rate of the global and regional hydrogen generation market by various segments?.
Somnath
Jul, 2022
marketsandmarkets track and advice the Hydrogen Generation segment very closely and understand the global and regional trends and have numerous proven products and methodologies that help industry leaders like and companies gain competitive advantage by responding proactively to megatrends. We would love to showcase our capabilities in way of sharing interesting case studies, Infographics, market studies, and reports establishing areas that would be of most value to you and give you a quick introduction to our deep industry coverage within the Hydrogen Generation segment specific to certain regions..
Raghuveer
May, 2022
The Hydrogen Generation Market Research is very interesting, I want to know more about when are the high growth niche segments expected to impact changing the revenue for mix of companies? .
Kai
May, 2026
Green energy is the focusing point, especially those agricultual wastes like EFB to be my interest. .
Silvia
May, 2026
Trying to learn more about hydrogen generation technology .