Gel Documentation Systems Market by Product (Instruments (Digital), Software), Light Source (Laser, LED, UV), Detection (Chemiluminescence), Application (Nucleic Acid), End User (Academic Institutes, Biotechnology Companies) & Region - Global Forecast to 2023


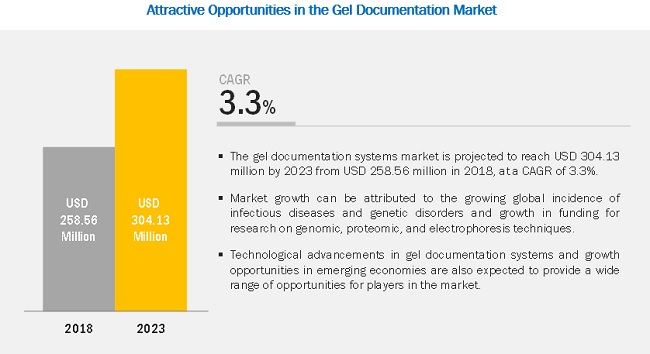
The gel documentation systems market is projected to reach USD 304 million by 2023, at a CAGR of 3.3%. Market growth is primarily driven by the growing global incidence of infectious diseases and genetic disorders and growth in funding for research on genomic, proteomic, and electrophoresis techniques.
Gel documentation systems are used by hospitals and diagnostic laboratories, research institutes, and pharmaceutical and biotechnology companies for the imaging and documentation of nucleic acid and protein suspended within polyacrylamide or agarose gels. These gels are typically stained with ethidium bromide or other fluorophores such as SYBR Green. These systems come in a variety of configurations, depending on throughput and sample type.
“By product, the instruments segment is expected to account for the largest share during the forecast period.”
The large share of this segment can majorly be attributed to the high usage of gel documentation systems in molecular biology techniques in pathology laboratories and research and development institutions, as it is the standalone technique for the imaging of gels.
“The LED light source segment is expected to account for the largest share during the forecast period.”
The large share of this segment can be attributed to the ease of use and economic nature of LEDs. Also, as LEDs cover a large range of visible spectrum wavelengths, they are preferred over other light sources.
“Based on the detection technique, UV segment to hold the largest share during the forecast period.”
The growing applications of proteomics and genomics research, forensic analysis, medicine, pharmacy, and astronomy research are expected to boost the market for ultraviolet detectors during the forecast period.
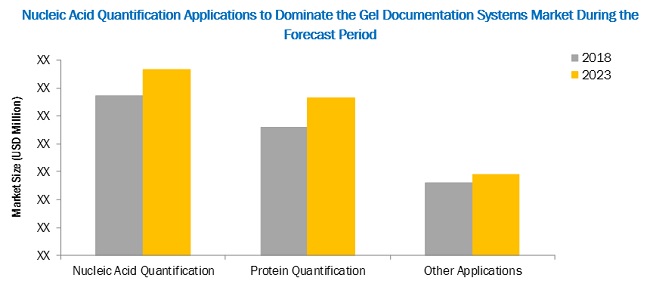
“By application, the nucleic acid quantification segment is expected to account for the largest share during the forecast period.”
The large share of this application segment is attributed to the increase in government and private funding for proteomics and protein-based research.
“North America is expected to dominate the global gel documentation systems market.”
The large share of North America in this market is attributed to the increasing research in the fields of proteomics and genomics, increasing R&D by pharmaceutical and biotechnology companies, the presence of a highly developed biotechnology research infrastructure, and the availability of government grants to support research.
Market Dynamics
Drivers: Growing global incidence of infectious diseases and genetic disorders
Globally, the incidence of infectious diseases and genetic disorders continues to grow at an exponential rate. Owing to this, the demand for genomic analysis techniques, such as electrophoresis, also continues to grow. This technique is used for the diagnosis of major infectious diseases, genetic disorders, and the detection of various genetic mutations owing to its proven efficacy.
Restraints: Growing adoption of quantitative polymerase chain reaction (qPCR)
In the last decade, the adoption of quantitative polymerase chain reaction (qPCR) has increased significantly in genomic applications. This can primarily be attributed to the technological advancements in qPCR and the significant reduction in the time of results. Moreover, as qPCR offers more specific quantitative data compared to electrophoresis, the demand for qPCR is increasing in the basic research, biotechnology, medicine, forensics, and diagnostic segments. qPCR also provides better analysis in gene expression (mRNA) analysis, microRNA and non-coding RNA analysis, genetic variation, mutation detection, and SNP analysis as compared to electrophoresis, making it a better alternative for several fields.
With such promising results, major players in the pharmaceutical and biotechnological industries are increasingly opting for qPCR techniques for research & development activities. This is expected to limit the growth of the electrophoresis market to a certain extent, which, in turn, will affect all related markets, including the gel documentation systems market.
Opportunities: Growth opportunities in emerging economies
qPCR and electrophoresis are two widely used techniques for protein and nucleic acid quantitative and qualitative studies. Among these, electrophoresis is cheaper and easier to use than qPCR. For example, the cost of qPCR is around USD 55,000–68,000, and it requires skilled professionals to run a sample. This cost factor is especially crucial in emerging economies where R&D expenditures and government funding in research institutes and pharmaceutical companies is limited. Owing to this, diagnostic laboratories and academic & research institutes in emerging economies such as China, India, and Brazil prefer electrophoresis devices for diagnostic and research studies. This increasing adoption of electrophoresis devices is expected to fuel the demand for gel documentation systems, as these systems play a major role in electrophoresis-based genomic analysis.
Scope of the Report
|
Report Metric |
Details |
|
Market size available for years |
2016–2023 |
|
Base year considered |
2017 |
|
Forecast period |
2018–2023 |
|
Forecast units |
USD million |
|
Segments covered |
Product, Light Source, Detection Technique, Application, End User and Region |
|
Geographies covered |
North America, Europe, Asia Pacific (APAC), and the Rest of the World. |
|
Companies covered |
GE Healthcare (US), Merck KGaA (Germany), Bio-Rad Laboratories (US), Thermo Fisher Scientific (US), LI-COR Biosciences (US), Endress + Hauser Management AG (Switzerland), Vilber Lourmat (France), Scientific Digital Imaging Plc. (UK), Bio-Techne (US), Cleaver Scientific (US), and Azure Biosystems (US) |
The research report segments the Gel Documentation Market into the following submarkets:
Market by Product Type
- Instruments
- Software
- Accessories
Market by Light Source
- Light-Emitting Diodes
- UV
- Laser
Market by Detection Technique
- UV Detectors
- Fluorescence
- Chemiluminescence
Market by Application:
- Nucleic Acid Quantification
- Protein Quantification
- Other Applications
Market by End User
- Academic & Research Institutes
- Pharma & Biotech Companies
- Diagnostic Laboratories
Market by Region:
- North America
- Europe
- Asia Pacific (APAC)
- Rest of the World
Key Market Players
Bio-Rad Laboratories, GE Healthcare, ThermoFisher Scientific, LI-COR Biosciences
Recent Developments
- In 2018, GE healthcare and Swedish government collaborated to open a test center – for innovation in Life sciences.
- In 2018, Thermo Fisher opened a newly expanded facility in Frederick, Maryland (US).
- In 2018, Syngene launched its G:BOX F3 automated gel documentation system
- In 2016, Bio-Techne acquired Zephyrus Biosciences, Inc. Zephyrus Biosciences will be integrated into the Protein Platforms Division of Bio-Techne. This deal will help in the commercialization of single-cell western blot technology.
Critical questions the report answers:
- Where will all these developments take the gel documentation market in the long term?
- What are the upcoming trends for the gel documentation market?
- Which segment in the gel documentation market provides the most opportunity for growth?
- Who are the leading vendors operating in the market?
- What are the opportunities for new market entrants in the gel documentation market?
To speak to our analyst for a discussion on the above findings, click Speak to Analyst
 Exclusive indicates content/data unique to MarketsandMarkets and not available with any competitors.
Table of Contents
1 Introduction (Page No. - 15)
1.1 Objectives of the Study
1.2 Market Definition
1.2.1 Markets Covered
1.2.2 Country Coverage
1.2.3 Years Considered for the Study
1.3 Currency
1.4 Limitations
1.5 Stakeholders
2 Research Methodology (Page No. - 18)
2.1 Secondary Data
2.1.1 Key Data From Secondary Sources
2.2 Primary Data
2.2.1 Key Data From Primary Sources
2.3 Market Size Estimation
2.3.1 Bottom-Up Approach
2.3.2 Top-Down Approach
2.4 Market Breakdown and Data Triangulation
2.5 Assumptions for the Study
3 Executive Summary (Page No. - 26)
4 Premium Insights (Page No. - 30)
4.1 Market Overview
4.2 Asia Pacific: Gel Imaging Systems Market, By Product (2018)
4.3 Gel Imaging Systems Market, By Region (2018)
4.4 Geographic Growth Opportunities
5 Market Overview (Page No. - 34)
5.1 Introduction
5.2 Market Dynamics
5.3 Drivers
5.3.1 Growing Global Incidence of Infectious Diseases and Genetic Disorders
5.3.2 Growth in Funding for Research on Genomic, Proteomic, and Electrophoresis Techniques
5.4 Restraints
5.4.1 Growing Adoption of Quantitative Polymerase Chain Reaction (QPCR)
5.5 Opportunities
5.5.1 Technological Advancements in Gel Imaging Systems
5.5.2 Growth Opportunities in Emerging Economies
6 Gel Documentation Systems Market, By Product (Page No. - 38)
6.1 Introduction
6.2 Instruments
6.2.1 Digital Gel Documentation Instruments
6.2.1.1 Digital Gel Documentation Instruments to Witness the Highest Growth During the Forecast Period
6.2.2 Film Gel Documentation Instruments
6.2.2.1 Market for Film Gel Documentation Instruments is Declining
6.3 Software
6.3.1 Software is A Necessary Component in the Functioning of Digital Gel Imaging Systems
6.4 Accessories
6.4.1 Gel Documentation Accessories to Account for A Relatively Smaller Share of the Market
7 Gel Documentation Systems Market, By Light Source (Page No. - 45)
7.1 Introduction
7.2 Light-Emitting Diodes
7.2.1 Energy Efficiency and Low Maintenance & Disposal Costs Associated With Leds to Drive the Growth of This Market
7.3 UV
7.3.1 The Use of Ethidium Bromide has Decreased Due to Its Toxicity
7.4 Laser
7.4.1 Images Produced By Laser Light Sources are More Accurate and Clearer
8 Gel Documentation Systems Market, By Detection Technique (Page No. - 50)
8.1 Introduction
8.2 Ultraviolet
8.2.1 UV Detectors Provide Good Sensitivity for Light-Absorbing Gels
8.3 Chemiluminescence
8.3.1 Technological Limitations Affecting Detection Range Affect Reliance on Chemiluminescence
8.4 Fluorescence
8.4.1 Fluorescence Detection Provides A Broad Linear Dynamic Range, Signal Stability, and Multiplex Detection
9 Gel Documentation Systems Market, By Application (Page No. - 55)
9.1 Introduction
9.2 Nucleic Acid Quantification
9.2.1 Increase in Government and Private Funding for Proteomics and Protein-Based Research to Drive Market Growth
9.3 Protein Quantification
9.3.1 Increasing Government Funding for Genomics and Proteomics Research is A Major Driving Factor
9.4 Other Applications
10 Gel Documentation Systems Market, By End User (Page No. - 60)
10.1 Introduction
10.2 Academic & Research Institutes
10.2.1 Growing Government Initiatives By Governments to Support Genomic and Proteomic Research Projects at the University Level are Expected to Drive Market Growth
10.3 Pharma & Biotech Companies
10.3.1 Pharma and Biotech Companies Use Gel Imaging Systems in Drug Discovery and Development and R&D Processes
10.4 Diagnostic Laboratories
10.4.1 The Demand for Gel Documentation Systems is Increasing in Diagnostic Laboratories Owing to the Growth in the Volume of Patient Samples to Be Tested
11 Gel Documentation Systems Market, By Region (Page No. - 65)
11.1 Introduction
11.2 North America
11.2.1 US
11.2.1.1 Increasing Government Funding for R&D Studies
11.2.2 Canada
11.2.2.1 Growing Investments in Proteomics and Genomics
11.3 Europe
11.3.1 Strong Academic & Research Base and Availability of Research Funding in European Countries
11.4 Asia Pacific
11.4.1 Japan
11.4.1.1 Growing Genomic and Proteomic Studies and Rising Research Investments
11.4.2 China
11.4.2.1 Increasing Government Interest in Biomedical and Biotechnology Industry
11.4.3 India
11.4.3.1 R&D Activity in the Indian Pharmaceutical and Biotechnology Industries Will Grow at A High Rate
11.4.4 RoAPAC
11.5 Rest of the World
12 Competitive Landscape (Page No. - 96)
12.1 Overview
12.2 Market Ranking Analysis, 2017
12.3 Competitive Scenario
12.3.1 Product Launches
12.3.2 Agreements
12.3.3 Expansions
12.3.4 Acquisitions
13 Company Profiles (Page No. - 100)
(Introduction, Products & Services, Strategy, & Analyst Insights, Developments, MnM View)*
13.1 Bio-Rad
13.2 Ge Healthcare
13.3 Thermo Fisher Scientific
13.4 Li-Cor Biosciences
13.5 Analytic Jena AG (A Subsidiary of Endress + Hauser Management Ag)
13.6 Vilber Lourmat
13.7 Syngene
13.8 Bio-Techne
13.9 Cleaver Scientific
13.10 Azure Biosciences Inc.
*Details on Marketsandmarkets View, Introduction, Product & Services, Strategy, & Analyst Insights, New Developments Might Not Be Captured in Case of Unlisted Companies.
14 Appendix (Page No. - 117)
14.1 Insights of Industry Experts
14.2 Discussion Guide
14.3 Knowledge Store: Marketsandmarkets’ Subscription Portal
14.4 Available Customizations
14.5 Related Reports
14.6 Author Details
List of Tables (88 Tables)
Table 1 Growing Geriatric Population Across Key Geographies (2015 vs 2030)
Table 2 Gel Imaging Systems Market, By Product, 2016–2023 (USD Million)
Table 3 Market for Instruments, By Region, 2016–2023 (USD Million)
Table 4 Gel Imaging Systems Market for Instruments, By Type, 2016–2023 (USD Million)
Table 5 Digital Gel Documentation Instruments Market, By Region, 2016–2023 (USD Million)
Table 6 Film Gel Documentation Instruments Market, By Region, 2016–2023 (USD Million)
Table 7 Gel Documentation Software Market, By Region, 2016–2023 (USD Million)
Table 8 Gel Documentation Accessories Market, By Region, 2016–2023 (USD Million)
Table 9 Gel Imaging Systems Market, By Light Source, 2016–2023 (USD Million)
Table 10 Gel Imaging Systems Market for Led-Based Light Sources, By Region, 2016–2023 (USD Million)
Table 11 Gel Imaging Systems Market for UV-Based Light Sources, By Region, 2016–2023 (USD Million)
Table 12 Gel Imaging Systems Market for Laser-Based Light Sources, By Region, 2016–2023 (USD Million)
Table 13 Gel Imaging Systems Market, By Detection Technique, 2016–2023 (USD Million)
Table 14 Ultraviolet-Based Gel Imaging Systems Market, By Region, 2016–2023 (USD Million)
Table 15 Chemiluminescence-Based Gel Imaging Systems Market, By Region, 2016–2023 (USD Million)
Table 16 Fluorescence-Based Gel Imaging Systems Market, By Region, 2016–2023 (USD Million)
Table 17 Gel Imaging Systems Market, By Application, 2016–2023 (USD Million)
Table 18 Gel Imaging Systems Market for Nucleic Acid Quantification, By Region, 2016–2023 (USD Million)
Table 19 Gel Imaging Systems Market for Protein Quantification, By Region, 2016–2023 (USD Million)
Table 20 Gel Imaging Systems Market for Other Applications, By Region, 2016–2023 (USD Million)
Table 21 Gel Imaging Systems Market, By End User, 2016–2023 (USD Million)
Table 22 Gel Imaging Systems Market for Academic & Research Institutes, By Region, 2016–2023 (USD Million)
Table 23 Gel Imaging Systems Market for Pharma & Biotech Companies, By Region, 2016–2023 (USD Million)
Table 24 Gel Imaging Systems Market for Diagnostic Laboratories, By Region, 2016–2023 (USD Million)
Table 25 Gel Imaging Systems Market, By Region, 2016–2023 (USD Million)
Table 26 North America: Gel Imaging Systems Market, By Country, 2016–2023 (USD Million)
Table 27 North America: Gel Imaging Systems Market, By Product, 2016–2023 (USD Million)
Table 28 North America: Gel Documentation Instruments Market, By Type, 2016–2023 (USD Million)
Table 29 North America: Gel Documentation Market, By Light Source, 2016–2023 (USD Million)
Table 30 North America: Gel Imaging Systems Market, By Detection Technique, 2016–2023 (USD Million)
Table 31 North America: Market, By Application, 2016–2023 (USD Million)
Table 32 North America: Market, By End User, 2016–2023 (USD Million)
Table 33 US: Gel Imaging Systems Market, By Product, 2016–2023 (USD Million)
Table 34 US: Gel Documentation Instruments Market, By Type, 2016–2023 (USD Million)
Table 35 US: Gel Documentation Market, By Light Source, 2016–2023 (USD Million)
Table 36 US: Market, By Detection Technique, 2016–2023 (USD Million)
Table 37 US: Market, By Application, 2016–2023 (USD Million)
Table 38 US: Market, By End User, 2016–2023 (USD Million)
Table 39 Canada: Gel Imaging Systems Market, By Product, 2016–2023 (USD Million)
Table 40 Canada: Gel Documentation Instruments Market, By Type, 2016–2023 (USD Million)
Table 41 Canada: Gel Documentation Market, By Light Source, 2016–2023 (USD Million)
Table 42 Canada: Market, By Detection Technique, 2016–2023 (USD Million)
Table 43 Canada: Market, By Application, 2016–2023 (USD Million)
Table 44 Canada: Market, By End User, 2016–2023 (USD Million)
Table 45 Europe: Gel Imaging Systems Market, By Product, 2016–2023 (USD Million)
Table 46 Europe: Gel Documentation Instruments Market, By Type, 2016–2023 (USD Million)
Table 47 Europe: Gel Documentation Market, By Light Source, 2016–2023 (USD Million)
Table 48 Europe: Gel Imaging Systems Market, By Detection Technique, 2016–2023 (USD Million)
Table 49 Europe: Market, By Application, 2016–2023 (USD Million)
Table 50 Europe: Market, By End User, 2016–2023 (USD Million)
Table 51 Asia Pacific: Gel Imaging Systems Market, By Country, 2016–2023 (USD Million)
Table 52 Asia Pacific: Market, By Product, 2016–2023 (USD Million)
Table 53 Asia Pacific: Gel Documentation Instruments Market, By Type, 2016–2023 (USD Million)
Table 54 Asia Pacific: Gel Documentation Market, By Light Source, 2016–2023 (USD Million)
Table 55 Asia Pacific: Market, By Detection Technique, 2016–2023 (USD Million)
Table 56 Asia Pacific: Market, By Application, 2016–2023 (USD Million)
Table 57 Asia Pacific: Market, By End User, 2016–2023 (USD Million)
Table 58 Government Funding in Various Research Areas
Table 59 Japan: Gel Imaging Systems Market, By Product, 2016–2023 (USD Million)
Table 60 Japan: Gel Documentation Instruments Market, By Type, 2016–2023 (USD Million)
Table 61 Japan: Gel Documentation Market, By Light Source, 2016–2023 (USD Million)
Table 62 Japan: Market, By Detection Technique, 2016–2023 (USD Million)
Table 63 Japan: Market, By Application, 2016–2023 (USD Million)
Table 64 Japan: Market, By End User, 2016–2023 (USD Million)
Table 65 China: Gel Imaging Systems Market, By Product, 2016–2023 (USD Million)
Table 66 China: Gel Documentation Instruments Market, By Type, 2016–2023 (USD Million)
Table 67 China: Gel Documentation Market, By Light Source, 2016–2023 (USD Million)
Table 68 China: Market, By Detection Technique, 2016–2023 (USD Million)
Table 69 China: Market, By Application, 2016–2023 (USD Million)
Table 70 China: Market, By End User, 2016–2023 (USD Million)
Table 71 India: Gel Imaging Systems Market, By Product, 2016–2023 (USD Million)
Table 72 India: Gel Documentation Instruments Market, By Type, 2016–2023 (USD Million)
Table 73 India: Gel Documentation Market, By Light Source, 2016–2023 (USD Million)
Table 74 India: Market, By Detection Technique, 2016–2023 (USD Million)
Table 75 India: Market, By Application, 2016–2023 (USD Million)
Table 76 India: Market, By End User, 2016–2023 (USD Million)
Table 77 RoAPAC: Market, By Product, 2016–2023 (USD Million)
Table 78 RoAPAC: Gel Documentation Instruments Market, By Type, 2016–2023 (USD Million)
Table 79 RoAPAC: Gel Documentation Market, By Light Source, 2016–2023 (USD Million)
Table 80 RoAPAC: Market, By Detection Technique, 2016–2023 (USD Million)
Table 81 RoAPAC: Market, By Application, 2016–2023 (USD Million)
Table 82 RoAPAC: Market, By End User, 2016–2023 (USD Million)
Table 83 RoW: Gel Imaging Systems Market, By Product, 2016–2023 (USD Million)
Table 84 RoW: Gel Documentation Instruments Market, By Type, 2016–2023 (USD Million)
Table 85 RoW: Gel Documentation Market, By Light Source, 2016–2023 (USD Million)
Table 86 RoW: Market, By Detection Technique, 2016–2023 (USD Million)
Table 87 RoW: Market, By Application, 2016–2023 (USD Million)
Table 88 RoW: Market, By End User, 2016–2023 (USD Million)
List of Figures (35 Figures)
Figure 1 GlobalGel Imaging Systems Market
Figure 2 Global Market Country Coverage
Figure 3 Global Market Years Considered for the Study
Figure 4 Research Design
Figure 5 Breakdown of Primary Interviews: By Company Type, Designation, and Region
Figure 6 Bottom-Up Approach
Figure 7 Top-Down Approach
Figure 8 Data Triangulation Methodology
Figure 9 Gel Imaging Systems Market, By Product, 2018 vs 2023 (USD Million)
Figure 10 Gel Imaging Systems Market, By Light Source, 2018 vs 2023 (USD Million)
Figure 11 Gel Imaging Systems Market, By Detection Technique, 2018 vs 2023 (USD Million)
Figure 12 Gel Imaging Systems Market, By Application, 2018 vs 2023 (USD Million)
Figure 13 Gel Imaging Systems Market, By End User, 2018 vs 2023 (USD Million)
Figure 14 Gel Imaging Systems Market, By Region, 2018 vs 2023 (USD Million)
Figure 15 Increasing Incidence of Infectious Diseases & Genetic Disorders—Key Driver of the Gel Imaging Systems Market
Figure 16 Instruments Segment to Dominate the Asia Pacific Gel Imaging Systems Market in 2018
Figure 17 North America to Account for the Largest Market Share in 2018
Figure 18 India to Register the Highest Growth in the Gel Imaging Systems Market From 2018 to 2023
Figure 19 Drivers, Restraints, and Opportunities
Figure 20 Instruments Segment to Register the Highest Growth During the Forecast Period
Figure 21 Led-Based Light Sources to Dominate the Gel Imaging Systems Market During the Forecast Period
Figure 22 Chemiluminescence-Based Gel Imaging Systems to Register the Highest CAGR During the Forecast Period
Figure 23 Nucleic Acid Quantification Applications to Dominate the Gel Imaging Systems Market During the Forecast Period
Figure 24 Pharma & Biotech Companies Will Be the Fastest-Growing End-User Segment During the Forecast Period
Figure 25 North America to Dominate the Global Gel Imaging Systems Market in 2018
Figure 26 North America: Market Snapshot
Figure 27 Asia Pacific: Market Snapshot
Figure 28 Key Developments in the Market From 2015 to 2018
Figure 29 Market Ranking, By Key Player, 2017
Figure 30 Bio-Rad Laboratories: Company Snapshot (2017)
Figure 31 GE Healthcare: Company Snapshot (2017)
Figure 32 Thermo Fisher Scientific: Company Snapshot (2017)
Figure 33 Endress + Hauser Management AG: Company Snapshot (2017)
Figure 34 Scientific Digital Imaging PLC: Company Snapshot (2017)
Figure 35 Bio-Techne : Company Snapshot (2017)
The gel documentation systems market is projected to grow from USD 258 million in 2018 to USD 304 million by 2023, at a CAGR of 3.3% during the forecast period. The study involved four major activities to estimate the current market size for the global gel imaging systems market. Exhaustive secondary research was done to collect information on the market and its different subsegments. The next step was to validate these findings, assumptions, and sizing with industry experts across the value chain through primary research. Then, both top-down and bottom-up approaches were employed to estimate the complete market size. Thereafter, market breakdown and data triangulation were used to estimate the market size of segments and subsegments.
Secondary Research
In the secondary research process, sources such as annual reports, press releases & investor presentations of companies, white papers, certified publications, articles by recognized authors, gold-standard & silver-standard websites, regulatory bodies, and databases (such as D&B Hoovers, Bloomberg Business, and Factiva) were referred to in order to identify and collect information for this study.
Primary Research
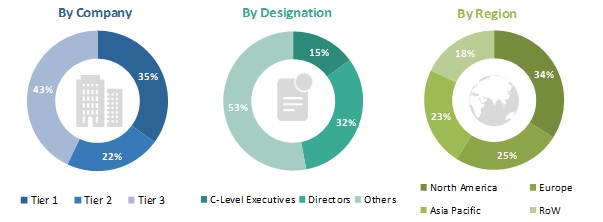
The global gel documentation systems market comprises several stakeholders such as global gel imaging systems manufacturers, vendors, and distributors; academic institutes, research institutes. The demand side of this market is characterized by significant use of gel imaging systems due to increasing investments in reseach & development in the pharmaceutical and biotechnology companies. Advancements in technology characterize the supply side. Various primary sources from both the supply and demand sides of the market were interviewed to obtain qualitative and quantitative information. The following is a breakdown of primary respondents:
To know about the assumptions considered for the study, download the pdf brochure
Market Size Estimation
Both top-down and bottom-up approaches were used to estimate and validate the total size of the gel imaging systems market. These methods were also used extensively to estimate the size of various subsegments in the market. The research methodology used to estimate the market size includes the following:
- The key players in the industry and markets have been identified through extensive secondary research.
- The industry’s supply chain and market size, in terms of value, have been determined through primary and secondary research processes.
- All percentage shares, splits, and breakdowns have been determined using secondary sources and verified through primary sources.
Data Triangulation
After arriving at the overall market size using the market size estimation processes as explained above the market was split into several segments and subsegments. To complete the overall market engineering process and arrive at the exact statistics of each market segment and subsegment, the data triangulation and market breakdown procedures were employed, wherever applicable. The data was triangulated by studying various factors and trends from both the demand and supply sides in the gel imaging systems market.
Report Objectives
- To define, describe, and forecast the global gel documentation systems market on the basis of product, light source, detection technique, application, end user, and region
- To provide detailed information regarding major factors influencing growth of the market (drivers, restraints, and opportunities)
- To strategically analyze the micromarkets1 with respect to individual growth trends, future prospects, and contributions to the total market
- To analyze the opportunities in the market for stakeholders and provide details of the competitive landscape for market leaders
- To forecast the revenue of the market segments with respect to four main regions, namely, North America, Europe, Asia Pacific, and the Rest of the World
- To strategically profile the key players and comprehensively analyze their market shares and core competencies2
- To track and analyze competitive developments such as new product launches; agreements, partnerships, and joint ventures; mergers and acquisitions; and research & development activities in the gel imaging systems market
Scope of the Report
|
Report Metric |
Details |
|
Market size available for years |
2016–2023 |
|
Base year considered |
2017 |
|
Forecast period |
2018–2023 |
|
Forecast units |
Value (USD) |
|
Segments covered |
Product, light source, detection technique, application, end user, and region |
|
Geographies covered |
North America (US & Canada), Europe, APAC (Japan, China, India, and RoAPAC), and the RoW |
|
Companies covered |
Major 10 players covered, including |
This research report categorizes the market into the following segments and subsegments:
Gel Documentation Systems Market, By Product
-
Instruments
- Digital gel documentation instruments
- Film gel documentation instruments
- Software
- Accessories
Gel Documentation Systems Market, By Light Source
- LED
- UV
- Laser
Gel Documentation Systems Market, By Detection Technique
- UV
- Chemiluminescence
- Fluorescence
Gel Documentation Systems Market, By Application
- Nucleic acid quantification
- Protein Quantification
- Others ( HLA Typing, Colony Counting)
Gel Documentation Systems Market, By End User
- Academic and Research Institutes
- Pharmaceutical and Biotechnology Companies
- Diagnostic Laboratories
Gel Documentation Systems Market, By Region
-
North America
- US
- Canada
- Europe
-
Asia Pacific
- Japan
- China
- India
- Rest of Asia Pacific
- Rest of the World*
* RoW includes Latin America, the Middle East, and Africa
Available Customizations
With the given market data, MarketsandMarkets offers customizations as per the company’s specific needs. The following customization options are available for the report:
- Product Analysis: Product matrix, which gives a detailed comparison of the product portfolios of each company
- Geographic Analysis: Further breakdown of the European, and the Rest of the World gel imaging systems market into their respective countries
- Company Information: Detailed analysis and profiling of additional market players (Up to 5)

 Generating Response ...


Growth opportunities and latent adjacency in Gel Documentation Systems Market