Harmonic Filter Market by Type (Active, and Passive), Voltage Level (Low Voltage Harmonic, Medium Voltage Harmonic, and High Voltage Harmonic), Phase, End User, and Region - Global Forecast to 2036


Harmonic Filter Market Summary
The Harmonic Filter Market was valued at approximately USD 1.2–1.4 billion in 2024 and is projected to reach USD 2.5–2.9 billion by 2036, expanding at a CAGR of 6.8%–7.8% during the forecast period (2025–2036). The market is experiencing robust growth as industries increasingly prioritize power quality, energy efficiency, and grid stability in modern electrical systems. The rapid proliferation of non-linear loads, such as variable frequency drives (VFDs), electric vehicles (EVs), data centers, and renewable energy systems, is generating harmonic distortions in power networks, thereby driving the need for advanced harmonic filtering solutions. Additionally, the integration of artificial intelligence (AI), Internet of Things (IoT), and automation technologies into power monitoring systems is transforming the market, enabling predictive maintenance, real-time analytics, and improved operational efficiency. The global push toward digital transformation and smart grid infrastructure is further accelerating the adoption of harmonic filters across industrial and commercial sectors.
Key Market Trends & Insights
The Harmonic Filter Market is shaped by evolving industrial demands and technological innovation. North America currently leads the market, supported by advanced grid infrastructure, strict power quality standards, and strong investments in smart energy systems. Meanwhile, Asia Pacific is the fastest-growing region, driven by rapid industrialization, expanding manufacturing sectors, and large-scale renewable energy deployments in countries like China and India.
Passive harmonic filters dominate the market due to their cost-effectiveness and reliability in stable load conditions. However, active harmonic filters are gaining significant traction due to their ability to dynamically respond to varying load conditions and provide superior harmonic mitigation.
Emerging trends include the integration of AI-driven monitoring systems that enable predictive analytics and automated fault detection. IoT-enabled harmonic filters are also becoming increasingly popular, allowing remote monitoring and seamless integration with smart grid systems.
Automation in industrial processes is contributing to higher harmonic distortion levels, thereby increasing the demand for advanced filtering solutions. Additionally, the rise of electric vehicle charging infrastructure and renewable energy integration is further fueling market growth.
Market Size & Forecast
-
Base year market size (2024): USD 1.2–1.4 billion
-
Forecast value by 2036: USD 2.5–2.9 billion
-
CAGR (2025–2036): 6.8%–7.8%
-
Growth is driven by increasing demand for power quality, expansion of renewable energy systems, rising industrial automation, and integration of AI and IoT technologies
Harmonic Filter Market Top 10 key takeaway
-
The market is expected to more than double by 2036.
-
North America remains the leading region due to advanced infrastructure.
-
Asia Pacific is the fastest-growing market driven by industrial expansion.
-
Passive harmonic filters dominate due to cost efficiency.
-
Active harmonic filters are gaining traction for dynamic applications.
-
AI and IoT integration are transforming power quality management.
-
Renewable energy integration is a major growth driver.
-
Industrial automation is increasing harmonic distortion levels.
-
EV charging infrastructure is boosting demand for harmonic filters.
-
Smart grid development is accelerating market adoption.
Product Insights
Passive harmonic filters currently dominate the Harmonic Filter Market due to their simplicity, reliability, and cost-effectiveness. These filters are widely used in applications with predictable and stable load conditions, such as industrial manufacturing plants and commercial buildings. Their ability to reduce harmonic distortion and improve power factor makes them a preferred choice for many end-users.
However, active harmonic filters are rapidly gaining momentum as industries demand more flexible and adaptive solutions. Unlike passive filters, active filters can dynamically adjust to changing load conditions, making them suitable for environments with fluctuating power demands, such as data centers and renewable energy systems. Hybrid harmonic filters, which combine the benefits of both passive and active technologies, are also emerging as a promising segment.
The integration of AI into product design is enabling advanced features such as real-time harmonic analysis, predictive maintenance, and automated system optimization. These innovations are enhancing the performance and reliability of harmonic filters, making them indispensable in modern power systems.
Technology / Component Insights
The Harmonic Filter Market is driven by advancements in power electronics, control systems, and digital monitoring technologies. Key components include capacitors, inductors, resistors, and advanced control units that work together to mitigate harmonic distortions.
AI and machine learning algorithms are increasingly being integrated into harmonic filtering systems to enable predictive analytics and fault detection. These technologies allow operators to identify potential issues before they escalate, reducing downtime and maintenance costs.
IoT-enabled harmonic filters are transforming the market by enabling real-time data collection, remote monitoring, and seamless integration with cloud-based platforms. This connectivity allows for centralized control and improved decision-making across power networks.
Automation is playing a critical role in modern electrical systems, increasing the use of non-linear loads and, consequently, the need for harmonic mitigation. Future innovations are expected to focus on smart filters capable of self-learning and adapting to changing grid conditions, further enhancing system efficiency and reliability.
Application Insights
The industrial sector is the largest application segment in the Harmonic Filter Market, driven by the widespread use of heavy machinery, variable frequency drives, and automated production systems. These systems generate significant harmonic distortions, necessitating the use of harmonic filters to maintain power quality and protect equipment.
The commercial sector, including data centers, hospitals, and office buildings, is also witnessing increasing adoption of harmonic filters. The growing reliance on electronic devices and IT infrastructure is contributing to higher harmonic levels, driving the demand for effective filtering solutions.
In the renewable energy sector, harmonic filters are essential for integrating solar and wind power into the grid. These systems help maintain grid stability and ensure efficient energy transmission. The rising adoption of electric vehicles and the expansion of EV charging infrastructure are further creating new opportunities for harmonic filter deployment.
Future growth is expected in emerging applications such as smart grids, microgrids, and energy storage systems, where maintaining power quality is critical for optimal performance.
Regional Insights
North America dominates the Harmonic Filter Market due to its advanced electrical infrastructure, strict regulatory standards, and high adoption of smart grid technologies. The presence of major industry players and continuous investments in energy efficiency further support market growth in this region.
Europe follows closely, with strong demand driven by renewable energy integration and stringent energy efficiency regulations. The region’s focus on sustainability and carbon reduction is encouraging the adoption of advanced harmonic filtering solutions.
Asia Pacific is the fastest-growing region, fueled by rapid industrialization, urbanization, and increasing investments in infrastructure development. Countries like China and India are witnessing significant growth due to expanding manufacturing sectors and rising energy demand.
-
North America leads due to advanced grid infrastructure
-
Europe shows strong growth in renewable energy integration
-
Asia Pacific is the fastest-growing region
-
Industrialization is driving demand in emerging economies
-
Government regulations are boosting adoption globally
Country-Specific Market Trends
In Asia Pacific, China is leading the market with a CAGR of 7%–8%, driven by its large-scale industrial base and significant investments in renewable energy and smart grid infrastructure. Japan is also a key market, with a CAGR of 6%–7%, focusing on advanced power electronics and precision energy management systems.
In North America, the United States dominates the market with a CAGR of 6%–7%, supported by strong industrial demand and technological innovation. Canada and Mexico are experiencing steady growth due to expanding manufacturing and infrastructure development.
In Europe, Germany and France are prominent markets, each growing at a CAGR of 6%–7%. Germany’s strong industrial sector and France’s emphasis on energy efficiency and sustainability are driving demand for harmonic filters.
-
China leads APAC growth with strong industrial demand
-
Japan focuses on advanced power technologies
-
United States dominates North American market
-
Canada and Mexico show steady growth
-
Germany and France drive European market expansion
Key Harmonic Filter Market Company Insights
The Harmonic Filter Market is highly competitive, with several key players focusing on innovation, product development, and strategic partnerships. Major companies include ABB Ltd., Siemens AG, Schneider Electric SE, Eaton Corporation plc, General Electric Company, Mitsubishi Electric Corporation, TDK Corporation, Danfoss A/S, and Larsen & Toubro Limited.
These companies are investing heavily in R&D to develop advanced harmonic filtering solutions with enhanced efficiency and reliability. AI integration is a key focus area, enabling smart monitoring and predictive maintenance capabilities.
Product strategies include the development of modular and scalable solutions to cater to diverse industry needs. Companies are also expanding their presence in emerging markets through partnerships and acquisitions.
-
Companies focus on innovation and R&D investment
-
AI integration is a key strategic priority
-
Development of modular solutions is increasing
-
Partnerships enhance technological capabilities
-
Expansion into emerging markets drives growth
Recent Developments
Recent developments in the Harmonic Filter Market highlight the growing emphasis on digitalization and smart technologies. Several companies have introduced AI-enabled harmonic filters capable of real-time monitoring and predictive analytics, improving system performance and reliability.
Strategic collaborations between power electronics manufacturers and software providers are enabling the development of IoT-based harmonic filtering solutions for smart grid applications.
Additionally, new product launches focusing on compact and energy-efficient designs are addressing the growing demand for space-saving and sustainable solutions in industrial and commercial sectors.
Market Segmentation
The Harmonic Filter Market is segmented based on product, technology, application, and region. By product, the market includes passive harmonic filters, active harmonic filters, and hybrid filters, with passive filters currently dominating due to their cost-effectiveness.
In terms of technology, the market is driven by advancements in power electronics, AI-based control systems, and IoT-enabled monitoring solutions. These technologies are enhancing the efficiency and functionality of harmonic filters.
By application, the market spans industrial, commercial, and residential sectors, with the industrial segment leading due to high levels of harmonic distortion in manufacturing processes.
Regionally, the market is divided into North America, Europe, Asia Pacific, and the rest of the world, with North America leading and Asia Pacific showing the fastest growth.
-
Passive filters dominate product segment
-
AI and IoT are transforming technology landscape
-
Industrial sector leads application demand
-
North America leads regional market
-
Asia Pacific shows highest growth potential
The Harmonic Filter Market is poised for significant growth through 2036, driven by the increasing need for power quality, energy efficiency, and grid stability. The integration of AI, IoT, and automation is transforming harmonic filtering solutions, enabling smarter and more efficient power management systems.
As industries continue to adopt advanced technologies and renewable energy systems, the demand for harmonic filters is expected to rise significantly. The market presents substantial opportunities for innovation and expansion, making it a critical component of modern electrical infrastructure and a strategic investment area for businesses worldwide.
FAQs
-
What is the current size of the Harmonic Filter Market?
The market was valued at approximately USD 1.2–1.4 billion in 2024. -
What is the expected growth rate of the market?
The market is expected to grow at a CAGR of 6.8%–7.8% from 2025 to 2036. -
What are the key drivers of the Harmonic Filter Market?
Key drivers include increasing demand for power quality, renewable energy integration, industrial automation, and adoption of AI and IoT technologies. -
Which region leads the market?
North America currently leads the Harmonic Filter Market. -
Who are the major players in the market?
Key companies include ABB Ltd., Siemens AG, Schneider Electric SE, Eaton Corporation plc, and General Electric Company.
To speak to our analyst for a discussion on the above findings, click Speak to Analyst
 Exclusive indicates content/data unique to MarketsandMarkets and not available with any competitors.
Table of Contents
1 Introduction (Page No. - 16)
1.1 Objectives of the Study
1.2 Definition
1.3 Study Scope
1.3.1 Geographic Scope
1.3.2 Years Considered for the Study
1.4 Currency
1.5 Package Size
1.6 Limitations
1.7 Stakeholders
2 Research Methodology (Page No. - 20)
2.1 Research Data
2.1.1 Secondary Data
2.1.1.1 Key Secondary Sources
2.1.1.2 List of Major Secondary Sources
2.1.2 Primary Data
2.1.2.1 Key Primary Sources
2.1.2.2 Key Industry Insights
2.1.2.3 Breakdown of Primaries
2.2 Market Size Estimation
2.2.1 Approach for Capturing the Market Share By Bottom-Up Analysis (Demand Side)
2.2.2 Approach for Capturing the Market Share By Top-Down Analysis (Supply Side)
2.3 Market Breakdown and Data Triangulation
2.4 Research Assumptions
3 Executive Summary (Page No. - 28)
4 Premium Insights (Page No. - 32)
4.1 Attractive Opportunities for the Harmonic Filter Market
4.2 Harmonic Filter Market, By Type
4.3 Market, By Voltage Level
4.4 Market, By End User
4.5 Market, By Phase
5 Market Overview (Page No. - 35)
5.1 Introduction
5.2 Market Dynamics: Harmonic Filter Market
5.2.1 Drivers
5.2.1.1 Rising Need for High Power Quality and Reliability
5.2.1.2 Increased Adoption of Variable Frequency Drives (VFDS)
5.2.1.3 Stringent Government Regulations Pertaining to Power Quality and Reliability
5.2.1.4 Increasing Awareness of Negative Effects of Harmonic Disturbances
5.2.2 Restraints
5.2.2.1 High Cost of Harmonic Filters and Their Cost of Installation and Maintenance
5.2.2.2 Availability of Substitutes for Harmonics Filters
5.2.3 Opportunities
5.2.3.1 Increasing Demand in Commercial Applications
5.2.3.2 Increasing Automation Across End-User Industries
5.2.4 Challenges
5.2.4.1 Less Awareness About Active Harmonic Filters
5.2.4.2 Fluctuating Prices of Oil and Gas
6 Industry Trends (Page No. - 42)
6.1 Introduction
6.2 Value Chain Analysis
6.2.1 Research and Development
6.2.2 Component Providers
6.2.3 Manufacturers
6.2.4 Marketing and Sales
6.2.5 End Users
6.3 Key Trends: Harmonic Filter Market
6.4 Government Standards and Regulations Related to the Market
7 Harmonic Filter Market, By Type (Page No. - 45)
7.1 Introduction
7.2 Active Harmonic Filter (AHF)
7.3 Passive Harmonic Filter (PHF)
7.3.1 Tuned Passive Harmonic Filter
7.3.2 Detuned Passive Harmonic Filter
8 Harmonic Filter Market, By Voltage Level (Page No. - 51)
8.1 Introduction
8.2 Low-Voltage Harmonic Filters
8.3 Medium-Voltage Harmonic Filters
8.4 High-Voltage Harmonic Filters
9 Harmonic Filter Market, By End-User (Page No. - 57)
9.1 Introduction
9.2 Industrial
9.2.1 Manufacturing
9.2.2 Metal Processing
9.2.3 Pulp and Paper
9.2.4 Automotive
9.2.5 Oil and Gas
9.2.6 Others
9.2.6.1 Water Treatment
9.2.6.2 Packaging
9.2.6.3 Food Processing
9.3 Commercial
9.4 Residential
10 Harmonic Filter Market, By Phase (Page No. - 64)
10.1 Introduction
10.2 Single-Phase Harmonic Filter
10.3 Three-Phase Harmonic Filter
11 Geographic Analysis (Page No. - 69)
11.1 Introduction
11.2 North America
11.2.1 US
11.2.2 Rest of North America
11.3 Europe
11.3.1 UK
11.3.2 Germany
11.3.3 France
11.3.4 Rest of Europe
11.4 Asia Pacific (APAC)
11.4.1 China
11.4.2 Japan
11.4.3 India
11.4.4 Rest of APAC
11.5 RoW
11.5.1 Middle East
11.5.2 Africa
11.5.3 Latin America
12 Competitive Landscape (Page No. - 101)
12.1 Introduction
12.2 Market Ranking Analysis, 2016
12.3 Competitive Situations and Trends
12.4 Vendor Dive Overview
12.4.1 Dynamic Players
12.4.2 Emerging Players
12.4.3 Vanguards
12.4.4 Innovators
12.4.5 Dive Chart
12.5 Business Startegies Adopted By Major Players in the Harmonic Filter Market (25 Players)
12.6 Analysis of Product Portfolio of Major Players in the Market (25 Players)
ABB Ltd. (Switzerland),Schneider Electric Se (France), Eaton Corporation PLC (Ireland), Siemens AG (Germany), Schaffner Holding AG (Switzerland), Danfoss A/S (Denmark),Crompton Greaves Ltd. (India), Larsen & Toubro Limited (India), Arteche (Spain), Mirus International Inc. (Canada), Reo AG (Germany), Phaseco, Inc. (The US), Afp Transformers (The US), Finmotor Srl (Italy), Baron Power Limited (India), TDK Corporation (Japan), TCI, LLC (The US), AVX Corporation (The US), Mesta Electronics, Inc. (The US), Astrodyne Tdi Power Supplies & Emi Filters (The US), Shandong Hoteam Electric Co., Ltd. (China), Comsys Ab (Sweden), Mte Corporation (The US), LPI-NZ Ltd. (Australia), Nhp (New Zealand)
13 Company Profiles (Page No. - 108)
(Business Overview, Products Offered & Services Strategies, Key Relationship, Recent Developments, MnM View)*
13.1 Introduction
13.2 ABB Ltd.
13.3 Schneider Electric Se
13.4 Eaton Corporation PLC
13.5 Schaffner Holding AG
13.6 Siemens AG
13.7 CG Power and Industrial Solutions Limited (CG)
13.8 TDK Corporation
13.9 Larsen & Toubro Limited (L&T)
13.10 Arteche
13.11 AVX Corporation
13.12 Mte Corporation
13.13 Comsys Ab
13.14 Enspec Power Ltd
13.15 Mirus International Inc.
13.16 LPI-NZ Ltd
13.17 Mesta Electronic Inc.
13.18 Reo AG
13.19 Baron Power Ltd
13.20 TCI, LLC
13.21 Danfoss A/S
13.22 Key Innovators
13.22.1 Sinexcel Electric Co., Ltd
13.22.2 LPI-NZ Ltd
13.22.3 Clariant Power System Ltd.
13.22.4 Inphase Power Technologies Private Limited
13.22.5 Rem Electromach Pvt. Ltd.
*Details on Business Overview, Products Offered & Services Strategies, Key Relationship, Recent Developments, MnM View Might Not Be Captured in Case of Unlisted Companies.
14 Appendix (Page No. - 162)
14.1 Insights of Industry Experts
14.2 Discussion Guide
14.3 Knowledge Store: Marketsandmarkets’ Subscription Portal
14.4 Introducing RT: Real-Time Market Intelligence
14.5 Available Customizations
14.6 Related Reports
14.7 Author Details
List of Tables (75 Tables)
Table 1 Comparison Between Active and Passive Harmonic Filters
Table 2 Harmonic Filter Market, By Type, 2014–2023 (USD Million)
Table 3 Market, By Type, 2014–2023 (Million Units)
Table 4 Harmonic Filter Market for Active Harmonic Filter, By Region, 2014–2023 (USD Million)
Table 5 Market for Passive Harmonic Filter, By Region, 2014–2023 (USD Million)
Table 6 Harmonic Filter Market, By Voltage Level, 2014–2023 (USD Million)
Table 7 Low-Voltage Market, By Region, 2014–2023 (USD Million)
Table 8 Medium-Voltage Market, By Region, 2014–2023 (USD Million)
Table 9 High-Voltage Market, By Region, 2014–2023 (USD Million)
Table 10 Harmonic Filter Market, By End User, 2014–2023 (USD Million)
Table 11 Market for Industrial End User, By Region, 2014–2023 (USD Million)
Table 12 Market for Commercial End User, By Region, 2014–2023 (USD Million)
Table 13 Market for Residential End User, By Region, 2014–2023 (USD Million)
Table 14 Market, By Phase, 2014–2023 (USD Million)
Table 15 Harmonic Filter Market in North America, By Phase, 2014–2023 (USD Million)
Table 16 Market in Europe, By Phase, 2014–2023 (USD Million)
Table 17 Market in APAC, By Phase, 2014–2023 (USD Million)
Table 18 Market in RoW, By Phase, 2014–2023 (USD Million)
Table 19 Harmonic Filter Market, By Region, 2014–2023 (USD Million)
Table 20 Market in US, By Type, 2014–2023 (USD Million)
Table 21 Market in US, By Voltage Level, 2014–2023 (USD Million)
Table 22 Market in US, By End User, 2014–2023 (USD Million)
Table 23 Harmonic Filter Market in Rest of North America, By Type, 2014–2023 (USD Million)
Table 24 Market in Rest of North America, By Voltage Level, 2014–2023 (USD Million)
Table 25 Market in Rest of North America, By End User, 2014–2023 (USD Million)
Table 26 Market in North America, By Country, 2014–2023 (USD Million)
Table 27 Market in North America, By Type, 2014–2023 (USD Million)
Table 28 Market in North America, By Voltage Level, 2014–2022 (USD Million)
Table 29 Market in North America, By End User, 2014–2023 (USD Million)
Table 30 Harmonic Filter Market in Europe, By Type, 2014–2023 (USD Million)
Table 31 Market in Europe, By Voltage Level, 2014–2023 (USD Million)
Table 32 Market in Europe, By End User, 2014–2023 (USD Million)
Table 33 Market in Europe, By Country, 2014–2023 (USD Million)
Table 34 Harmonic Filter Market in UK, By Type, 2014–2023 (USD Million)
Table 35 Market in UK, By Voltage Level, 2014–2023 (USD Million)
Table 36 Market in UK, By End User, 2014–2023 (USD Million)
Table 37 Market in Germany, By Type, 2014–2023 (USD Million)
Table 38 Market in Germany, By Voltage Level, 2014–2023 (USD Million)
Table 39 Market in Germany, By End User, 2014–2023 (USD Million)
Table 40 Market in France, By Type, 2014–2023 (USD Million)
Table 41 Market in France, By Voltage Level, 2014–2023 (USD Million)
Table 42 Market in France, By End User, 2014–2023 (USD Million)
Table 43 Market in Rest of Europe, By Type, 2014–2023 (USD Million)
Table 44 Market in Rest of Europe, By Voltage Level, 2014–2023 (USD Million)
Table 45 Market in Rest of Europe, By End User, 2014–2023 (USD Million)
Table 46 Market in APAC, By Type, 2014–2023 (USD Million)
Table 47 Market in APAC, By Voltage Level, 2014–2023 (USD Million)
Table 48 Market in APAC, By End User, 2014–2023 (USD Million)
Table 49 Market in APAC, By Country, 2014–2023 (USD Million)
Table 50 Harmonic Filter Market in China, By Type, 2014–2023 (USD Million)
Table 51 Market in China, By Voltage Level, 2014–2023 (USD Million)
Table 52 Market in China, By End User, 2014–2023 (USD Million)
Table 53 Market in Japan, By Type, 2014–2023 (USD Million)
Table 54 Market in Japan, By Voltage Level, 2014–2023 (USD Million)
Table 55 Market in Japan, By End User, 2014–2023 (USD Million)
Table 56 Market in India, By Type, 2014–2023 (USD Million)
Table 57 Market in India, By Voltage Level, 2014–2023 (USD Million)
Table 58 Market in India, By End User, 2014–2023 (USD Million)
Table 59 Market in Rest of APAC, By Type, 2014–2023 (USD Million)
Table 60 Market in Rest of APAC, By Voltage Level, 2014–2023 (USD Million)
Table 61 Market in Rest of APAC, By End User, 2014–2023 (USD Million)
Table 62 Harmonic Filter Market in RoW, By Type, 2014–2023 (USD Million)
Table 63 Market in RoW, By Voltage Level, 2014–2023 (USD Million)
Table 64 Market in RoW, By End User, 2014–2023 (USD Million)
Table 65 Market in RoW, By Region, 2014–2023 (USD Million)
Table 66 Harmonic Filter Market in Middle East, By Type, 2014–2023 (USD Million)
Table 67 Market in Middle East, By Voltage Level, 2014–2023 (USD Million)
Table 68 Market in Middle East, By End User, 2014–2023 (USD Million)
Table 69 Market in Africa, By Type, 2014–2023 (USD Million)
Table 70 Market in Africa, By Voltage Level, 2014–2023 (USD Million)
Table 71 Market in Africa, By End User, 2014–2023 (USD Million)
Table 72 Harmonic Filter Market in Latin America, By Type, 2014–2023 (USD Million)
Table 73 Market in Latin America, By Voltage Level, 2014–2023 (USD Million)
Table 74 Market in Latin America, By End User, 2014–2023 (USD Million)
Table 75 Ranking of the Top 5 Players in the Harmonic Filter Market, 2016
List of Figures (46 Figures)
Figure 1 Harmonic Filter Market Segmentation
Figure 2 Harmonic Filter Market: Research Design
Figure 3 Market Size Estimation Methodology: Bottom-Up Approach
Figure 4 Market Size Estimation Methodology: Top-Down Approach
Figure 5 Data Triangulation Methodology
Figure 6 Passive Harmonic Filters Expected to Hold the Larger Share of the Market in 2023
Figure 7 Low-Voltage Harmonic Filters Expected to Grow at the Highest Rate During the Forecast Period
Figure 8 Industrial Segment Expected to Hold the Largest Share of the Market During the Forecast Period
Figure 9 3-Phase Harmonic Filters Expected to Grow at the Highest Rate During the Forecast Period
Figure 10 APAC Held the Largest Share of the Harmonic Filter Market in 2017
Figure 11 Increasing Demand for Industrial and Commercial Applications to Drive the Growth of the Market During the Forecast Period
Figure 12 Active Harmonic Filters Expected to Witness the Highest Growth Rate (2017–2023)
Figure 13 Low-Voltage Harmonic Filters Held the Largest Share of the Harmonic Filter Market in 2017
Figure 14 Industrials End-User Expected to Dominate the Market During 2017–2023
Figure 15 3-Phase Harmonic Filters Expected to Grow at the Highest Rate During the Forecast Period
Figure 16 Rest of APAC Held the Largest Share of the Market in APAC in 2017
Figure 17 Harmonic Filter Market: Value Chain Analysis
Figure 18 Harmonic Filter Market, By Type
Figure 19 Market for Active Harmonic Filter Expected to Grow at the Highest Rate During the Forecast Period
Figure 20 Harmonic Filter Market, By Voltage Level
Figure 21 Market for Low-Voltage Harmonic Filter Expected to Witness the Highest Growth Rate During the Forecast Period
Figure 22 Harmonic Filter Market, By Type
Figure 23 Market for 3-Phase Harmonic Filter Expected to Grow at the Highest Rate Between 2017 and 2023
Figure 24 Harmonic Filter Market, By Region
Figure 25 Geographic Snapshot: Market in APAC Expected to Grow at the Highest Rate Between 2017 and 2023
Figure 26 North America: Harmonic Filter Market Snapshot
Figure 27 US Expected to Hold the Largest Share of the North American Market During the Forecast Period
Figure 28 Europe: Harmonic Filter Market Snapshot
Figure 29 Rest of Europe Expected to Hold the Largest Share of the Market During the Forecast Period in Europe
Figure 30 APAC: Harmonic Filter Market Snapshot
Figure 31 Market in China Expected to Grow at the Highest Rate During the Forecast Period in APAC
Figure 32 Companies Adopted New Product Launches as the Key Growth Strategy
Figure 33 Market Evaluation Framework: Contracts, Partnerships, and Agreements Fuelled Growth and Innovation Between 2014 and 2016
Figure 34 Battle for Market Share: Contracts, Partnerships, and Agreements Were the Key Strategies Adopted Between 2014 and 2016
Figure 35 Geographic Revenue Mix of Major Players in the HF Market, 2016
Figure 36 ABB Ltd.: Company Snapshot
Figure 37 Schneider Electric Se: Company Snapshot
Figure 38 Eaton Corporation PLC: Company Snapshot
Figure 39 Schaffner Holding AG: Company Snapshot
Figure 40 Siemens AG: Company Snapshot
Figure 41 CG Power and Industrial Solutions Limited: Company Snapshot
Figure 42 TDK Corporation: Company Snapshot
Figure 43 Larsen & Toubro Limited: Company Snapshot
Figure 44 Arteche: Company Snapshot
Figure 45 AVX Corporation: Company Snapshot
Figure 46 Danfoss A/S: Company Snapshot
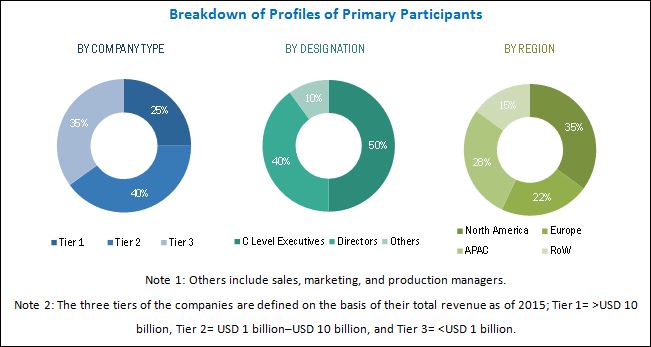
After arriving at the overall market size, the total market has been split into several segments and subsegments, and confirmed with key industry experts. The following figure depicts the breakdown of primaries conducted during the research study on the basis of company type, designation, and region.
To know about the assumptions considered for the study, download the pdf brochure
Market Ecosystem
The harmonic filter market ecosystem includes component providers, such as Koninklijke Philips N.V.(Netherlands), Fuji Component Parts USA, Inc.(US), and Siemens AG (Germany), and manufacturers, such as ABB Ltd. (Switzerland), Baron Power Limited (India), Comsys AB (Sweden), Schneider Electric SE (France), Eaton Corporation Plc (Ireland), Danfoss A/S (Denmark), Siemens AG (Germany), Crompton Greaves Ltd. (India), TDK Corporation (Japan), Schaffner Holding AG (Switzerland), MTE Corporation (US), TCI, LLC (US), Enspec Power Ltd. (UK), Larsen & Toubro Limited (India), Arteche (Spain), AVX Corporation (US), Mirus International Inc. (Canada), LPI-NZ Ltd. (Australia), Mesta Electronics, Inc. (US), and REO AG (Germany).
Target Audience
- Technology providers
- Research organizations
- Government organizations
- Technology investors
- Technology standards organizations
- Forums, alliances, and associations, and government bodies
- Venture capitalists
- Private equity firms, analysts, and strategic business planners
Scope of the Report
This research report categorizes the overall harmonic filter market on the basis of type, voltage level, phase, end user, and region.
Harmonic Filter Market, By Type
- Active
- Passive
Harmonic Filter Market, By Voltage Level
- Low Voltage Harmonic
- Medium Voltage Harmonic
- High Voltage Harmonic
Harmonic Filter Market, By Phase
- 1-Phase
- 3-Phase
Harmonic Filter Market, By End-User
- Industrial
- Commercial
- Residential
Harmonic Filter Market, By Region
-
North America
- US
- Canada
-
Europe
- UK
- Germany
- France
- Rest of Europe
-
APAC
- China
- Japan
- India
- Rest of APAC
-
RoW
- Middle East
- Africa
- Latin America
Available Customizations
With the given market data, MarketsandMarkets offers customizations according to the company’s specific needs. The following customization options are available for the report:
Regional Analysis
Further breakdown of region-/country-specific analysis
Company Information
Detailed analysis and profiling of additional market players (up to 5)


Growth opportunities and latent adjacency in Harmonic Filter Market
I am trying to gain market information for Australia harmonic fileter market in terms of types and applications.
Which companies design customized harmonic filters for MV/HV applications in Europe and Asia?
I am looking forward to learn how to design and select reactor for Harmonic filtration for 11KV System and 33KV system. Does the report include details about the customized manufacturers of harmonic filters.