
EMC Filtration Market Size, Share & Trends

EMC Filtration Market Size, Share & Trends by EMC Filter (1-phase EMC Filters, 3-phase EMC Filters, DC Filters, IEC Inlets, and Chokes) and Power Quality Filter (Passive Harmonic Filters, Active Harmonic Filters, Output Filters and Reactors) - Global Forecast to 2030


EMC FILTRATION MARKET SIZE, SHARE & TRENDS
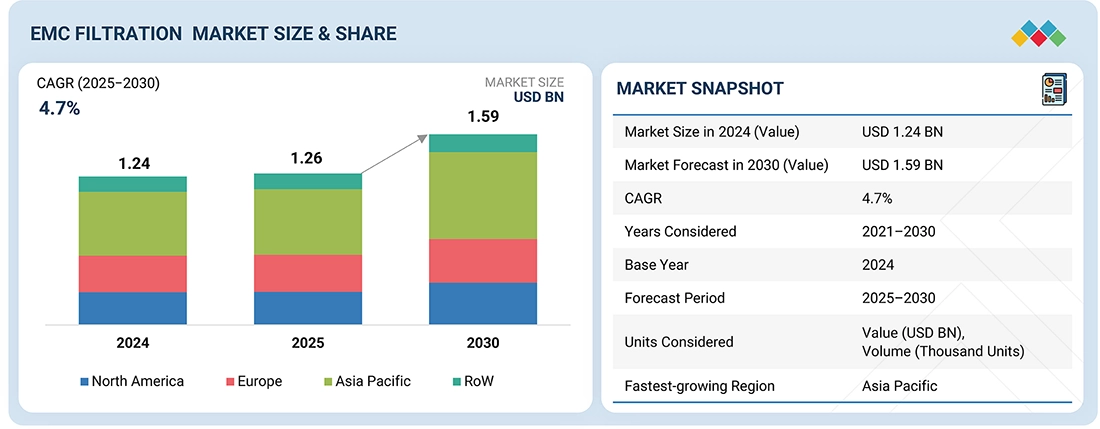
According to Marketsandmarkets, the global EMC filtration market size was valued at USD 1.26 billion in 2025 and is projected to grow reach USD 1.59 billion by 2030, growing at a CAGR of 4.7% from 2025 to 2030. The market worldwide is experiencing strong growth due to rising electromagnetic interference (EMI) in sectors like industrial automation, building technologies, energy and utilities, EV charging, medical devices, data centers, SMPS and power supplies, energy storage solutions, UPS, oil and gas, and military applications. As industries adopt advanced automation, digital technologies, and interconnected devices, mitigating EMI becomes crucial to ensure system reliability and meet regulatory standards. The growth of electric vehicles (EVs), smart grids, and 5G networks has increased the need for high-quality EMC filters that can manage complex power electronics and signal environments.
MARKET SNAPSHOT TABLE
| REPORT METRIC | DETAILS |
|---|---|
| Market Size in 2025 (Value) | USD 1.26 Billion |
| Market Forecast in 2030 (Value) | USD 1.59 Billion |
| Growth Rate | CAGR of 4.7% from 2025-2030 |
| Years Considered | 2021-2030 |
| Base Year | 2024 |
| Forecast Period | 2025-2030 |
| Units Considered | Value (USD Million/Billion), Volume (Thousand Units) |
| Report Coverage | Revenue forecast, company ranking, competitive landscape, growth factors, and trends |
| Top Companies |
|
| Growth Drivers |
|
| Segments Covered |
|
| Regions Covered | North America, Europe, Asia Pacific, RoW |
Market Size & Forecast
• 2025 Market Size: USD 1.26 Billion
• 2030 Projected Market Size: USD 1.59 Billion
• CAGR (2025-2030): 4.7%
• EMC filters Segment: Largest Market Share
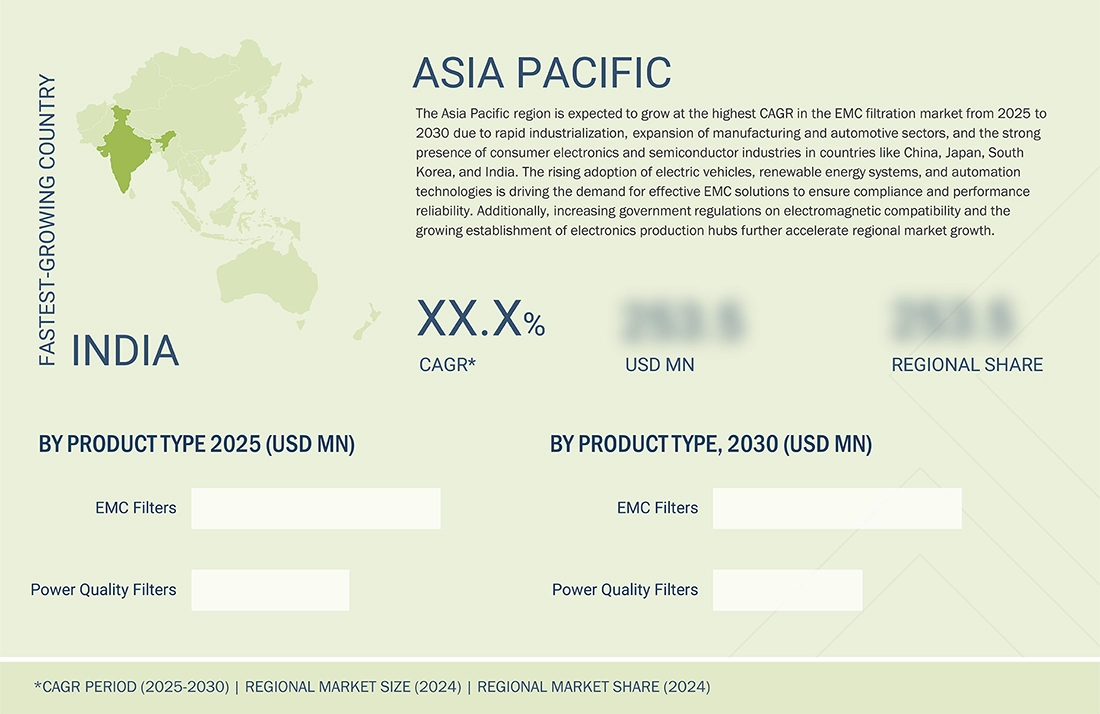
• Asia Pacific: Market Revenue Share
KEY TAKEAWAYS
- By region, the Asia Pacific market accounted for a 42.9% revenue share in 2024.
- By product type, the EMC filters segment holds the largest market share in 2024.
- By appliction, the Industrial automation segment accounts for the largest share
- TDK Corporation, TE Connectivity, and Delta Electronics, Inc.,were identified as some of the star players in the EMC filtration market (global), given their strong market share and product footprint.
- Elcom International, Electrocube, and EMI Solutions among others, have distinguished themselves among startups and SMEs by securing strong footholds in specialized niche areas, underscoring their potential as emerging market leaders
The increasing use of hybrid and electric vehicles has driven the adoption of power-dense electronic components like high-voltage batteries, DC–DC converters, inverters, and onboard chargers. These components generally operate with high-frequency switching, which can produce electromagnetic interference (EMI) that impacts the performance of critical systems, including control electronics and infotainment modules. Filtration solutions are incorporated into vehicle power electronics to comply with automotive electromagnetic compatibility (EMC) standards and ensure system reliability. As vehicle electrification continues to expand globally, the need for EMC filters is expected to grow in line with changing regulatory and operational demands.
Source: Secondary Research, Interviews with Experts, MarketsandMarkets Analysis
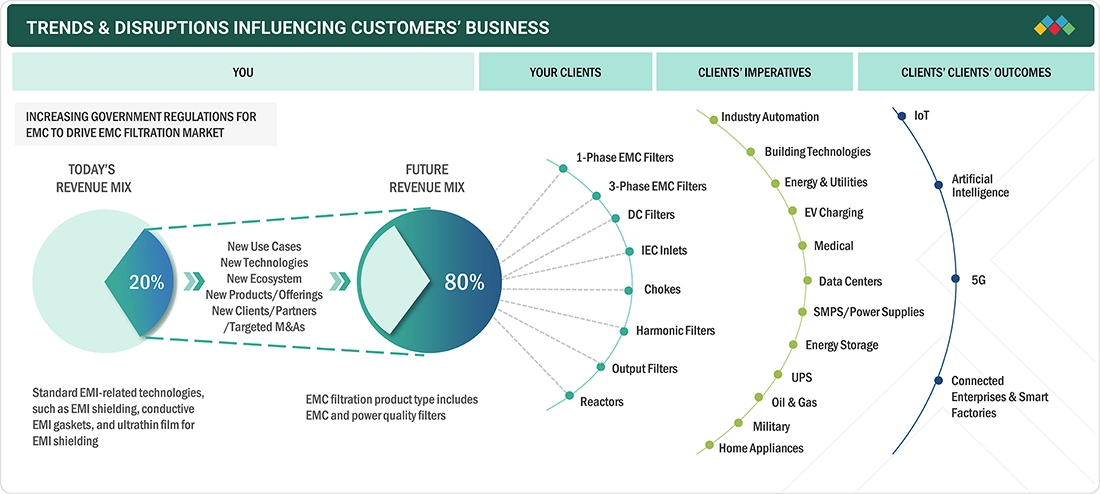
TRENDS & DISRUPTIONS IMPACTING CUSTOMERS' CUSTOMERS
The EMC filtration market trends is shaped by the miniaturization of electronic components, increasing frequencies, and the growing need to lower interference-related maintenance costs in industrial systems. The growth of industrial automation, robotics, and smart factories, along with the adoption of IoT and AI technologies, is promoting the integration of EMC filters across sectors such as electronics, energy, telecommunications, and manufacturing. To seize emerging opportunities, companies are expanding product lines and advancing filter technologies to manage higher power and current levels, as exemplified by Schaffner’s new FN3287 and FN3288 series. These innovations are boosting performance, ensuring compliance, and opening new revenue streams within the evolving EMC filtration industry.
Source: Secondary Research, Interviews with Experts, MarketsandMarkets Analysis
MARKET DYNAMICS
Level
-
Surging industrial automation and robotics

-
Increasing implementation of stringent regulations to reduce EMI

Level
-
High manufacturing costs

-
Availability of alternative technologies

Level
-
Mounting demand for miniaturized electronic devices

-
Rising government initiatives to promote renewable energy

Level
-
Adherence to stringent regulations with rapid technological innovation

-
Ineffectiveness in high-switching-speed applications

Source: Secondary Research, Interviews with Experts, MarketsandMarkets Analysis
Driver: Surging industrial automation and robotics
The rapid adoption of industrial automation and robotics is a major driver of the EMC filtration market growth. As factories become more connected and automated, the demand for high-performance EMC filters increases to ensure reliable operation of equipment like robotic arms, conveyors, and control systems in high-interference environments. These filters help meet strict EMI standards while supporting miniaturization and cost effectiveness. Moreover, the growth of Industrial IoT (IIoT) and Industry 4.0 initiatives, supported by government backing and investments, further boosts demand by requiring continuous, interference-free machine communication and performance. This trend is encouraging EMC filter manufacturers to develop advanced, optimized solutions designed for the increasingly digital and automated industrial landscape.
Restraint: High manufacturing costs
The increasing complexity of EMC filters, driven by modern standards reaching up to 1 GHz, demands advanced components, precise manufacturing, and effective EMI shielding, all of which raise production costs. Simplifying designs to cut expenses can affect performance and reliability. Integrating design early in the process is critical to meet regulatory requirements, as non-compliance could lead to expensive redesigns and launch delays, ultimately restricting market growth.
Opportunity: Mounting demand for miniaturized electronic devices
The push for smaller, more powerful electronic devices drives demand for compact, efficient EMC filters that reduce interference and preserve signal integrity. Advanced materials and innovative designs, like multilayer ceramic capacitors and evanescent mode cavity filters, enable high-performance miniaturized filters for 5G, IoT, and next-generation wireless applications. This trend creates growth opportunities across consumer electronics, healthcare, and telecommunications.
Challenge: Adherence to stringent regulations with rapid technological innovation
Rapid advancements in technologies like 5G, AI, and IoT create complex high-speed systems that produce unexpected electromagnetic interference, making compliance with changing EMC standards difficult. Manufacturers need to invest in advanced filter solutions while managing higher R&D costs, longer development cycles, and integration into compact, power-dense devices. Agility, innovation, and cost-efficiency are vital to stay competitive in this rapidly evolving landscape.
EMC Filtration Market: COMMERCIAL USE CASES ACROSS INDUSTRIES
| COMPANY | USE CASE DESCRIPTION | BENEFITS |
|---|---|---|
 |
Development of Corcom EMC/EMI filters for industrial automation systems, EV charging stations, medical devices, and communication equipment | Ensures compliance with EMC standards, provides high noise attenuation, improves power quality, enhances system reliability, and reduces design time through modular filter integration |
 |
Production of single-phase and three-phase EMC filters for industrial power supplies, motor drives, and renewable energy systems | Offers broad frequency noise suppression, low leakage current, compact design, and customizable options, leading to improved equipment efficiency and longer service life |
|
|
Manufacturing of EMI filters for variable frequency drives (VFDs), inverters, and automation control systems | Minimizes conducted and radiated noise, ensures IEC/EMC compliance, stabilizes equipment operation, enhances system reliability, and supports high-power applications |
 |
Integration of filter and protection modules for power and communication systems combining EMI suppression with surge and overvoltage protection | Provides dual protection (noise + surge), reduces component count, saves space, and improves overall equipment safety and performance stability |
 |
Development of EMC testing and validation systems for electronic devices, filters, and communication equipment | Enables accurate compliance testing, early EMI issue detection, faster certification cycles, improved product reliability, and reduced time-to-market |
Logos and trademarks shown above are the property of their respective owners. Their use here is for informational and illustrative purposes only.
MARKET ECOSYSTEM
The EMC filtration market growth ecosystem includes EMC filter manufacturers, power quality filter manufacturers, and end users or customers. EMC filter manufacturers create solutions to manage EMI in electronic devices, ensuring they meet international standards and improve device performance. Power quality filter manufacturers aim to enhance the reliability and efficiency of electrical systems by reducing disturbances like harmonics and providing output filters. End users, such as those in industries like industrial automation, building technologies, energy and utilities, EV charging, and medical fields, depend on these filters to maintain operational stability, comply with regulations, and ensure the continuous operation of sensitive electronic systems.
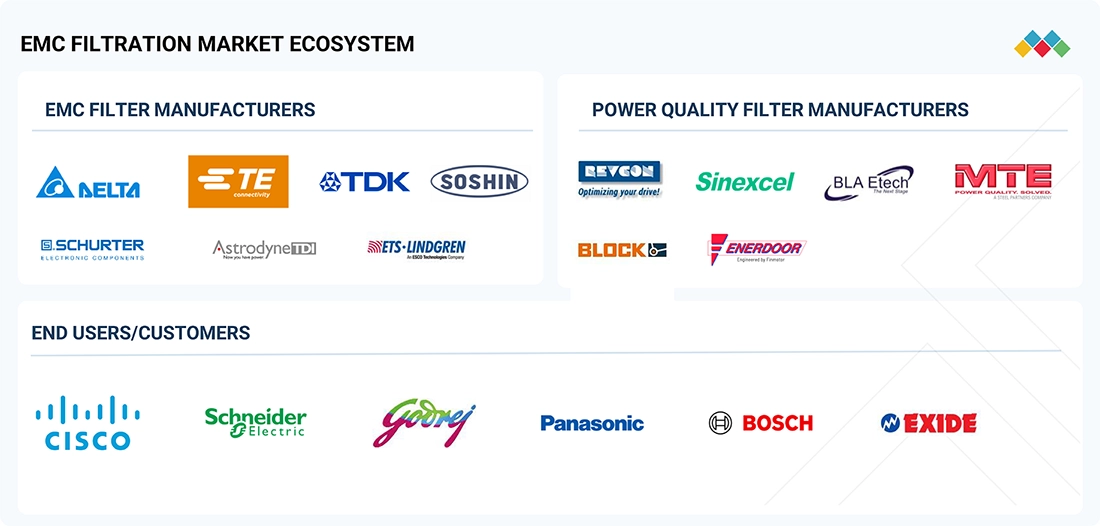
Logos and trademarks shown above are the property of their respective owners. Their use here is for informational and illustrative purposes only.
MARKET SEGMENTS
Source: Secondary Research, Interviews with Experts, MarketsandMarkets Analysis
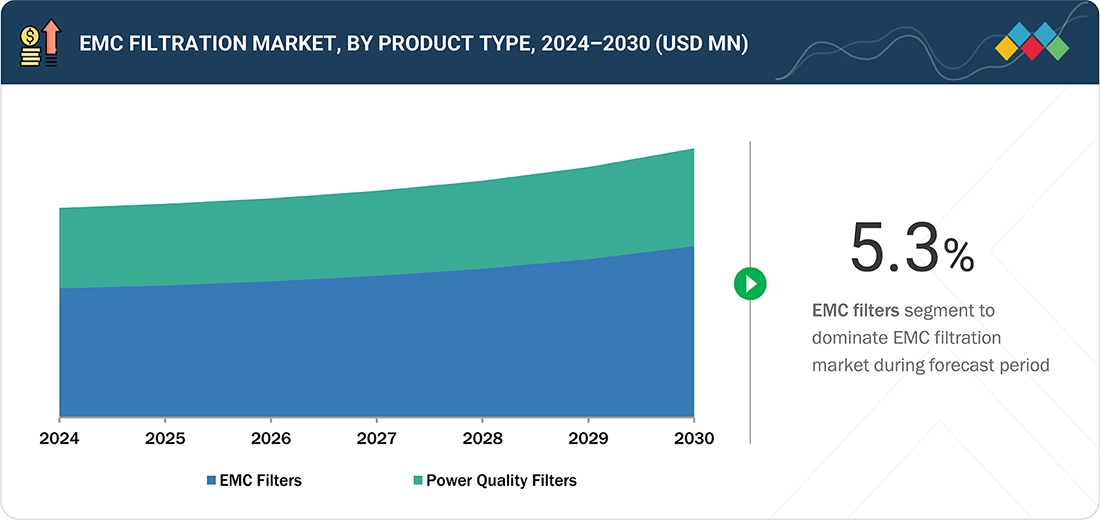
EMC Filtration Market, by Product Type
EMC filters are expected to register the highest CAGR during the forecast period owing to the escalating complexity of electronic systems and the increasing necessity to adhere to rigorous electromagnetic compatibility standards. The growing adoption of high-speed technologies such as 5G, electric vehicles, Internet of Things (IoT) devices, and industrial automation contributes to the heightened demand for effective electromagnetic interference (EMI) suppression. Furthermore, the shift towards miniaturized and high-performance devices underscores the need for advanced EMC filters, thereby further propelling their market expansion.
EMC Filtration Market, by Application
The industrial application segment is expected to experience the highest CAGR during the forecast period due to the rapid adoption of automation, robotics, and smart manufacturing technologies, which depend on high-speed electronic systems that are susceptible to electromagnetic interference (EMI). Industries increasingly need reliable EMC filtration to ensure continuous operation, meet strict regulatory standards, and extend equipment lifespan. Furthermore, the growth of Industry 4.0, IIoT, and connected industrial devices is boosting demand for advanced EMC solutions, driving significant growth in this segment.
REGION
Asia Pacific to be fastest-growing region in global EMC filtration market during forecast period
Asia Pacific is projected to achieve the highest CAGR in the EMC filtration market share because of its expanding electronics manufacturing industry and increasing demand for advanced technologies in consumer electronics, automotive, industrial, and telecom sectors. Rapid industrialization in China, Japan, South Korea, and India, along with investments in high-tech infrastructure, fuels the need for EMC compliance. The move toward electric vehicles and smart automotive systems, combined with stricter EMI regulations, further encourages the adoption of advanced EMC filters, making the region a key growth center.
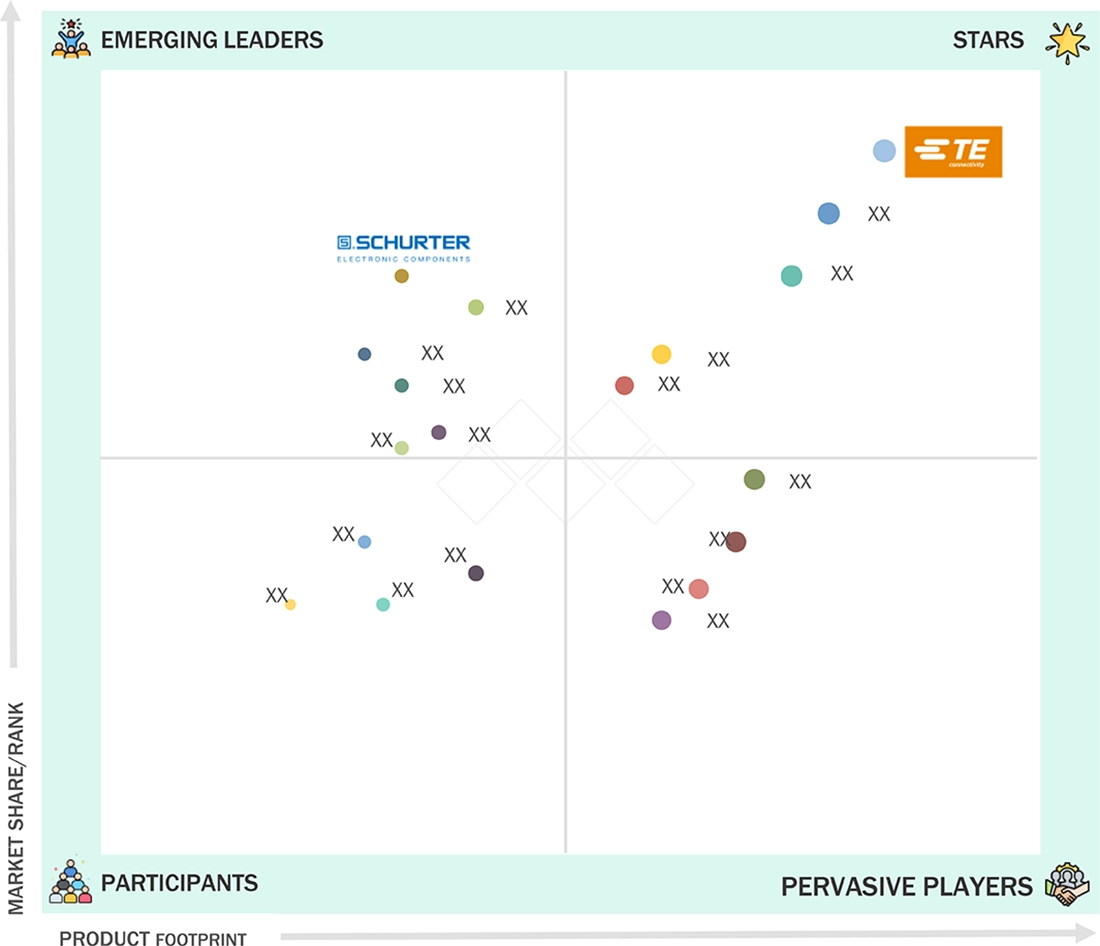
EMC Filtration Market: COMPANY EVALUATION MATRIX
In the EMC filtration companies, TE Connectivity (Star) maintains a strong market share and broad global reach, supported by its extensive filter range and innovative solutions used in automotive, industrial, aerospace, and telecommunications sectors. SCHURTER Group (Emerging Player) is increasing its visibility with advanced EMC filter solutions and a strategic focus on fast-growing sectors like electric vehicles, industrial automation, and 5G infrastructure. While TE Connectivity leads through scale, technical expertise, and diverse product offerings, SCHURTER Group shows significant potential to move into the leaders' quadrant as demand for compact, high-performance EMC solutions continues to rise.
Source: Secondary Research, Interviews with Experts, MarketsandMarkets Analysis
KEY MARKET PLAYERS
WHAT IS IN IT FOR YOU: EMC Filtration Market REPORT CONTENT GUIDE
DELIVERED CUSTOMIZATIONS
We have successfully delivered the following deep-dive customizations:
| CLIENT REQUEST | CUSTOMIZATION DELIVERED | VALUE ADDS |
|---|---|---|
| Large Electronics Manufacturer |
|
|
| Automotive OEM |
|
|
| Industrial Equipment Manufacturer |
|
|
| Aerospace/Defense Contractor |
|
|
| Medical Device Producer |
|
|
RECENT DEVELOPMENTS
- November 2024 : AstrodyneTDI introduced the RP395 EMI filter, a high-performance 3-phase delta 1000 VAC power line filter for high-voltage AC systems. The RP395 EMI filter features flexible connection options and works efficiently across various frequencies, making it ideal for power conversion applications.
- September 2024 : TDK Corporation introduced the EPCOS B32377G series, a new lineup of three-phase AC filter capacitors designed to enhance power quality in applications like wind, solar power, and industrial drives. Filled with nonflammable nitrogen gas, these capacitors help filter harmonic distortions and reduce reactive power at inverter inputs and outputs.
- September 2024 : SCHURTER Group introduced the DKCV-1 series of new vertically mounting current-compensated chokes for PCBs, a range covering currents of 0.5 to 10 A. With nanocrystalline cores that provide high inductance in a compact size, these chokes effectively reduce EMI in space-constrained applications, such as switching power supplies, industrial, medical, and laboratory equipment.
- June 2024 : Schaffner Holding AG introduced the AG RT series N choke, including models RT8121, RT8131, RT8521, and RT8531. This extension offers up to 15 dB greater attenuation performance than its ferrite-based predecessor across key frequency ranges in the electromagnetic compatibility (EMC) spectrum.
- December 2023 : TE Connectivity acquired Schaffner Holding AG, a global provider of EMC and power quality solutions that develop components to ensure the efficient and reliable operation of electrical and electronic systems. TE Connectivity purchased Schaffner Holding AG to expand its EMC filter portfolio and increase its geographic reach. TE Connectivity owns 627,658 shares of Schaffner Holding AG.
Table of Contents
 Exclusive indicates content/data unique to MarketsandMarkets and not available with any competitors.
Methodology
The research process for this technical, market-oriented, and commercial study of the EMC filtration market included systematically gathering, recording, and analyzing data about companies operating in the market. It used secondary sources, directories, and databases (Factiva, Oanda, and OneSource) to identify and collect relevant information. In-depth interviews were conducted with various primary respondents, including experts from core and related industries and preferred manufacturers, to obtain and verify critical qualitative and quantitative information and assess the market's growth prospects. Key players in the EMC filtration market were identified through secondary research, and their market rankings were determined through primary and secondary research. This included studying annual reports of top players and interviewing key industry experts, such as CEOs, directors, and marketing executives.
Secondary Research
In the secondary research process, various secondary sources were used to identify and collect information for this study. These include annual reports, press releases, and investor presentations of companies, white papers, certified publications, and articles from recognized associations and government publishing sources. Research reports from a few consortia and councils were also consulted to structure qualitative content. Secondary sources included corporate filings (such as annual reports, investor presentations, and financial statements); trade, business, and professional associations; white papers; Journals and certified publications; articles by recognized authors; gold-and silver-standard websites; directories; and databases. Data was collected from secondary sources, such as the International Trade Centre (ITC) and the International Monetary Fund (IMF).
List of key secondary sources
|
Source |
Web Link |
|
International Electrotechnical Commission (IEC) |
|
|
European Committee for Electrotechnical Standardization (CEN-CENELEC) |
|
|
IEEE Electromagnetic Compatibility Society |
|
|
Center for Chemical Process Safety (CCPS) |
https://www.aiche.org/ccps/resources/glossary/process-safety-glossary/electromagnetic-interference |
|
Semiconductor Industry Association (SIA) |
Primary Research
Extensive primary research was conducted after understanding and analyzing the EMC filtration market scenario through secondary research. Multiple primary interviews were conducted with key opinion leaders from both demand- and supply-side vendors across four major regions—North America, Europe, Asia Pacific, and Rest of the World (RoW). Approximately 30% of the primary interviews were conducted with the demand side, and 70% with the supply side. Primary data was collected through questionnaires, emails, and telephonic interviews. Various departments within organizations, such as sales, operations, and administration, were contacted to provide a holistic viewpoint in the report.

Note: Other designations include technology heads, media analysts, sales managers, marketing managers, and product managers.
The three tiers of the companies are based on their total revenues as of 2024 - Tier 1: >USD 1 billion, Tier 2: USD 500 million–1 billion, and Tier 3: USD 500 million.
To know about the assumptions considered for the study, download the pdf brochure
Market Size Estimation
In the complete market engineering process, top-down and bottom-up approaches and multiple data triangulation methods have been used to estimate the market size and forecast the overall market segments and subsegments listed in this report. Extensive qualitative and quantitative analyses have been performed on the complete market engineering process to list the key information/insights throughout the report. The following table explains the process flow of the market size estimation.
The key players in the market were identified through secondary research, and their rankings in the respective regions were determined through primary and secondary research. This entire procedure involved the study of the annual and financial reports of top players, as well as interviews with industry experts such as chief executive officers, vice presidents, directors, and marketing executives, for quantitative and qualitative key insights. All percentage shares, splits, and breakdowns were determined using secondary sources and verified through primary sources. All parameters that affect the markets covered in this research study were accounted for, viewed in extensive detail, verified through primary research, and analyzed to obtain the final quantitative and qualitative data. This data was consolidated, supplemented with detailed input and analysis from MarketsandMarkets, and presented in this report.
Bottom-Up Approach
- Analyzed major manufacturers of EMC and power quality filters, studied their portfolios, and understood products based on their features and functions
- Analyzed the segmental revenue and scope revenue of the companies profiled in the study
- Arrived at the global EMC filtration market size by adding the scope revenue of key manufacturers in the market
- Conducted multiple discussions with key opinion leaders to understand different EMC filtration product types, applications, and current trends in the market, and analyzed the breakup of the scope of study by major manufacturing companies
Top-Down Approach
- The global size of the EMC filtration market was estimated through the data sanity of major companies offering EMC and power quality filters.
- The geographic penetration splits were estimated using secondary sources, based on several factors, such as the number of players in a specific region (North America, Europe, Asia Pacific, and RoW)
- The country-level penetration split was analyzed for each region to estimate the market size.
- The market size for the global product type (EMC filters and power quality filters) was determined by understanding the penetration split of each product type in each region.
- The market size for the global application segments was estimated by analyzing the penetration split of each product type for each application
EMC Filtration Market : Top-Down and Bottom-Up Approach

Data Triangulation
After arriving at the overall size of the EMC filtration market through the process explained above, the overall market has been split into several segments. Data triangulation procedures have been employed to complete the overall market engineering process and arrive at the exact statistics for all the segments, wherever applicable. The data has been triangulated by studying various factors and trends from both the demand and supply sides. The market has also been validated using both top-down and bottom-up approaches.
Market Definition
EMC filtration, or electromagnetic compatibility filtration, minimizes electromagnetic interference from different electronic devices. EMC filters eliminate and minimize high-frequency electromagnetic noise produced in electronic devices, including motor drives, robotics, HVAC, elevators, lighting, machinery & equipment, smart infrastructure, energy & utilities, EV charging, medical equipment, laboratory & analyzer equipment, and data centers. EMC filtration ensures that the electronic equipment runs without any interference, which is vital since nearly all electronic devices produce electromagnetic noise, leading to malfunction..
Key Stakeholders
- Associations and Regulatory Authorities
- Government Bodies, Venture Capitalists, and Private Equity Firms
- Original Equipment Manufacturers (OEMs)
- Electronic Device Manufacturers
- EMC and Power Quality Filter Distributors and Sales Firms
- Research Institutes and Organizations
Report Objectives
- To define, describe, and forecast the size of the EMC filtration market, by product type, application, and region, in terms of value
- To describe and forecast the size of the EMC filtration market, by EMC filter type, in terms of volume
- To provide macroeconomic outlooks concerning main regions, namely, North America, Europe, Asia Pacific, and Rest of the World (RoW)
- To provide detailed information regarding the drivers, restraints, opportunities, and challenges influencing the market’s growth
- To provide a detailed overview of the EMC filtration market value chain, industry trends, technology trends, use cases, regulatory landscape, and Porter’s five forces
- To strategically analyze micromarkets1 with respect to individual growth trends, prospects, and contributions to the total market
- To provide ecosystem analysis, trends/disruptions impacting customer business, technology analysis, pricing analysis, key stakeholders and buying criteria, case study analysis, trade analysis, patent analysis, key conferences and events, Gen AI/AI impact, US tariff impact, and regulations related to the EMC filtration market
- To analyze the opportunities in the market for stakeholders by identifying high-growth segments and detailing the competitive landscape for market players
- To strategically profile key players and comprehensively analyze their market rankings, core competencies2, company valuation, and financial metrics, and product/brand comparison, along with detailing the competitive landscape for the market leaders
- To analyze the competitive developments, such as product launches and acquisitions, carried out by market players
- To map competitive intelligence based on company profiles, key player strategies, and game-changing developments, such as product developments, collaborations, and acquisitions
- To benchmark players within the market using the proprietary competitive leadership mapping framework, which analyzes market players on various parameters within the broad categories of business strategy excellence and strength of product portfolio
Available Customizations
With the market data given, MarketsandMarkets offers customizations according to the company’s specific needs. The following customization options are available for the report:
Company Information
- Detailed analysis and profiling of additional market players (up to 7)
Key Questions Addressed by the Report
What is the current size of the EMC Filtration market?
The global EMC Filtration market is valued at USD 1.26 billion in 2025 and is projected to reach USD 1.59 billion by 2030. (MarketsandMarkets)
What is the expected CAGR of the EMC Filtration market?
The market is expected to grow at a CAGR of 4.7% during 2025–2030. (MarketsandMarkets)
What is driving the growth of the EMC Filtration market?
Key growth drivers include industrial automation, electric vehicles (EVs), 5G deployment, renewable energy, and stringent EMI/EMC regulations. (MarketsandMarkets)
Which product segment dominates the EMC Filtration market?
EMC Filters hold the largest market share due to rising demand for EMI suppression in advanced electronic systems. (MarketsandMarkets)
Which application leads the EMC Filtration market?
Industrial automation is the leading application segment, supported by Industry 4.0 and IIoT adoption. (MarketsandMarkets)
Which region dominates the EMC Filtration market?
Asia Pacific accounted for 42.9% of the global market in 2024 and is expected to remain the fastest-growing region through 2030. (MarketsandMarkets)
Who are the leading companies in the EMC Filtration market?
Major players include TDK Corporation, TE Connectivity, Delta Electronics, Littelfuse, and Rohde & Schwarz. (MarketsandMarkets)
What are the latest trends in the EMC Filtration market?
Key trends include miniaturized filters, high-frequency EMC solutions, smart factory adoption, EV electrification, and advanced filter technologies. (MarketsandMarkets)
Which industries generate the highest demand for EMC filtration?
Major end-use industries include industrial automation, automotive, energy & utilities, medical devices, telecommunications, data centers, and aerospace & defense. (MarketsandMarkets)
What does the MarketsandMarkets EMC Filtration report include?
The report provides 241 pages, 225 tables, market sizing, forecasts to 2030, competitive analysis, segmentation by product, application, and region, along with strategic company profiles. (MarketsandMarkets)
Need a Tailored Report?
Customize this report to your needs
Get 10% FREE Customization
Customize This ReportPersonalize This Research
- Triangulate with your Own Data
- Get Data as per your Format and Definition
- Gain a Deeper Dive on a Specific Application, Geography, Customer or Competitor
- Any level of Personalization
Let Us Help You
- What are the Known and Unknown Adjacencies Impacting the EMC Filtration Market
- What will your New Revenue Sources be?
- Who will be your Top Customer; what will make them switch?
- Defend your Market Share or Win Competitors
- Get a Scorecard for Target Partners

Custom Market Research Services
We Will Customise The Research For You, In Case The Report Listed Above Does Not Meet With Your Requirements
Get 10% Free CustomisationTESTIMONIALS

Tetsuya Ohhira
Business Development Manager-Technology Business
Nikon Corporation,
Leading Japanese MNC specializing in optics and imaging productswww.nikon.com
MarketsandMarkets™ response
is quick. Their attitude is flexible and positive. Analyst Insights are globally considered and
significant. Client Services quickly respond to our inquiry and demand. Their wide range of global
surveys help us make our strategic plan.
We hope Knowledge Store will be easier to search
for a report.
VP - Marketing & Business Development
Leading Provider of Process Control Solutions
We engaged with MarketsandMarkets on a study to perform an analysis and recommend a Go-To-Market strategy for metrology and process control in the semiconductor market. The study was tailored to our targets and needs with well-defined milestones. Our overall experience with the MarketsandMarkets team was very good throughout the project in all aspects including the analysis methodologies used, the quality and depth of primary and secondary data sets, the professionalism and flexibility of the team and the ability to meet the target schedule and milestones. We want to thank MarketsandMarkets team for a job well done.


Growth opportunities and latent adjacency in EMC Filtration Market