Heat Exchanger Market

Heat Exchanger Market by Type (Shell & Tube, Plate & Frame, Air Cooled), Material (Metal, Alloys, Brazing Clad Materials), End-Use Industry (Chemical, Energy, Hvacr, Food & Beverage, Power, Pulp & Paper), And Region - Global Forecast to 2029

Report Code: CH 3063 May, 2024, by marketsandmarkets.com

The global heat exchanger market size is projected to reach USD 32.3 billion by 2029 from USD 23.0 billion in 2024, at a CAGR of 7.0% during the forecast period. The heat exchanger market is projected to grow significantly in the coming years. Heat exchangers enable the efficient transfer of heat between fluids, facilitating the effective utilization of energy. Whether it's recovering waste heat from industrial operations or transferring heat between various fluid streams, heat exchangers play a crucial role in enhancing energy efficiency and minimizing energy consumption.

Global Heat Exchanger Market Trend
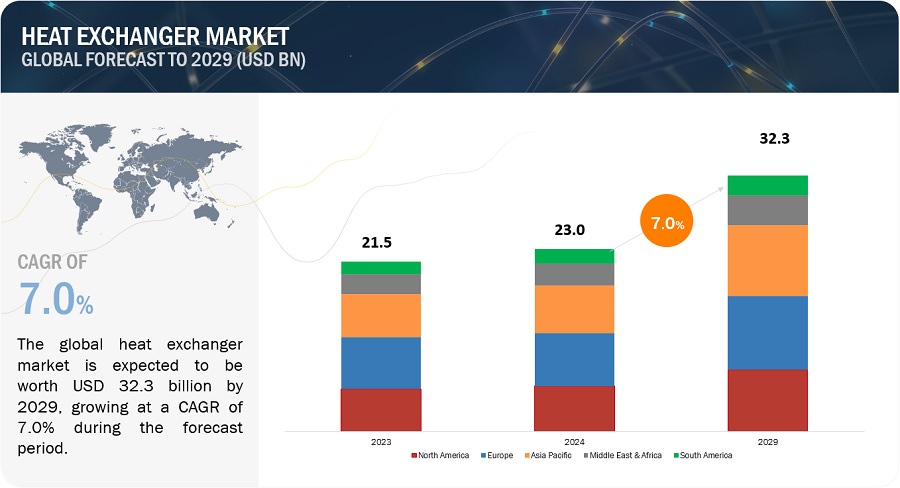
Heat Exchanger Market

To know about the assumptions considered for the study, Request for Free Sample Report
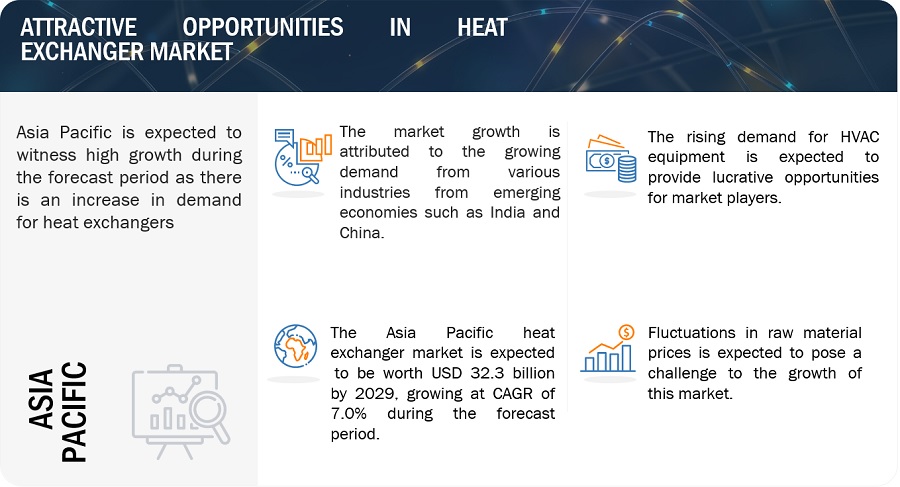
Heat Exchanger Market

Heat exchangerMarket Dynamics

Driver: Growing demand for heat pumps in Europe

Heat pumps rely on heat exchangers as a vital element to transfer heat among various mediums, including air, water, or the ground. The increasing uptake of heat pumps in Europe results in a heightened need for heat exchangers to facilitate effective heat transfer within these systems. These pumps are commonly integrated into heating systems across residential, commercial, and industrial buildings to offer space heating, hot water, and cooling functionalities. Heat exchangers serve as indispensable components within heat pump setups, enabling the exchange of heat between the refrigerant and the surrounding environment. Additionally, the European Union's efforts to promote building renovation and enhance energy efficiency contribute to the rising adoption of heat pumps. As older buildings undergo retrofitting with heat pump systems to lower carbon emissions and energy usage, the demand for heat exchangers correspondingly increases.

Restraint: Fluctuations in raw material prices

Heat exchanger manufacturers face risks associated with fluctuations in raw material prices, including copper, aluminum, steel, and other metals. These price fluctuations are influenced by various factors such as economic conditions, exchange rates, supply conditions, mining policies, and raw material processing. Volatility in metal prices can pose challenges for manufacturers, potentially impacting their profitability and operational efficiency. Unpredictable pricing trends may lead to increased costs for customers, potentially causing delays or cancellations of large capital projects. This, in turn, can affect manufacturers' profitability and financial stability. Conversely, oversupply in the market may compel manufacturers to reduce expenditure, impacting their competitiveness and market position. A decrease in demand can result in delays or cancellations of existing orders, leading to excess manufacturing capacity and unfavorable effects on fixed manufacturing costs. This situation may also influence average selling prices in the market.

Opportunity: Rising aftermarket

A heat exchanger holds a pivotal role in any process industry, with its performance and durability directly impacting both capital and operating expenses. Breakdowns and maintenance activities often incur significant costs. Therefore, regular maintenance of heat exchangers is paramount, with maintenance costs typically being lower compared to rotating equipment such as pumps, fans, and compressors. Ensuring the ongoing maintenance of heat exchangers is essential for uninterrupted operation, system uptime, and the prevention of sudden failures. Investing in preventive maintenance is usually more cost-effective than emergency repairs. Well-planned maintenance of heat exchangers enables companies to save energy and reduce operational costs by up to 30%. Maintenance activities help prevent pressure drops in the system, resulting in reduced loads on pumps and other components. This contributes to lower energy consumption, while simultaneously enhancing heat transfer rates and operational efficiency.

Challenges: Regulations concerning fluorinated gases

Regulations concerning fluorinated gases (F-gases) pose challenges for participants in the heat exchangers market, particularly in their use as evaporators and condensers. In 2015, the European Union (EU) proposed significant amendments to F-gas regulations aimed at controlling emissions of fluorinated greenhouse gases (F-gases), notably hydrofluorocarbons (HFCs). These amendments led to the adoption of two legislative acts by the EU: the MAC Directive, focusing on air conditioning systems in small motor vehicles, and the F-gas Regulation, covering various other key applications employing F-gases. While certain applications have banned the use of HFCs, allowances for HFC refrigerants are contingent upon meeting Eco-Design criteria. Similar regulatory discussions are underway in the US (SNAP - Significant New Alternative Policy) and China.

Market Ecosystem
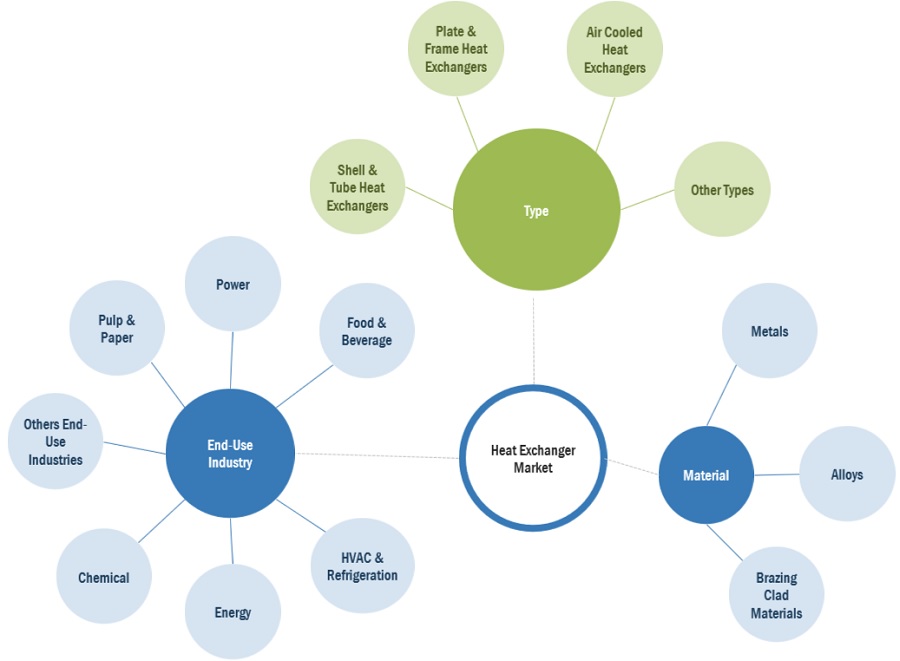
Heat Exchanger Market Ecosystem

By material, metals is the second fastest growing in heat exchanger market, in 2023.

Metals, such as copper, aluminum, and stainless steel, possess excellent thermal conductivity properties, allowing them to efficiently transfer heat between fluids. This property makes metals highly suitable for heat exchanger applications where rapid heat transfer is essential. They offer superior mechanical strength and durability, enabling them to withstand high temperatures, pressures, and mechanical stresses encountered in heat exchanger operations. This durability ensures the reliability and longevity of heat exchanger systems. They offer a cost-effective solution for heat exchanger construction, particularly when compared to alternative materials such as ceramics or composites.

By type, shell & tube is the largest in heat exchanger market, in 2023.

Shell & tube heat exchangers are well-known for their effective heat transfer capabilities. Their design facilitates a generous surface area for heat exchange between the fluid flowing through the tubes and the fluid surrounding the tubes within the shell. This layout optimizes heat transfer efficiency, rendering shell & tube heat exchangers appropriate for a diverse array of applications. Constructed with sturdy materials like metals (e.g., stainless steel, carbon steel, copper alloys), shell and tube heat exchangers boast high mechanical strength and resistance to corrosion. This robust construction guarantees enduring reliability and performance, even when subjected to challenging operating conditions.

By end-use industry, energy segment is the second fastest growing end-use industry in the heat exchanger market, in 2023.

Heat exchangers are essential components in various energy end-use applications, including power generation, HVAC systems, district heating and cooling, and renewable energy systems such as solar thermal and geothermal. These applications require efficient heat transfer to control temperatures, generate electricity, provide heating and cooling, and facilitate energy conversion processes. They are essential components in renewable energy systems such as solar thermal collectors, geothermal heat pumps, and biomass boilers. These systems harness renewable energy sources to generate heat for space heating, hot water production, and industrial processes, with heat exchangers facilitating the transfer of thermal energy between the renewable energy source and the end-use application.

Asia Pacific accounted for the largest market share in the heat exchanger market, in terms of value.

The heat exchanger sector in the Asia-Pacific region is undergoing significant growth and development. This expansion is fueled by various factors, including the region's booming industrial domains, heightened emphasis on environmental sustainability, and increasing need for clean energy alternatives. Heat exchangers are crucial components in power plants, where they facilitate heat transfer processes in boilers, condensers, steam turbines, and cooling systems. Furthermore, governmental efforts targeting greenhouse gas reduction are driving the uptake of heat exchangers, positioning the Asia-Pacific market as a hub for the advancement and implementation of these innovative technologies.
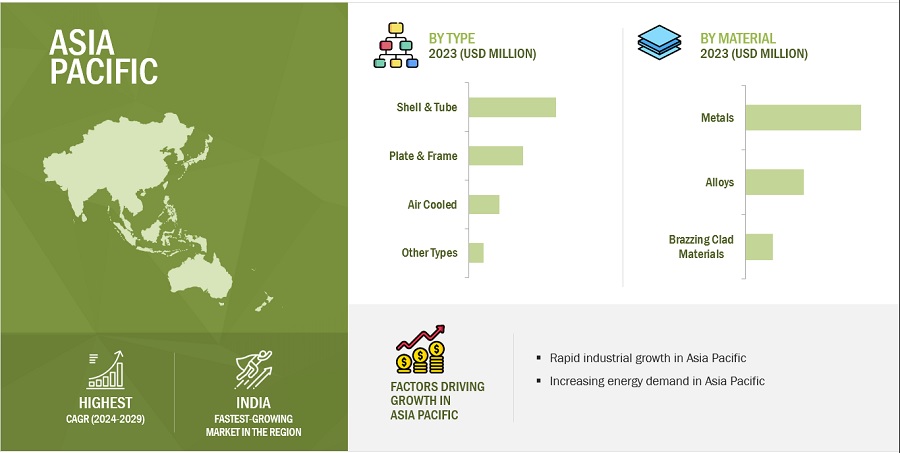
Heat Exchanger Market by Region

To know about the assumptions considered for the study, download the pdf brochure

Key Market Players

Some of the key players operating in the heat exchanger market include ALFA LAVAL (Sweden), Kelvion Holding GmbH (Germany), Danfoss (Denmark), Exchanger Industries Limited (Canada), Mersen (France), API Heat Transfer (US), Boyd (US), H. Güntner (UK) Limited (Germany), Johnson Controls (Ireland), Xylem (US), Wabtec Corporation (US), SPX FLOW (US), LU-VE S.p.A. (Italy), Lennox International Inc. (US), and Modine Manufacturing Company (US) among others.

Get online access to the report on the World's First Market Intelligence Cloud

  • Easy to Download Historical Data & Forecast Numbers
  • Company Analysis Dashboard for high growth potential opportunities
  • Research Analyst Access for customization & queries
  • Competitor Analysis with Interactive dashboard
  • Latest News, Updates & Trend analysis
Request Sample

Scope of the Report

Report Metric

Details

Years considered for the study

2020-2029

Base Year

2023

Forecast period

2024–2029

Units considered

Units; Value (USD Million)

Segments

Material, Type, End-Use Industry, and Region

Regions

Asia Pacific, North America, Europe, Middle East & Africa, and South America

Companies

ALFA LAVAL (Sweden), Kelvion Holding GmbH (Germany), Danfoss (Denmark), Exchanger Industries Limited (Canada), Mersen (France), API Heat Transfer (US), Boyd (US), H. Güntner (UK) Limited (Germany), Johnson Controls (Ireland), Xylem (US), Wabtec Corporation (US), SPX FLOW (US), LU-VE S.p.A. (Italy), Lennox International Inc. (US), and Modine Manufacturing Company (US).

This report categorizes the global heat exchangers market based on material, type, end-use industry, and region.

Based on the material:
  • Metals
    • Steel
      • Carbon Steel
      • Stainless Steel
    • Copper
    • Aluminum
    • Titanium
    • Nickel
    • Other Metals
  • Alloys
    • Nickel Alloys
      • Hastelloy
      • Inconel
      • Monel
      • Other Nickel Alloys
    • Copper Alloys
    • Titanium Alloys
    • Other Alloys
  • Brazing Clad Materials
    • Copper Brazing
    • Ni Clad Brazing
    • Phosphor Copper Brazing
    • Silver Brazing
    • Other Brazing Clad Materials
Based on the type:
  • Shell & Tube
  • Plate & Frame
  • Air Cooled
  • Other Types
Based on the end-use industry:
  • Chemical
  • Energy
  • HVACR
  • Food & Beverage
  • Power Generation
  • Pulp & Paper
  • Other End-Use Industries
Based on the region:
  • Asia Pacific
  • Europe
  • North America
  • South America
  • Middle East & Africa

These companies have adopted various organic as well as inorganic growth strategies between 2019 and 2023 to strengthen their positions in the market. The new product launch is the key growth strategy adopted by these leading players to enhance regional presence and develop product portfolios to meet the growing demand for heat exchangerfrom emerging economies.

Recent Developments

  • In December 2023, ALFA LAVAL partnered with Outokumpu, a global steel manufacturer, to reduce carbon emissions by utilizing Outokumpu's Circle Green stainless steel in the production of Alfa Laval's heat exchangers. This partnership targets a decrease in the carbon footprint associated with Alfa Laval's heat exchangers, which typically consist of up to 80 percent stainless steel, by transitioning from conventional stainless steel to a material with a significantly reduced carbon footprint, amounting to half of its original level.
  • In November 2023, Danfoss Heat Exchangers signed an agreement with Danfoss Commercial Compressors to establish an in-house test capability for propane located in the ATEX-certified lab in Trevoux in France. The new propane test facility focuses on testing brazed plate heat exchangers ranging from 10 to 150kW capacity.
  • In September 2023, Kelvion Holding GmbH has invested USD 4.3 million to expand its production capacities in Sarstedt to meet the increasing demand for its heat exchangers across diverse end-use sectors. This expansion enables the facility to manufacture an extra 150,000 heat exchangers annually, aligning with the company's strategic goal of expanding its presence in the U.S. market and establishing itself as the preferred partner in the Refrigeration and Data Center Industries.

Frequently Asked Questions (FAQ):

To speak to our analyst for a discussion on the above findings, click Speak to Analyst

TABLE OF CONTENTS
 
1 INTRODUCTION (Page No. - 42)
    1.1 STUDY OBJECTIVES 
    1.2 MARKET DEFINITION 
           1.2.1 INCLUSIONS & EXCLUSIONS
    1.3 STUDY SCOPE 
           1.3.1 MARKETS COVERED
           1.3.2 REGIONS COVERED
           1.3.3 YEARS CONSIDERED
    1.4 CURRENCY CONSIDERED 
    1.5 UNITS CONSIDERED 
    1.6 STAKEHOLDERS 
    1.7 SUMMARY OF CHANGES 
    1.8 RECESSION IMPACT 
 
2 RESEARCH METHODOLOGY (Page No. - 46)
    2.1 RESEARCH DATA 
          FIGURE 1 HEAT EXCHANGER MARKET: RESEARCH DESIGN
           2.1.1 SECONDARY DATA
                    2.1.1.1 Key data from secondary sources
           2.1.2 PRIMARY DATA
                    2.1.2.1 Key data from primary sources
                    2.1.2.2 List of primary interview participants – demand and supply side
                    2.1.2.3 Key industry insights
                    2.1.2.4 Breakdown of interviews with experts
    2.2 MARKET SIZE ESTIMATION 
           2.2.1 BOTTOM-UP APPROACH
                    FIGURE 2 HEAT EXCHANGER MARKET: BOTTOM-UP APPROACH
           2.2.2 TOP-DOWN APPROACH
                    FIGURE 3 HEAT EXCHANGER MARKET: TOP-DOWN APPROACH
                    FIGURE 4 MARKET SIZE ESTIMATION: HEAT EXCHANGER MARKET TOP-DOWN APPROACH
    2.3 GROWTH RATE ASSUMPTION 
          FIGURE 5 DEMAND-SIDE FORECAST PROJECTIONS
    2.4 DATA TRIANGULATION 
          FIGURE 6 HEAT EXCHANGER MARKET: DATA TRIANGULATION
    2.5 FACTOR ANALYSIS 
    2.6 RESEARCH ASSUMPTIONS 
    2.7 RESEARCH LIMITATIONS 
    2.8 RISK ASSESSMENT 
    2.9 RECESSION IMPACT 
 
3 EXECUTIVE SUMMARY (Page No. - 56)
    FIGURE 7 SHELL & TUBE SEGMENT TO ACCOUNT FOR LARGEST SHARE OF OVERALL HEAT EXCHANGER MARKET
    FIGURE 8 METALS TO BE LARGEST MATERIAL SEGMENT IN HEAT EXCHANGER MARKET
    FIGURE 9 ENERGY TO BE FASTEST-GROWING END-USE INDUSTRY OF HEAT EXCHANGERS DURING FORECAST PERIOD
    FIGURE 10 ASIA PACIFIC TO BE FASTEST-GROWING MARKET DURING FORECAST PERIOD
 
4 PREMIUM INSIGHTS (Page No. - 59)
    4.1 ATTRACTIVE OPPORTUNITIES FOR PLAYERS IN HEAT EXCHANGER MARKET 
          FIGURE 11 ASIA PACIFIC TO WITNESS HIGH GROWTH DURING FORECAST PERIOD
    4.2 HEAT EXCHANGER MARKET, BY TYPE 
          FIGURE 12 PLATE & FRAME TYPE TO LEAD HEAT EXCHANGER MARKET DURING FORECAST PERIOD
    4.3 HEAT EXCHANGER MARKET, BY END-USE INDUSTRY 
          FIGURE 13 HVAC & REFRIGERATION TO BE LARGEST END-USE INDUSTRY DURING FORECAST PERIOD
    4.4 HEAT EXCHANGER MARKET, BY COUNTRY 
          FIGURE 14 INDIA TO GROW AT HIGHEST CAGR DURING FORECAST PERIOD
 
5 MARKET OVERVIEW (Page No. - 61)
    5.1 INTRODUCTION 
    5.2 MARKET DYNAMICS 
          FIGURE 15 MARKET DYNAMICS OF HEAT EXCHANGER MARKET
           5.2.1 DRIVERS
                    5.2.1.1 Increasing industrialization in emerging economies
                    5.2.1.2 Rising energy efficiency regulations and stringent emission standards
                    5.2.1.3 Growing demand for HVAC & refrigeration equipment
                    5.2.1.4 Growing demand for heat pumps
                    5.2.1.5 Rising demand for sustainable, low energy consumption, and cost-effective heat exchangers
           5.2.2 RESTRAINTS
                    5.2.2.1 Fluctuation in raw material prices
                    5.2.2.2 Lack of awareness of energy efficiency
                    5.2.2.3 Growing demand for battery electric vehicles
                    5.2.2.4 Sluggish growth rates
           5.2.3 OPPORTUNITIES
                    5.2.3.1 Growing number of nuclear power plants
                    5.2.3.2 Growing aftermarket of heat exchangers
           5.2.4 CHALLENGES
                    5.2.4.1 Regulations concerning fluorinated greenhouse gases
                    5.2.4.2 Capital-intensive market
    5.3 PORTER’S FIVE FORCES ANALYSIS 
          FIGURE 16 PORTER’S FIVE FORCES ANALYSIS OF HEAT EXCHANGER MARKET
           5.3.1 THREAT OF SUBSTITUTES
           5.3.2 BARGAINING POWER OF SUPPLIERS
           5.3.3 THREAT OF NEW ENTRANTS
           5.3.4 BARGAINING POWER OF BUYERS
           5.3.5 INTENSITY OF COMPETITIVE RIVALRY
                    TABLE 1 HEAT EXCHANGER MARKET: PORTER’S FIVE FORCES ANALYSIS
    5.4 MACROECONOMIC INDICATORS 
           5.4.1 GLOBAL GDP TRENDS
                    TABLE 2 TRENDS OF PER CAPITA GDP, 2020–2023 (USD)
                    TABLE 3 GDP GROWTH ESTIMATE AND PROJECTION OF KEY COUNTRIES, 2024–2027
           5.4.2 OIL & GAS STATISTICS
                    TABLE 4 OIL PRODUCTION, BY COUNTRY, 2021–2022, THOUSAND BARRELS DAILY
           5.4.3 POWER GENERATION STATISTICS
                    TABLE 5 POWER GENERATED IN KEY COUNTRIES, 2018 –2021, TERAWATT HOUR (TWH)
 
6 INDUSTRY TRENDS (Page No. - 74)
    6.1 INTRODUCTION 
    6.2 VALUE CHAIN ANALYSIS 
          FIGURE 17 HEAT EXCHANGER MARKET: VALUE CHAIN ANALYSIS
           6.2.1 RAW MATERIAL SOURCING
           6.2.2 MANUFACTURING
           6.2.3 DISTRIBUTION
           6.2.4 END USERS
                    TABLE 6 HEAT EXCHANGER MARKET: VALUE CHAIN STAKEHOLDERS
    6.3 REGULATORY LANDSCAPE 
           6.3.1 REGULATIONS
                    6.3.1.1 North America
                    6.3.1.2 Europe
                    6.3.1.3 Asia Pacific
           6.3.2 STANDARDS
                    6.3.2.1 ISO 27.060.30
                    6.3.2.2 BS EN 308:2022
                    6.3.2.3 ASME Boiler and Pressure Vessel Code (BPVC)
                    6.3.2.4 TEMA (Tubular Exchanger Manufacturers Association) Standards
                    6.3.2.5 API (American Petroleum Institute) Standards
                    6.3.2.6 PD500 Standards
                    6.3.2.7 EN 13445 Standards
           6.3.3 REGULATORY BODIES, GOVERNMENT AGENCIES, AND OTHER ORGANIZATIONS
                    TABLE 7 NORTH AMERICA: REGULATORY BODIES, GOVERNMENT AGENCIES, AND OTHER ORGANIZATIONS
                    TABLE 8 ASIA PACIFIC: REGULATORY BODIES, GOVERNMENT AGENCIES, AND OTHER ORGANIZATIONS
                    TABLE 9 EUROPE: REGULATORY BODIES, GOVERNMENT AGENCIES, AND OTHER ORGANIZATIONS
    6.4 TRADE ANALYSIS 
           6.4.1 HS CODE
           6.4.2 IMPORT SCENARIO
                    FIGURE 18 HEAT EXCHANGERS, KEY COUNTRY, 2019–2023 (USD MILLION)
           6.4.3 EXPORT SCENARIO
                    FIGURE 19 HEAT EXCHANGERS, KEY COUNTRY, 2019–2023 (USD MILLION)
    6.5 PRICING ANALYSIS 
           6.5.1 AVERAGE SELLING PRICE TREND, BY REGION
                    FIGURE 20 AVERAGE SELLING PRICE, BY REGION (USD/UNIT)
           6.5.2 AVERAGE SELLING PRICE, BY TYPE
                    FIGURE 21 AVERAGE SELLING PRICE, BY TYPE (USD/UNIT)
           6.5.3 AVERAGE SELLING PRICE TREND OF KEY PLAYERS, BY END-USE INDUSTRY
                    FIGURE 22 AVERAGE SELLING PRICE, BY KEY MARKET PLAYERS (USD/UNIT)
    6.6 INVESTMENT AND FUNDING SCENARIO 
          FIGURE 23 INVESTMENT AND FUNDING SCENARIO, 2019–2023 (USD MILLION)
    6.7 ECOSYSTEM/MARKET MAP 
          FIGURE 24 HEAT EXCHANGER MARKET: ECOSYSTEM
    6.8 TRENDS/DISRUPTIONS IMPACTING CUSTOMER’S BUSINESS 
          FIGURE 25 TRENDS IN HEAT EXCHANGER MARKET
    6.9 TECHNOLOGY ANALYSIS 
           6.9.1 KEY TECHNOLOGY
                    6.9.1.1 Microchannel heat exchangers
                    6.9.1.2 Multi-functional heat exchangers
                    6.9.1.3 Nanotechnology-enhanced heat exchangers
           6.9.2 COMPLEMENTARY TECHNOLOGY
                    6.9.2.1 3D-printed heat exchangers
                    6.9.2.2 Compact and microgroove heat exchangers
    6.10 CASE STUDY ANALYSIS 
           6.10.1 API HEAT TRANSFER
           6.10.2 BOYD
           6.10.3 API HEAT TRANSFER
    6.11 KEY CONFERENCES & EVENTS, 2024–2025 
           TABLE 10 HEAT EXCHANGER MARKET: KEY CONFERENCES & EVENTS, 2024–2025
    6.12 PATENT ANALYSIS 
           6.12.1 METHODOLOGY
           6.12.2 PATENT TYPES
                     FIGURE 26 HEAT EXCHANGER MARKET: GRANTED PATENTS
           6.12.3 PUBLICATION TRENDS IN LAST 10 YEARS
                     FIGURE 27 NUMBER OF PATENTS YEAR-WISE FROM 2013 TO 2023
           6.12.4 INSIGHTS
           6.12.5 LEGAL STATUS OF PATENTS
           6.12.6 JURISDICTION ANALYSIS
                     FIGURE 28 TOP JURISDICTION
           6.12.7 TOP APPLICANTS
                     FIGURE 29 TOP 10 PATENT APPLICANTS
                     TABLE 11 PATENTS BY RAYTHEON TECHNOLOGIES CORPORATION
                     TABLE 12 PATENTS BY DENSO CORPORATION
                     TABLE 13 PATENTS BY MITSUBISHI ELECTRIC CORPORATION
                     TABLE 14 TOP 10 PATENT OWNERS DURING LAST 12 YEARS
    6.13 KEY STAKEHOLDERS AND BUYING CRITERIA 
           6.13.1 KEY STAKEHOLDERS IN BUYING PROCESS
                     FIGURE 30 INFLUENCE OF STAKEHOLDERS ON BUYING PROCESS FOR TOP 3 APPLICATIONS
                     TABLE 15 INFLUENCE OF STAKEHOLDERS ON BUYING PROCESS FOR TOP 3 APPLICATIONS (%)
           6.13.2 BUYING CRITERIA
                     FIGURE 31 KEY BUYING CRITERIA FOR TOP 3 APPLICATIONS
                     TABLE 16 KEY BUYING CRITERIA FOR TOP 3 APPLICATIONS
    6.14 FUNDING, BY APPLICATION 
           FIGURE 32 FUNDING, BY APPLICATION
 
7 HEAT EXCHANGER MARKET, BY TYPE (Page No. - 97)
    7.1 INTRODUCTION 
          FIGURE 33 PLATE & FRAME HEAT EXCHANGERS PROJECTED TO REGISTER HIGHEST CAGR DURING FORECAST PERIOD
          TABLE 17 HEAT EXCHANGER MARKET, BY TYPE, 2020–2023 (USD MILLION)
          TABLE 18 HEAT EXCHANGER MARKET, BY TYPE, 2024–2029 (USD MILLION)
          TABLE 19 HEAT EXCHANGER MARKET, BY TYPE, 2020–2023 (UNIT)
          TABLE 20 HEAT EXCHANGER MARKET, BY TYPE, 2024–2029 (UNIT)
    7.2 SHELL & TUBE HEAT EXCHANGERS 
           7.2.1 INCREASING DEMAND FROM VARIOUS END-USE INDUSTRIES TO DRIVE MARKET
           7.2.2 TUBULAR HEAT EXCHANGERS
           7.2.3 FIXED TUBE HEAT EXCHANGERS
           7.2.4 U-TUBE HEAT EXCHANGERS
           7.2.5 FLOATING HEAD HEAT EXCHANGERS
    7.3 PLATE & FRAME HEAT EXCHANGERS 
           7.3.1 COST-EFFECTIVENESS AND DURABILITY TO DRIVE MARKET
           7.3.2 GASKETED PLATE & FRAME HEAT EXCHANGERS
           7.3.3 WELDED PLATE & FRAME HEAT EXCHANGERS
           7.3.4 BRAZED HEAT EXCHANGERS
    7.4 AIR COOLED HEAT EXCHANGERS 
           7.4.1 INCREASING USE IN CHEMICAL AND ENERGY INDUSTRIES TO DRIVE MARKET
           7.4.2 FORCED DRAFT HEAT EXCHANGERS
           7.4.3 INDUCED DRAFT HEAT EXCHANGERS
    7.5 OTHER TYPES 
           7.5.1 EXTENDED SURFACE HEAT EXCHANGERS
           7.5.2 REGENERATIVE HEAT EXCHANGERS
 
8 HEAT EXCHANGER MARKET, BY MATERIAL (Page No. - 105)
    8.1 INTRODUCTION 
          FIGURE 34 METALS SEGMENT TO DOMINATE HEAT EXCHANGER MARKET DURING FORECAST PERIOD
          TABLE 21 HEAT EXCHANGER MARKET, BY MATERIAL, 2020–2023 (USD MILLION)
          TABLE 22 HEAT EXCHANGER MARKET, BY MATERIAL, 2024–2029 (USD MILLION)
           8.1.1 METALS
                    8.1.1.1 High thermal conductivity and durability to drive market
                    8.1.1.2 Steel
                               8.1.1.2.1 Carbon steel
                               8.1.1.2.2 Stainless steel
                    8.1.1.3 Copper
                    8.1.1.4 Aluminum
                    8.1.1.5 Titanium
                    8.1.1.6 Nickel
                    8.1.1.7 Other metals
           8.1.2 ALLOYS
                    8.1.2.1 Extreme environmentally friendly nature to drive market
                    8.1.2.2 Nickel alloys
                               8.1.2.2.1 Hastelloy alloys
                               8.1.2.2.2 Inconel alloys
                               8.1.2.2.3 Monel alloys
                               8.1.2.2.4 Other nickel alloys
                    8.1.2.3 Copper alloys
                    8.1.2.4 Titanium alloys
                    8.1.2.5 Other alloys
           8.1.3 BRAZING CLAD MATERIALS
                    8.1.3.1 Enhanced corrosion resistance and thermal conductivity to drive market
                    8.1.3.2 Copper brazing
                    8.1.3.3 Ni clad brazing
                    8.1.3.4 Phosphor copper brazing
                    8.1.3.5 Silver brazing
                    8.1.3.6 Other brazing clad materials
 
9 HEAT EXCHANGER MARKET, BY END-USE INDUSTRY (Page No. - 113)
    9.1 INTRODUCTION 
          FIGURE 35 HVAC & REFRIGERATION INDUSTRY TO REGISTER HIGHEST CAGR DURING FORECAST PERIOD
          TABLE 23 HEAT EXCHANGER MARKET, BY END-USE INDUSTRY, 2020–2023 (USD MILLION)
          TABLE 24 HEAT EXCHANGER MARKET, BY END-USE INDUSTRY, 2024–2029 (USD MILLION)
          TABLE 25 HEAT EXCHANGER MARKET, BY END-USE INDUSTRY, 2020–2023 (UNIT)
          TABLE 26 HEAT EXCHANGER MARKET, BY END-USE INDUSTRY, 2024–2029 (UNIT)
    9.2 CHEMICALS 
           9.2.1 EXTENSIVE USE IN CHEMICAL INDUSTRY TO DRIVE MARKET
           9.2.2 BASE CHEMICALS
           9.2.3 INTERMEDIATE CHEMICALS
           9.2.4 SPECIALTY CHEMICALS
    9.3 ENERGY 
           9.3.1 INCREASING USE FOR HEAT RECOVERY TO DRIVE MARKET
           9.3.2 PETROCHEMICALS
           9.3.3 OIL & GAS
    9.4 HVAC & REFRIGERATION 
           9.4.1 POPULATION GROWTH, URBANIZATION, AND RISING INCOME TO DRIVE MARKET
           9.4.2 DISTRICT HEATING & COOLING
           9.4.3 COMMERCIAL REFRIGERATION
           9.4.4 AIR CONDITIONING
           9.4.5 INDUSTRIAL REFRIGERATION
    9.5 FOOD & BEVERAGES 
           9.5.1 NEED FOR ENERGY EFFICIENCY AND STRINGENT ENVIRONMENTAL REGULATIONS TO DRIVE MARKET
           9.5.2 PROCESS FOOD
           9.5.3 DAIRY
           9.5.4 SUGAR & ETHANOL PRODUCTION
           9.5.5 OTHER FOOD & BEVERAGES
    9.6 POWER 
           9.6.1 ENHANCEMENT IN THERMAL MANAGEMENT TO DRIVE MARKET
           9.6.2 RENEWABLE
           9.6.3 NON-RENEWABLE
    9.7 PULP & PAPER 
           9.7.1 REDUCED FUEL CONSUMPTION AND LOWER OPERATING COSTS TO DRIVE MARKET
    9.8 OTHER END-USE INDUSTRIES 
           9.8.1 METALLURGICAL
           9.8.2 WASTEWATER TREATMENT
           9.8.3 MINING
 
10 HEAT EXCHANGER MARKET, BY REGION (Page No. - 122)
     10.1 INTRODUCTION 
             FIGURE 36 INDIA TO BE FASTEST-GROWING MARKET DURING FORECAST PERIOD
             TABLE 27 HEAT EXCHANGER MARKET, BY REGION, 2020–2023 (USD MILLION)
             TABLE 28 HEAT EXCHANGER MARKET, BY REGION, 2024–2029 (USD MILLION)
             TABLE 29 HEAT EXCHANGER MARKET, BY REGION, 2020–2023 (UNIT)
             TABLE 30 HEAT EXCHANGER MARKET, BY REGION, 2024–2029 (UNIT)
     10.2 NORTH AMERICA 
             10.2.1 RECESSION IMPACT
                        FIGURE 37 NORTH AMERICA: HEAT EXCHANGER MARKET SNAPSHOT
                        TABLE 31 NORTH AMERICA: HEAT EXCHANGER MARKET, BY COUNTRY, 2020–2023 (USD MILLION)
                        TABLE 32 NORTH AMERICA: HEAT EXCHANGER MARKET, BY COUNTRY, 2024–2029 (USD MILLION)
                        TABLE 33 NORTH AMERICA: HEAT EXCHANGER MARKET, BY COUNTRY, 2020–2023 (UNIT)
                        TABLE 34 NORTH AMERICA: HEAT EXCHANGER MARKET, BY COUNTRY, 2024–2029 (UNIT)
                        TABLE 35 NORTH AMERICA: HEAT EXCHANGER MARKET, BY MATERIAL, 2020–2023 (USD MILLION)
                        TABLE 36 NORTH AMERICA: HEAT EXCHANGER MARKET, BY MATERIAL, 2024–2029 (USD MILLION)
                        TABLE 37 NORTH AMERICA: HEAT EXCHANGER MARKET, BY TYPE, 2020–2023 (USD MILLION)
                        TABLE 38 NORTH AMERICA: HEAT EXCHANGER MARKET, BY TYPE, 2024–2029 (USD MILLION)
                        TABLE 39 NORTH AMERICA: HEAT EXCHANGER MARKET, BY TYPE, 2020–2023 (UNIT)
                        TABLE 40 NORTH AMERICA: HEAT EXCHANGER MARKET, BY TYPE, 2024–2029 (UNIT)
                        TABLE 41 NORTH AMERICA: HEAT EXCHANGER MARKET, BY END-USE INDUSTRY, 2020–2023 (USD MILLION)
                        TABLE 42 NORTH AMERICA: HEAT EXCHANGER MARKET, BY END-USE INDUSTRY, 2024–2029 (USD MILLION)
                        TABLE 43 NORTH AMERICA: HEAT EXCHANGER MARKET, BY END-USE INDUSTRY, 2020–2023 (UNIT)
                        TABLE 44 NORTH AMERICA: HEAT EXCHANGER MARKET, BY END-USE INDUSTRY, 2024–2029 (UNIT)
             10.2.2 US
                        10.2.2.1 Change in efficiency standards by DOE to drive market
                                      TABLE 45 US: HEAT EXCHANGER MARKET, BY TYPE, 2020–2023 (USD MILLION)
                                      TABLE 46 US: HEAT EXCHANGER MARKET, BY TYPE, 2024–2029 (USD MILLION)
                                      TABLE 47 US: HEAT EXCHANGER MARKET, BY TYPE, 2020–2023 (UNIT)
                                      TABLE 48 US: HEAT EXCHANGER MARKET, BY TYPE, 2024–2029 (UNIT)
                                      TABLE 49 US: HEAT EXCHANGER MARKET, BY END-USE INDUSTRY, 2020–2023 (USD MILLION)
                                      TABLE 50 US: HEAT EXCHANGER MARKET, BY END-USE INDUSTRY, 2024–2029 (USD MILLION)
                                      TABLE 51 US: HEAT EXCHANGER MARKET, BY END-USE INDUSTRY, 2020–2023 (UNIT)
                                      TABLE 52 US: HEAT EXCHANGER MARKET, BY END-USE INDUSTRY, 2024–2029 (UNIT)
             10.2.3 CANADA
                        10.2.3.1 Availability of vast natural resources to contribute to market growth
                                      TABLE 53 CANADA: HEAT EXCHANGER MARKET, BY TYPE, 2020–2023 (USD MILLION)
                                      TABLE 54 CANADA: HEAT EXCHANGER MARKET, BY TYPE, 2024–2029 (USD MILLION)
                                      TABLE 55 CANADA: HEAT EXCHANGER MARKET, BY TYPE, 2020–2023 (UNIT)
                                      TABLE 56 CANADA: HEAT EXCHANGER MARKET, BY TYPE, 2024–2029 (UNIT)
                                      TABLE 57 CANADA: HEAT EXCHANGER MARKET, BY END-USE INDUSTRY, 2020–2023 (USD MILLION)
                                      TABLE 58 CANADA: HEAT EXCHANGER MARKET, BY END-USE INDUSTRY, 2024–2029 (USD MILLION)
                                      TABLE 59 CANADA: HEAT EXCHANGER MARKET, BY END-USE INDUSTRY, 2020–2023 (UNIT)
                                      TABLE 60 CANADA: HEAT EXCHANGER MARKET, BY END-USE INDUSTRY, 2024–2029 (UNIT)
             10.2.4 MEXICO
                        10.2.4.1 Rising population to drive demand for power generation
                                      TABLE 61 MEXICO: HEAT EXCHANGER MARKET, BY TYPE, 2020–2023 (USD MILLION)
                                      TABLE 62 MEXICO: HEAT EXCHANGER MARKET, BY TYPE, 2024–2029 (USD MILLION)
                                      TABLE 63 MEXICO: HEAT EXCHANGER MARKET, BY TYPE, 2020–2023 (UNIT)
                                      TABLE 64 MEXICO: HEAT EXCHANGER MARKET, BY TYPE, 2024–2029 (UNIT)
                                      TABLE 65 MEXICO: HEAT EXCHANGER MARKET, BY END-USE INDUSTRY, 2020–2023 (USD MILLION)
                                      TABLE 66 MEXICO: HEAT EXCHANGER MARKET, BY END-USE INDUSTRY, 2024–2029 (USD MILLION)
                                      TABLE 67 MEXICO: HEAT EXCHANGER MARKET, BY END-USE INDUSTRY, 2020–2023 (UNIT)
                                      TABLE 68 MEXICO: HEAT EXCHANGER MARKET, BY END-USE INDUSTRY, 2024–2029 (UNIT)
     10.3 EUROPE 
             10.3.1 RECESSION IMPACT
                        FIGURE 38 EUROPE: HEAT EXCHANGER MARKET SNAPSHOT
                        TABLE 69 EUROPE: HEAT EXCHANGER MARKET, BY COUNTRY, 2020–2023 (USD MILLION)
                        TABLE 70 EUROPE: HEAT EXCHANGER MARKET, BY COUNTRY, 2024–2029 (USD MILLION)
                        TABLE 71 EUROPE: HEAT EXCHANGER MARKET, BY COUNTRY, 2020–2023 (UNIT)
                        TABLE 72 EUROPE: HEAT EXCHANGER MARKET, BY COUNTRY, 2024–2029 (UNIT)
                        TABLE 73 EUROPE: HEAT EXCHANGER MARKET, BY MATERIAL, 2020–2023 (USD MILLION)
                        TABLE 74 EUROPE: HEAT EXCHANGER MARKET, BY MATERIAL, 2024–2029 (USD MILLION)
                        TABLE 75 EUROPE: HEAT EXCHANGER MARKET, BY TYPE, 2020–2023 (USD MILLION)
                        TABLE 76 EUROPE: HEAT EXCHANGER MARKET, BY TYPE, 2024–2029 (USD MILLION)
                        TABLE 77 EUROPE: HEAT EXCHANGER MARKET, BY TYPE, 2020–2023 (UNIT)
                        TABLE 78 EUROPE: HEAT EXCHANGER MARKET, BY TYPE, 2024–2029 (UNIT)
                        TABLE 79 EUROPE: HEAT EXCHANGER MARKET, BY END-USE INDUSTRY, 2020–2023 (USD MILLION)
                        TABLE 80 EUROPE: HEAT EXCHANGER MARKET, BY END-USE INDUSTRY, 2024–2029 (USD MILLION)
                        TABLE 81 EUROPE: HEAT EXCHANGER MARKET, BY END-USE INDUSTRY, 2020–2023 (UNIT)
                        TABLE 82 EUROPE: HEAT EXCHANGER MARKET, BY END-USE INDUSTRY, 2024–2029 (UNIT)
             10.3.2 GERMANY
                        10.3.2.1 Energy transition to drive market
                                      TABLE 83 GERMANY: HEAT EXCHANGER MARKET, BY TYPE, 2020–2023 (USD MILLION)
                                      TABLE 84 GERMANY: HEAT EXCHANGER MARKET, BY TYPE, 2024–2029 (USD MILLION)
                                      TABLE 85 GERMANY: HEAT EXCHANGER MARKET, BY TYPE, 2020–2023 (UNIT)
                                      TABLE 86 GERMANY: HEAT EXCHANGER MARKET, BY TYPE, 2024–2029 (UNIT)
                                      TABLE 87 GERMANY: HEAT EXCHANGER MARKET, BY END-USE INDUSTRY, 2020–2023 (USD MILLION)
                                      TABLE 88 GERMANY: HEAT EXCHANGER MARKET, BY END-USE INDUSTRY, 2024–2029 (USD MILLION)
                                      TABLE 89 GERMANY: HEAT EXCHANGER MARKET, BY END-USE INDUSTRY, 2020–2023 (UNIT)
                                      TABLE 90 GERMANY: HEAT EXCHANGER MARKET, BY END-USE INDUSTRY, 2024–2029 (UNIT)
             10.3.3 FRANCE
                        10.3.3.1 Carbon neutrality initiative to influence market growth
                                      TABLE 91 FRANCE: HEAT EXCHANGER MARKET, BY TYPE, 2020–2023 (USD MILLION)
                                      TABLE 92 FRANCE: HEAT EXCHANGER MARKET, BY TYPE, 2024–2029 (USD MILLION)
                                      TABLE 93 FRANCE: HEAT EXCHANGER MARKET, BY TYPE, 2020–2023 (UNIT)
                                      TABLE 94 FRANCE: HEAT EXCHANGER MARKET, BY TYPE, 2024–2029 (UNIT)
                                      TABLE 95 FRANCE: HEAT EXCHANGER MARKET, BY END-USE INDUSTRY, 2020–2023 (USD MILLION)
                                      TABLE 96 FRANCE: HEAT EXCHANGER MARKET, BY END-USE INDUSTRY, 2024–2029 (USD MILLION)
                                      TABLE 97 FRANCE: HEAT EXCHANGER MARKET, BY END-USE INDUSTRY, 2020–2023 (UNIT)
                                      TABLE 98 FRANCE: HEAT EXCHANGER MARKET, BY END-USE INDUSTRY, 2024–2029 (UNIT)
             10.3.4 UK
                        10.3.4.1 Sustainable and energy-efficient heating solutions to boost market
                                      TABLE 99 UK: HEAT EXCHANGER MARKET, BY TYPE, 2020–2023 (USD MILLION)
                                      TABLE 100 UK: HEAT EXCHANGER MARKET, BY TYPE, 2024–2029 (USD MILLION)
                                      TABLE 101 UK: HEAT EXCHANGER MARKET, BY TYPE, 2020–2023 (UNIT)
                                      TABLE 102 UK: HEAT EXCHANGER MARKET, BY TYPE, 2024–2029 (UNIT)
                                      TABLE 103 UK: HEAT EXCHANGER MARKET, BY END-USE INDUSTRY, 2020–2023 (USD MILLION)
                                      TABLE 104 UK: HEAT EXCHANGER MARKET, BY END-USE INDUSTRY, 2024–2029 (USD MILLION)
                                      TABLE 105 UK: HEAT EXCHANGER MARKET, BY END-USE INDUSTRY, 2020–2023 (UNIT)
                                      TABLE 106 UK: HEAT EXCHANGER MARKET, BY END-USE INDUSTRY, 2024–2029 (UNIT)
             10.3.5 ITALY
                        10.3.5.1 Need for sustainability to drive market
                                      TABLE 107 ITALY: HEAT EXCHANGER MARKET, BY TYPE, 2020–2023 (USD MILLION)
                                      TABLE 108 ITALY: HEAT EXCHANGER MARKET, BY TYPE, 2024–2029 (USD MILLION)
                                      TABLE 109 ITALY: HEAT EXCHANGER MARKET, BY TYPE, 2020–2023 (UNIT)
                                      TABLE 110 ITALY: HEAT EXCHANGER MARKET, BY TYPE, 2024–2029 (UNIT)
                                      TABLE 111 ITALY: HEAT EXCHANGER MARKET, BY END-USE INDUSTRY, 2020–2023 (USD MILLION)
                                      TABLE 112 ITALY: HEAT EXCHANGER MARKET, BY END-USE INDUSTRY, 2024–2029 (USD MILLION)
                                      TABLE 113 ITALY: HEAT EXCHANGER MARKET, BY END-USE INDUSTRY, 2020–2023 (UNIT)
                                      TABLE 114 ITALY: HEAT EXCHANGER MARKET, BY END-USE INDUSTRY, 2024–2029 (UNIT)
             10.3.6 RUSSIA
                        10.3.6.1 Oil & gas sector to boost demand for heat exchangers
                                      TABLE 115 RUSSIA: HEAT EXCHANGER MARKET, BY TYPE, 2020–2023 (USD MILLION)
                                      TABLE 116 RUSSIA: HEAT EXCHANGER MARKET, BY TYPE, 2024–2029 (USD MILLION)
                                      TABLE 117 RUSSIA: HEAT EXCHANGER MARKET, BY TYPE, 2020–2023 (UNIT)
                                      TABLE 118 RUSSIA: HEAT EXCHANGER MARKET, BY TYPE, 2024–2029 (UNIT)
                                      TABLE 119 RUSSIA: HEAT EXCHANGER MARKET, BY END-USE INDUSTRY, 2020–2023 (USD MILLION)
                                      TABLE 120 RUSSIA: HEAT EXCHANGER MARKET, BY END-USE INDUSTRY, 2024–2029 (USD MILLION)
                                      TABLE 121 RUSSIA: HEAT EXCHANGER MARKET, BY END-USE INDUSTRY, 2020–2023 (UNIT)
                                      TABLE 122 RUSSIA: HEAT EXCHANGER MARKET, BY END-USE INDUSTRY, 2024–2029 (UNIT)
             10.3.7 TURKEY
                        10.3.7.1 Urbanization and improving living standards to boost demand
                                      TABLE 123 TURKEY: HEAT EXCHANGER MARKET, BY TYPE, 2020–2023 (USD MILLION)
                                      TABLE 124 TURKEY: HEAT EXCHANGER MARKET, BY TYPE, 2024–2029 (USD MILLION)
                                      TABLE 125 TURKEY: HEAT EXCHANGER MARKET, BY TYPE, 2020–2023 (UNIT)
                                      TABLE 126 TURKEY: HEAT EXCHANGER MARKET, BY TYPE, 2024–2029 (UNIT)
                                      TABLE 127 TURKEY: HEAT EXCHANGER MARKET, BY END-USE INDUSTRY, 2020–2023 (USD MILLION)
                                      TABLE 128 TURKEY: HEAT EXCHANGER MARKET, BY END-USE INDUSTRY, 2024–2029 (USD MILLION)
                                      TABLE 129 TURKEY: HEAT EXCHANGER MARKET, BY END-USE INDUSTRY, 2020–2023 (UNIT)
                                      TABLE 130 TURKEY: HEAT EXCHANGER MARKET, BY END-USE INDUSTRY, 2024–2029 (UNIT)
             10.3.8 REST OF EUROPE
                        TABLE 131 REST OF EUROPE: HEAT EXCHANGER MARKET, BY TYPE, 2020–2023 (USD MILLION)
                        TABLE 132 REST OF EUROPE: HEAT EXCHANGER MARKET, BY TYPE, 2024–2029 (USD MILLION)
                        TABLE 133 REST OF EUROPE: HEAT EXCHANGER MARKET, BY TYPE, 2020–2023 (UNIT)
                        TABLE 134 REST OF EUROPE: HEAT EXCHANGER MARKET, BY TYPE, 2024–2029 (UNIT)
                        TABLE 135 REST OF EUROPE: HEAT EXCHANGER MARKET, BY END-USE INDUSTRY, 2020–2023 (USD MILLION)
                        TABLE 136 REST OF EUROPE: HEAT EXCHANGER MARKET, BY END-USE INDUSTRY, 2024–2029 (USD MILLION)
                        TABLE 137 REST OF EUROPE: HEAT EXCHANGER MARKET, BY END-USE INDUSTRY, 2020–2023 (UNIT)
                        TABLE 138 REST OF EUROPE: HEAT EXCHANGER MARKET, BY END-USE INDUSTRY, 2024–2029 (UNIT)
     10.4 ASIA PACIFIC 
             10.4.1 RECESSION IMPACT
                        FIGURE 39 ASIA PACIFIC: HEAT EXCHANGER MARKET SNAPSHOT
                        TABLE 139 ASIA PACIFIC: HEAT EXCHANGER MARKET, BY COUNTRY, 2020–2023 (USD MILLION)
                        TABLE 140 ASIA PACIFIC: HEAT EXCHANGER MARKET, BY COUNTRY, 2024–2029 (USD MILLION)
                        TABLE 141 ASIA PACIFIC: HEAT EXCHANGER MARKET, BY COUNTRY, 2020–2023 (UNIT)
                        TABLE 142 ASIA PACIFIC: HEAT EXCHANGER MARKET, BY COUNTRY, 2024–2029 (UNIT)
                        TABLE 143 ASIA PACIFIC: HEAT EXCHANGER MARKET, BY MATERIAL, 2020–2023 (USD MILLION)
                        TABLE 144 ASIA PACIFIC: HEAT EXCHANGER MARKET, BY MATERIAL, 2024–2029 (USD MILLION)
                        TABLE 145 ASIA PACIFIC: HEAT EXCHANGER MARKET, BY TYPE, 2020–2023 (USD MILLION)
                        TABLE 146 ASIA PACIFIC: HEAT EXCHANGER MARKET, BY TYPE, 2024–2029 (USD MILLION)
                        TABLE 147 ASIA PACIFIC: HEAT EXCHANGER MARKET, BY TYPE, 2020–2023 (UNIT)
                        TABLE 148 ASIA PACIFIC: HEAT EXCHANGER MARKET, BY TYPE, 2024–2029 (UNIT)
                        TABLE 149 ASIA PACIFIC: HEAT EXCHANGER MARKET, BY END-USE INDUSTRY, 2020–2023 (USD MILLION)
                        TABLE 150 ASIA PACIFIC: HEAT EXCHANGER MARKET, BY END-USE INDUSTRY, 2024–2029 (USD MILLION)
                        TABLE 151 ASIA PACIFIC: HEAT EXCHANGER MARKET, BY END-USE INDUSTRY, 2020–2023 (UNIT)
                        TABLE 152 ASIA PACIFIC: HEAT EXCHANGER MARKET, BY END-USE INDUSTRY, 2024–2029 (UNIT)
             10.4.2 CHINA
                        10.4.2.1 Rapid industrialization and thriving end-use industries to grow market
                                      TABLE 153 CHINA: HEAT EXCHANGER MARKET, BY TYPE, 2020–2023 (USD MILLION)
                                      TABLE 154 CHINA: HEAT EXCHANGER MARKET, BY TYPE, 2024–2029 (USD MILLION)
                                      TABLE 155 CHINA: HEAT EXCHANGER MARKET, BY TYPE, 2020–2023 (UNIT)
                                      TABLE 156 CHINA: HEAT EXCHANGER MARKET, BY TYPE, 2024–2029 (UNIT)
                                      TABLE 157 CHINA: HEAT EXCHANGER MARKET, BY END-USE INDUSTRY, 2020–2023 (USD MILLION)
                                      TABLE 158 CHINA: HEAT EXCHANGER MARKET, BY END-USE INDUSTRY, 2024–2029 (USD MILLION)
                                      TABLE 159 CHINA: HEAT EXCHANGER MARKET, BY END-USE INDUSTRY, 2020–2023 (UNIT)
                                      TABLE 160 CHINA: HEAT EXCHANGER MARKET, BY END-USE INDUSTRY, 2024–2029 (UNIT)
             10.4.3 JAPAN
                        10.4.3.1 Food & beverage, construction, and nuclear power industries to drive market
                                      TABLE 161 JAPAN: HEAT EXCHANGER MARKET, BY TYPE, 2020–2023 (USD MILLION)
                                      TABLE 162 JAPAN: HEAT EXCHANGER MARKET, BY TYPE, 2024–2029 (USD MILLION)
                                      TABLE 163 JAPAN: HEAT EXCHANGER MARKET, BY TYPE, 2020–2023 (UNIT)
                                      TABLE 164 JAPAN: HEAT EXCHANGER MARKET, BY TYPE, 2024–2029 (UNIT)
                                      TABLE 165 JAPAN: HEAT EXCHANGER MARKET, BY END-USE INDUSTRY, 2020–2023 (USD MILLION)
                                      TABLE 166 JAPAN: HEAT EXCHANGER MARKET, BY END-USE INDUSTRY, 2024–2029 (USD MILLION)
                                      TABLE 167 JAPAN: HEAT EXCHANGER MARKET, BY END-USE INDUSTRY, 2020–2023 (UNIT)
                                      TABLE 168 JAPAN: HEAT EXCHANGER MARKET, BY END-USE INDUSTRY, 2024–2029 (UNIT)
             10.4.4 INDIA
                        10.4.4.1 Rapid industrialization in energy and power generation end-use industries to boost demand
                                      TABLE 169 INDIA: HEAT EXCHANGER MARKET, BY TYPE, 2020–2023 (USD MILLION)
                                      TABLE 170 INDIA: HEAT EXCHANGER MARKET, BY TYPE, 2024–2029 (USD MILLION)
                                      TABLE 171 INDIA: HEAT EXCHANGER MARKET, BY TYPE, 2020–2023 (UNIT)
                                      TABLE 172 INDIA: HEAT EXCHANGER MARKET, BY TYPE, 2024–2029 (UNIT)
                                      TABLE 173 INDIA: HEAT EXCHANGER MARKET, BY END-USE INDUSTRY, 2020–2023 (USD MILLION)
                                      TABLE 174 INDIA: HEAT EXCHANGER MARKET, BY END-USE INDUSTRY, 2024–2029 (USD MILLION)
                                      TABLE 175 INDIA: HEAT EXCHANGER MARKET, BY END-USE INDUSTRY, 2020–2023 (UNIT)
                                      TABLE 176 INDIA: HEAT EXCHANGER MARKET, BY END-USE INDUSTRY, 2024–2029 (UNIT)
             10.4.5 SOUTH KOREA
                        10.4.5.1 Rising commercial construction to boost market
                                      TABLE 177 SOUTH KOREA: HEAT EXCHANGER MARKET, BY TYPE, 2020–2023 (USD MILLION)
                                      TABLE 178 SOUTH KOREA: HEAT EXCHANGER MARKET, BY TYPE, 2024–2029 (USD MILLION)
                                      TABLE 179 SOUTH KOREA: HEAT EXCHANGER MARKET, BY TYPE, 2020–2023 (UNIT)
                                      TABLE 180 SOUTH KOREA: HEAT EXCHANGER MARKET, BY TYPE, 2024–2029 (UNIT)
                                      TABLE 181 SOUTH KOREA: HEAT EXCHANGER MARKET, BY END-USE INDUSTRY, 2020–2023 (USD MILLION)
                                      TABLE 182 SOUTH KOREA: HEAT EXCHANGER MARKET, BY END-USE INDUSTRY, 2024–2029 (USD MILLION)
                                      TABLE 183 SOUTH KOREA: HEAT EXCHANGER MARKET, BY END-USE INDUSTRY, 2020–2023 (UNIT)
                                      TABLE 184 SOUTH KOREA: HEAT EXCHANGER MARKET, BY END-USE INDUSTRY, 2024–2029 (UNIT)
             10.4.6 REST OF ASIA PACIFIC
                        TABLE 185 REST OF ASIA PACIFIC: HEAT EXCHANGER MARKET, BY TYPE, 2020–2023 (USD MILLION)
                        TABLE 186 REST OF ASIA PACIFIC: HEAT EXCHANGER MARKET, BY TYPE, 2024–2029 (USD MILLION)
                        TABLE 187 REST OF ASIA PACIFIC: HEAT EXCHANGER MARKET, BY TYPE, 2020–2023 (UNIT)
                        TABLE 188 REST OF ASIA PACIFIC: HEAT EXCHANGER MARKET, BY TYPE, 2024–2029 (UNIT)
                        TABLE 189 REST OF ASIA PACIFIC: HEAT EXCHANGER MARKET, BY END-USE INDUSTRY, 2020–2023 (USD MILLION)
                        TABLE 190 REST OF ASIA PACIFIC: HEAT EXCHANGER MARKET, BY END-USE INDUSTRY, 2024–2029 (USD MILLION)
                        TABLE 191 REST OF ASIA PACIFIC: HEAT EXCHANGER MARKET, BY END-USE INDUSTRY, 2020–2023 (UNIT)
                        TABLE 192 REST OF ASIA PACIFIC: HEAT EXCHANGER MARKET, BY END-USE INDUSTRY, 2024–2029 (UNIT)
     10.5 SOUTH AMERICA 
             10.5.1 RECESSION IMPACT
                        TABLE 193 SOUTH AMERICA: HEAT EXCHANGER MARKET, BY COUNTRY, 2020–2023 (USD MILLION)
                        TABLE 194 SOUTH AMERICA: HEAT EXCHANGER MARKET, BY COUNTRY, 2024–2029 (USD MILLION)
                        TABLE 195 SOUTH AMERICA: HEAT EXCHANGER MARKET, BY COUNTRY, 2020–2023 (UNIT)
                        TABLE 196 SOUTH AMERICA: HEAT EXCHANGER MARKET, BY COUNTRY, 2024–2029 (UNIT)
                        TABLE 197 SOUTH AMERICA: HEAT EXCHANGER MARKET, BY MATERIAL, 2020–2023 (USD MILLION)
                        TABLE 198 SOUTH AMERICA: HEAT EXCHANGER MARKET, BY MATERIAL, 2024–2029 (USD MILLION)
                        TABLE 199 SOUTH AMERICA: HEAT EXCHANGER MARKET, BY TYPE, 2020–2023 (USD MILLION)
                        TABLE 200 SOUTH AMERICA: HEAT EXCHANGER MARKET, BY TYPE, 2024–2029 (USD MILLION)
                        TABLE 201 SOUTH AMERICA: HEAT EXCHANGER MARKET, BY TYPE, 2020–2023 (UNIT)
                        TABLE 202 SOUTH AMERICA: HEAT EXCHANGER MARKET, BY TYPE, 2024–2029 (UNIT)
                        TABLE 203 SOUTH AMERICA: HEAT EXCHANGER MARKET, BY END-USE INDUSTRY, 2020–2023 (USD MILLION)
                        TABLE 204 SOUTH AMERICA: HEAT EXCHANGER MARKET, BY END-USE INDUSTRY, 2024–2029 (USD MILLION)
                        TABLE 205 SOUTH AMERICA: HEAT EXCHANGER MARKET, BY END-USE INDUSTRY, 2020–2023 (UNIT)
                        TABLE 206 SOUTH AMERICA: HEAT EXCHANGER MARKET, BY END-USE INDUSTRY, 2024–2029 (UNIT)
             10.5.2 BRAZIL
                        10.5.2.1 Energy transition due to natural calamity to influence market
                                      TABLE 207 BRAZIL: HEAT EXCHANGER MARKET, BY TYPE, 2020–2023 (USD MILLION)
                                      TABLE 208 BRAZIL: HEAT EXCHANGER MARKET, BY TYPE, 2024–2029 (USD MILLION)
                                      TABLE 209 BRAZIL: HEAT EXCHANGER MARKET, BY TYPE, 2020–2023 (UNIT)
                                      TABLE 210 BRAZIL: HEAT EXCHANGER MARKET, BY TYPE, 2024–2029 (UNIT)
                                      TABLE 211 BRAZIL: HEAT EXCHANGER MARKET, BY END-USE INDUSTRY, 2020–2023 (USD MILLION)
                                      TABLE 212 BRAZIL: HEAT EXCHANGER MARKET, BY END-USE INDUSTRY, 2024–2029 (USD MILLION)
                                      TABLE 213 BRAZIL: HEAT EXCHANGER MARKET, BY END-USE INDUSTRY, 2020–2023 (UNIT)
                                      TABLE 214 BRAZIL: HEAT EXCHANGER MARKET, BY END-USE INDUSTRY, 2024–2029 (UNIT)
             10.5.3 ARGENTINA
                        10.5.3.1 Focus on non-hydro renewable sources to boost demand
                                      TABLE 215 ARGENTINA: HEAT EXCHANGER MARKET, BY TYPE, 2020–2023 (USD MILLION)
                                      TABLE 216 ARGENTINA: HEAT EXCHANGER MARKET, BY TYPE, 2024–2029 (USD MILLION)
                                      TABLE 217 ARGENTINA: HEAT EXCHANGER MARKET, BY TYPE, 2020–2023 (UNIT)
                                      TABLE 218 ARGENTINA: HEAT EXCHANGER MARKET, BY TYPE, 2024–2029 (UNIT)
                                      TABLE 219 ARGENTINA: HEAT EXCHANGER MARKET, BY END-USE INDUSTRY, 2020–2023 (USD MILLION)
                                      TABLE 220 ARGENTINA: HEAT EXCHANGER MARKET, BY END-USE INDUSTRY, 2024–2029 (USD MILLION)
                                      TABLE 221 ARGENTINA: HEAT EXCHANGER MARKET, BY END-USE INDUSTRY, 2020–2023 (UNIT)
                                      TABLE 222 ARGENTINA: HEAT EXCHANGER MARKET, BY END-USE INDUSTRY, 2024–2029 (UNIT)
             10.5.4 REST OF SOUTH AMERICA
                        TABLE 223 REST OF SOUTH AMERICA: HEAT EXCHANGER MARKET, BY TYPE, 2020–2023 (USD MILLION)
                        TABLE 224 REST OF SOUTH AMERICA: HEAT EXCHANGER MARKET, BY TYPE, 2024–2029 (USD MILLION)
                        TABLE 225 REST OF SOUTH AMERICA: HEAT EXCHANGER MARKET, BY TYPE, 2020–2023 (UNIT)
                        TABLE 226 REST OF SOUTH AMERICA: HEAT EXCHANGER MARKET, BY TYPE, 2024–2029 (UNIT)
                        TABLE 227 REST OF SOUTH AMERICA: HEAT EXCHANGER MARKET, BY END-USE INDUSTRY, 2020–2023 (USD MILLION)
                        TABLE 228 REST OF SOUTH AMERICA: HEAT EXCHANGER MARKET, BY END-USE INDUSTRY, 2024–2029 (USD MILLION)
                        TABLE 229 REST OF SOUTH AMERICA: HEAT EXCHANGER MARKET, BY END-USE INDUSTRY, 2020–2023 (UNIT)
                        TABLE 230 REST OF SOUTH AMERICA: HEAT EXCHANGER MARKET, BY END-USE INDUSTRY, 2024–2029 (UNIT)
     10.6 MIDDLE EAST & AFRICA 
             10.6.1 IMPACT OF RECESSION
                        TABLE 231 MIDDLE EAST & AFRICA: HEAT EXCHANGER MARKET, BY COUNTRY, 2020–2023 (USD MILLION)
                        TABLE 232 MIDDLE EAST & AFRICA: HEAT EXCHANGER MARKET, BY COUNTRY, 2024–2029 (USD MILLION)
                        TABLE 233 MIDDLE EAST & AFRICA: HEAT EXCHANGER MARKET, BY COUNTRY, 2020–2023 (UNIT)
                        TABLE 234 MIDDLE EAST & AFRICA: HEAT EXCHANGER MARKET, BY COUNTRY, 2024–2029 (UNIT)
                        TABLE 235 MIDDLE EAST & AFRICA: HEAT EXCHANGER MARKET, BY MATERIAL, 2020–2023 (USD MILLION)
                        TABLE 236 MIDDLE EAST & AFRICA: HEAT EXCHANGER MARKET, BY MATERIAL, 2024–2029 (USD MILLION)
                        TABLE 237 MIDDLE EAST & AFRICA: HEAT EXCHANGER MARKET, BY TYPE, 2020–2023 (USD MILLION)
                        TABLE 238 MIDDLE EAST & AFRICA: HEAT EXCHANGER MARKET, BY TYPE, 2024–2029 (USD MILLION)
                        TABLE 239 MIDDLE EAST & AFRICA: HEAT EXCHANGER MARKET, BY TYPE, 2020–2023 (UNIT)
                        TABLE 240 MIDDLE EAST & AFRICA: HEAT EXCHANGER MARKET, BY TYPE, 2024–2029 (UNIT)
                        TABLE 241 MIDDLE EAST & AFRICA: HEAT EXCHANGER MARKET, BY END-USE INDUSTRY, 2020–2023 (USD MILLION)
                        TABLE 242 MIDDLE EAST & AFRICA: HEAT EXCHANGER MARKET, BY END-USE INDUSTRY, 2024–2029 (USD MILLION)
                        TABLE 243 MIDDLE EAST & AFRICA: HEAT EXCHANGER MARKET, BY END-USE INDUSTRY, 2020–2023 (UNIT)
                        TABLE 244 MIDDLE EAST & AFRICA: HEAT EXCHANGER MARKET, BY END-USE INDUSTRY, 2024–2029 (UNIT)
             10.6.2 GCC COUNTRIES
                        10.6.2.1 Saudi Arabia
                                     10.6.2.1.1 Rising commercial construction and HVAC industry to drive market
                                                      TABLE 245 SAUDI ARABIA: HEAT EXCHANGER MARKET, BY TYPE, 2020–2023 (USD MILLION)
                                                      TABLE 246 SAUDI ARABIA: HEAT EXCHANGER MARKET, BY TYPE, 2024–2029 (USD MILLION)
                                                      TABLE 247 SAUDI ARABIA: HEAT EXCHANGER MARKET, BY TYPE, 2020–2023 (UNIT)
                                                      TABLE 248 SAUDI ARABIA: HEAT EXCHANGER MARKET, BY TYPE, 2024–2029 (UNIT)
                                                      TABLE 249 SAUDI ARABIA: HEAT EXCHANGER MARKET, BY END-USE INDUSTRY, 2020–2023 (USD MILLION)
                                                      TABLE 250 SAUDI ARABIA: HEAT EXCHANGER MARKET, BY END-USE INDUSTRY, 2024–2029 (USD MILLION)
                                                      TABLE 251 SAUDI ARABIA: HEAT EXCHANGER MARKET, BY END-USE INDUSTRY, 2020–2023 (UNIT)
                                                      TABLE 252 SAUDI ARABIA: HEAT EXCHANGER MARKET, BY END-USE INDUSTRY, 2024–2029 (UNIT)
                        10.6.2.2 Qatar
                                     10.6.2.2.1 Oil & gas industry to contribute to rise in demand for heat exchangers
                                                      TABLE 253 QATAR: HEAT EXCHANGER MARKET, BY TYPE, 2020–2023 (USD MILLION)
                                                      TABLE 254 QATAR: HEAT EXCHANGER MARKET, BY TYPE, 2024–2029 (USD MILLION)
                                                      TABLE 255 QATAR: HEAT EXCHANGER MARKET, BY TYPE, 2020–2023 (UNIT)
                                                      TABLE 256 QATAR: HEAT EXCHANGER MARKET, BY TYPE, 2024–2029 (UNIT)
                                                      TABLE 257 QATAR: HEAT EXCHANGER MARKET, BY END-USE INDUSTRY, 2020–2023 (USD MILLION)
                                                      TABLE 258 QATAR: HEAT EXCHANGER MARKET, BY END-USE INDUSTRY, 2024–2029 (USD MILLION)
                                                      TABLE 259 QATAR: HEAT EXCHANGER MARKET, BY END-USE INDUSTRY, 2020–2023 (UNIT)
                                                      TABLE 260 QATAR: HEAT EXCHANGER MARKET, BY END-USE INDUSTRY, 2024–2029 (UNIT)
                        10.6.2.3 Other GCC Countries
                                     10.6.2.3.1 Adoption of district cooling systems to drive market
                                                      TABLE 261 OTHER GCC COUNTRIES: HEAT EXCHANGER MARKET, BY TYPE, 2020–2023 (USD MILLION)
                                                      TABLE 262 OTHER GCC COUNTRIES: HEAT EXCHANGER MARKET, BY TYPE, 2024–2029 (USD MILLION)
                                                      TABLE 263 OTHER GCC COUNTRIES: HEAT EXCHANGER MARKET, BY TYPE, 2020–2023 (UNIT)
                                                      TABLE 264 OTHER GCC COUNTRIES: HEAT EXCHANGER MARKET, BY TYPE, 2024–2029 (UNIT)
                                                      TABLE 265 OTHER GCC COUNTRIES: HEAT EXCHANGER MARKET, BY END-USE INDUSTRY, 2020–2023 (USD MILLION)
                                                      TABLE 266 OTHER GCC COUNTRIES: HEAT EXCHANGER MARKET, BY END-USE INDUSTRY, 2024–2029 (USD MILLION)
                                                      TABLE 267 OTHER GCC COUNTRIES: HEAT EXCHANGER MARKET, BY END-USE INDUSTRY, 2020–2023 (UNIT)
                                                      TABLE 268 OTHER GCC COUNTRIES: HEAT EXCHANGER MARKET, BY END-USE INDUSTRY, 2024–2029 (UNIT)
             10.6.3 REST OF MIDDLE EAST & AFRICA
                        TABLE 269 REST OF MIDDLE EAST & AFRICA: HEAT EXCHANGER MARKET, BY TYPE, 2020–2023 (USD MILLION)
                        TABLE 270 REST OF MIDDLE EAST & AFRICA: HEAT EXCHANGER MARKET, BY TYPE, 2024–2029 (USD MILLION)
                        TABLE 271 REST OF MIDDLE EAST & AFRICA: HEAT EXCHANGER MARKET, BY TYPE, 2020–2023 (UNIT)
                        TABLE 272 REST OF MIDDLE EAST & AFRICA: HEAT EXCHANGER MARKET, BY TYPE, 2024–2029 (UNIT)
                        TABLE 273 REST OF MIDDLE EAST & AFRICA: HEAT EXCHANGER MARKET, BY END-USE INDUSTRY, 2020–2023 (USD MILLION)
                        TABLE 274 REST OF MIDDLE EAST & AFRICA: HEAT EXCHANGER MARKET, BY END-USE INDUSTRY, 2024–2029 (USD MILLION)
                        TABLE 275 REST OF MIDDLE EAST & AFRICA: HEAT EXCHANGER MARKET, BY END-USE INDUSTRY, 2020–2023 (UNIT)
                        TABLE 276 REST OF MIDDLE EAST & AFRICA: HEAT EXCHANGER MARKET, BY END-USE INDUSTRY, 2024–2029 (UNIT)
 
11 COMPETITIVE LANDSCAPE (Page No. - 225)
     11.1 OVERVIEW 
     11.2 KEY PLAYER STRATEGIES 
             FIGURE 40 OVERVIEW OF STRATEGIES ADOPTED BY KEY PLAYERS IN HEAT EXCHANGER MARKET BETWEEN 2019 AND 2023
     11.3 REVENUE ANALYSIS, 2021–2023 
             FIGURE 41 REVENUE ANALYSIS OF KEY COMPANIES IN HEAT EXCHANGER MARKET, 2021–2023
             TABLE 277 THREE-YEAR REVENUE ANALYSIS OF KEY COMPANIES IN HEAT EXCHANGER MARKET
     11.4 MARKET SHARE ANALYSIS, 2023 
             FIGURE 42 MARKET SHARES OF LEADING COMPANIES IN HEAT EXCHANGER MARKET, 2023
             TABLE 278 HEAT EXCHANGER MARKET: DEGREE OF COMPETITION
             11.4.1 MARKET RANKING ANALYSIS
     11.5 COMPANY VALUATION AND FINANCIAL METRICS 
             FIGURE 43 COMPANY VALUATION OF LEADING COMPANIES IN HEAT EXCHANGER MARKET, 2023
             FIGURE 44 FINANCIAL METRICS OF LEADING COMPANIES IN HEAT EXCHANGER MARKET, 2023
     11.6 BRAND/PRODUCT COMPARISON 
             FIGURE 45 HEAT EXCHANGER MARKET: BRAND/PRODUCT COMPARISON
     11.7 COMPANY EVALUATION MATRIX: KEY PLAYERS, 2023 
             11.7.1 STARS
             11.7.2 EMERGING LEADERS
             11.7.3 PERVASIVE PLAYERS
             11.7.4 PARTICIPANTS
                        FIGURE 46 HEAT EXCHANGER MARKET: COMPANY EVALUATION MATRIX FOR KEY COMPANIES, 2023
             11.7.5 COMPANY FOOTPRINT
                        11.7.5.1 Company type footprint
                                      TABLE 279 HEAT EXCHANGER MARKET: COMPANY TYPE FOOTPRINT
                        11.7.5.2 Company material footprint
                                      TABLE 280 HEAT EXCHANGER MARKET: COMPANY MATERIAL FOOTPRINT
                        11.7.5.3 Company end-use industry footprint
                                      TABLE 281 HEAT EXCHANGER MARKET: COMPANY END-USE INDUSTRY FOOTPRINT
                        11.7.5.4 Company region footprint
                                      TABLE 282 HEAT EXCHANGER MARKET: COMPANY REGION FOOTPRINT
                        11.7.5.5 Company overall footprint
                                      TABLE 283 HEAT EXCHANGER MARKET: COMPANY OVERALL FOOTPRINT
     11.8 COMPANY EVALUATION MATRIX: START-UPS AND SMES, 2023 
             11.8.1 PROGRESSIVE COMPANIES
             11.8.2 RESPONSIVE COMPANIES
             11.8.3 DYNAMIC COMPANIES
             11.8.4 STARTING BLOCKS
                        FIGURE 47 HEAT EXCHANGER MARKET: START-UPS AND SMES EVALUATION MATRIX, 2023
             11.8.5 COMPETITIVE BENCHMARKING
                        TABLE 284 HEAT EXCHANGER MARKET: LIST OF KEY START-UPS/SMES
                        TABLE 285 HEAT EXCHANGER MARKET: COMPETITIVE BENCHMARKING OF START-UPS/SMES
     11.9 COMPETITIVE SCENARIO AND TRENDS 
             11.9.1 PRODUCT LAUNCHES
                        TABLE 286 HEAT EXCHANGER MARKET: PRODUCT LAUNCHES, JANUARY 2019–APRIL 2024
             11.9.2 DEALS
                        TABLE 287 HEAT EXCHANGER MARKET: DEALS, FEBRUARY 2019 – DECEMBER 2023
             11.9.3 EXPANSIONS
                        TABLE 288 HEAT EXCHANGER MARKET: EXPANSIONS, JANUARY 2019 – SEPTEMBER 2023
 
12 COMPANY PROFILES (Page No. - 253)
(Business overview, Products/Solutions/Services offered, Recent Developments, Product launches, Deals, Expansions, MnM view, Right to win, Strategic choices, Weaknesses and competitive threats) *
     12.1 KEY PLAYERS 
             12.1.1 ALFA LAVAL
                        TABLE 289 ALFA LAVAL: COMPANY OVERVIEW
                        FIGURE 48 ALFA LAVAL: COMPANY SNAPSHOT
                        TABLE 290 ALFA LAVAL: PRODUCTS/SOLUTIONS/SERVICES OFFERED
                        TABLE 291 HEAT EXCHANGER MARKET: PRODUCT LAUNCHES, APRIL 2019 – APRIL 2024
                        TABLE 292 HEAT EXCHANGER MARKET: DEALS, FEBRUARY 2021 – DECEMBER 2023
                        TABLE 293 HEAT EXCHANGER MARKET: EXPANSIONS, JUNE 2019 – FEBRUARY 2021
             12.1.2 KELVION HOLDING GMBH
                        TABLE 294 KELVION HOLDING GMBH: COMPANY OVERVIEW
                        TABLE 295 KELVION HOLDING GMBH: PRODUCTS/SOLUTIONS/SERVICES OFFERED
                        TABLE 296 HEAT EXCHANGER: PRODUCT LAUNCHES, JANUARY 2019 – MAY 2021
                        TABLE 297 HEAT EXCHANGER MARKET: EXPANSIONS, OCTOBER 2021 – SEPTEMBER 2023
             12.1.3 DANFOSS
                        TABLE 298 DANFOSS: COMPANY OVERVIEW
                        FIGURE 49 DANFOSS: COMPANY SNAPSHOT
                        TABLE 299 DANFOSS: PRODUCTS/SOLUTIONS/SERVICES OFFERED
                        TABLE 300 HEAT EXCHANGER MARKET: PRODUCT LAUNCHES, DECEMBER 2020 – APRIL 2023
                        TABLE 301 HEAT EXCHANGER MARKET: DEALS, MARCH 2023 – NOVEMBER 2023
                        TABLE 302 HEAT EXCHANGER MARKET: EXPANSIONS, AUGUST 2018
             12.1.4 EXCHANGER INDUSTRIES LIMITED
                        TABLE 303 EXCHANGER INDUSTRIES LIMITED: COMPANY OVERVIEW
                        TABLE 304 EXCHANGER INDUSTRIES LIMITED: PRODUCT OFFERINGS
                        TABLE 305 HEAT EXCHANGER MARKET: PRODUCT LAUNCHES, NOVEMBER 2020
                        TABLE 306 HEAT EXCHANGER MARKET: DEALS, JULY 2021
             12.1.5 MERSEN
                        TABLE 307 MERSEN: COMPANY OVERVIEW
                        FIGURE 50 MERSEN: COMPANY SNAPSHOT
                        TABLE 308 MERSEN: PRODUCTS/SOLUTIONS/SERVICES OFFERED
                        TABLE 309 HEAT EXCHANGER MARKET: DEALS, NOVEMBER 2019
             12.1.6 API HEAT TRANSFER
                        TABLE 310 API HEAT TRANSFER: COMPANY OVERVIEW
                        TABLE 311 API HEAT TRANSFER: PRODUCTS/SOLUTIONS/SERVICES OFFERED
             12.1.7 BOYD
                        TABLE 312 BOYD: COMPANY OVERVIEW
                        TABLE 313 BOYD: PRODUCTS/SOLUTIONS/SERVICES OFFERED
                        TABLE 314 HEAT EXCHANGER MARKET: DEALS
                        TABLE 315 HEAT EXCHANGER MARKET: EXPANSIONS, JANUARY 2021 – JUNE 2021
             12.1.8 H. GÜNTNER (UK) LIMITED
                        TABLE 316 H. GÜNTNER (UK) LIMITED: COMPANY OVERVIEW
                        TABLE 317 H. GÜNTNER (UK) LIMITED: PRODUCTS/SOLUTIONS/SERVICES OFFERED
                        TABLE 318 HEAT EXCHANGER MARKET: DEALS, OCTOBER 2022
             12.1.9 JOHNSON CONTROLS
                        TABLE 319 JOHNSON CONTROLS: COMPANY OVERVIEW
                        FIGURE 51 JOHNSON CONTROLS: COMPANY SNAPSHOT
                        TABLE 320 JOHNSON CONTROLS: PRODUCTS/SOLUTIONS/SERVICES OFFERED
                        TABLE 321 HEAT EXCHANGER MARKET: PRODUCT LAUNCHES, FEBRUARY 2020
             12.1.10 XYLEM
                        TABLE 322 XYLEM: COMPANY OVERVIEW
                        FIGURE 52 XYLEM: COMPANY SNAPSHOT
                        TABLE 323 XYLEM: PRODUCTS/SOLUTIONS/SERVICES OFFERED
             12.1.11 WABTEC CORPORATION
                        TABLE 324 WABTEC CORPORATION: COMPANY OVERVIEW
                        FIGURE 53 WABTEC CORPORATION: COMPANY SNAPSHOT
                        TABLE 325 WABTEC CORPORATION: PRODUCTS/SOLUTIONS/SERVICES OFFERED
                        TABLE 326 HEAT EXCHANGER MARKET: DEALS, FEBRUARY 2019 – DECEMBER 2020
                        TABLE 327 HEAT EXCHANGER MARKET: EXPANSIONS, OCTOBER 2021
             12.1.12 SPX FLOW
                        TABLE 328 SPX FLOW: COMPANY OVERVIEW
                        FIGURE 54 SPX FLOW: COMPANY SNAPSHOT
                        TABLE 329 SPX FLOW: PRODUCTS/SOLUTIONS/SERVICES OFFERED
             12.1.13 LU-VE S.P.A.
                        TABLE 330 LU-VE S.P.A.: COMPANY OVERVIEW
                        FIGURE 55 LU-VE S.P.A.: COMPANY SNAPSHOT
                        TABLE 331 LU-VE S.P.A.: PRODUCTS/SOLUTIONS/SERVICES OFFERED
                        TABLE 332 HEAT EXCHANGER: DEALS, APRIL 2019 – MARCH 2022
                        TABLE 333 HEAT EXCHANGER MARKET: EXPANSIONS, JUNE 2019
             12.1.14 LENNOX INTERNATIONAL INC.
                        TABLE 334 LENNOX INTERNATIONAL INC.: COMPANY OVERVIEW
                        FIGURE 56 LENNOX INTERNATIONAL INC.: COMPANY SNAPSHOT
                        TABLE 335 LENNOX INTERNATIONAL INC: PRODUCTS/SOLUTIONS/SERVICES OFFERED
             12.1.15 MODINE MANUFACTURING COMPANY
                        TABLE 336 MODINE MANUFACTURING COMPANY: COMPANY OVERVIEW
                        FIGURE 57 MODINE MANUFACTURING COMPANY: COMPANY SNAPSHOT
                        TABLE 337 MODINE MANUFACTURING COMPANY: PRODUCTS/SOLUTIONS/SERVICES OFFERED
                        TABLE 338 HEAT EXCHANGER MARKET: DEALS, JULY 2023 – AUGUST 2023
             12.1.16 WEILAND
                        TABLE 339 WEILAND: COMPANY OVERVIEW
                        TABLE 340 WEILAND: PRODUCTS/SOLUTIONS/SERVICES OFFERED
                        TABLE 341 HEAT EXCHANGER MARKET: DEALS, FEBRUARY 2022
                        TABLE 342 HEAT EXCHANGER MARKET: OTHERS, NOVEMBER 2023
*Details on Business overview, Products/Solutions/Services offered, Recent Developments, Product launches, Deals, Expansions, MnM view, Right to win, Strategic choices, Weaknesses and competitive threats might not be captured in case of unlisted companies.
     12.2 OTHER PLAYERS 
             12.2.1 AIR PRODUCTS AND CHEMICALS, INC.
             12.2.2 BARRIQUAND HEAT EXCHANGERS
             12.2.3 BRASK, INC.
             12.2.4 CATARACT STEEL
             12.2.5 CHART INDUSTRIES
             12.2.6 DOOSAN CORPORATION
             12.2.7 FUNKEWÄRMETAUSCHER APPARATEBAU GMBH
             12.2.8 HISAKA WORKS, LTD.
                        TABLE 343 HISAKA WORKS, LTD.: COMPANY OVERVIEW
             12.2.9 HINDUSTAN DORR-OLIVER LTD.
                        TABLE 344 HINDUSTAN DORR-OLIVER LTD.: COMPANY OVERVIEW
             12.2.10 KOCH HEAT TRANSFER COMPANY
                        TABLE 345 KOCH HEAT TRANSFER COMPANY: COMPANY OVERVIEW
             12.2.11 RADIANT HEAT EXCHANGER PVT. LTD.
                        TABLE 346 RADIANT HEAT EXCHANGER PVT. LTD.: COMPANY OVERVIEW
             12.2.12 SWEP INTERNATIONAL AB
                        TABLE 347 SWEP INTERNATIONAL AB: COMPANY OVERVIEW
             12.2.13 THERMAX LIMITED
                        TABLE 348 THERMAX LIMITED: COMPANY OVERVIEW
             12.2.14 SIERRA S.P.A.
                        TABLE 349 SIERRA S.P.A.: COMPANY OVERVIEW
             12.2.15 VAHTERUS OY
                        TABLE 350 VAHTERUS OY: COMPANY OVERVIEWh
 
13 APPENDIX (Page No. - 328)
     13.1 DISCUSSION GUIDE 
     13.2 KNOWLEDGESTORE: MARKETSANDMARKETS’ SUBSCRIPTION PORTAL 
     13.3 CUSTOMIZATION OPTIONS 
     13.4 RELATED REPORTS 
     13.5 AUTHOR DETAILS 

The study involved four major activities in estimating the market size of the heat exchangers market. Exhaustive secondary research was done to collect information on the market, the peer market, and the grandparent market. The next step was to validate these findings, assumptions, and sizing with industry experts across the value chain through primary research. Both top-down and bottom-up approaches were employed to estimate the complete market size. Thereafter, the market breakdown and data triangulation procedures were used to estimate the market size of the segments and subsegments.

Secondary Research

In the secondary research process, various secondary sources have been referred to for identifying and collecting information for this study. These secondary sources include annual reports, press releases, investor presentations of companies, white papers, certified publications, trade directories, articles from recognized authors, gold standard and silver standard websites, and databases. Secondary research has been used to obtain key information about the value chain of the industry, monetary chain of the market, the total pool of key players, market classification and segmentation according to industry trends to the bottom-most level, and regional markets. It was also used to obtain information about the key developments from a market-oriented perspective.

Primary Research

The heat exchangers market comprises several stakeholders in the value chain, which include manufacturers, and end users. Various primary sources from the supply and demand sides of the heat exchangers market have been interviewed to obtain qualitative and quantitative information. The primary interviewees from the demand side include key opinion leaders in HVACR sectors. The primary sources from the supply side include manufacturers, associations, and institutions involved in the heat exchangers industry. Primary interviews were conducted to gather insights such as market statistics, data of revenue collected from the products and services, market breakdowns, market size estimations, market forecasting, and data triangulation. Primary research also helped in understanding the various trends related to material, type, end-use industry, and region. Stakeholders from the demand side, such as CIOs, CTOs, and CSOs were interviewed to understand the buyer’s perspective on the suppliers, products, component providers, and their current usage of heat exchangers and outlook of their business, which will affect the overall market.

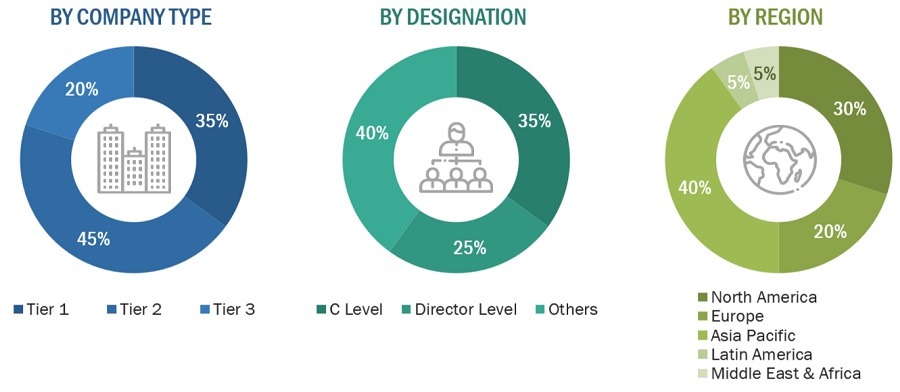
The breakdown of profiles of the primary interviewees is illustrated in the figure below:
Heat Exchanger Market Size, and Share

Note: Tier 1, Tier 2, and Tier 3 companies are classified based on their market revenue in 2022 available in the public domain, product portfolios, and geographical presence.

Other designations include consultants and sales, marketing, and procurement managers.

To know about the assumptions considered for the study, download the pdf brochure

Market Size Estimation

The top-down and bottom-up approaches have been used to estimate and validate the size of the heat exchangerss market.

  • The key players in the industry have been identified through extensive secondary research.
  • The supply chain of the industry has been determined through primary and secondary research.
  • All percentage shares, splits, and breakdowns have been determined using secondary sources and verified through primary sources.
  • All possible parameters that affect the markets covered in this research study have been accounted for, viewed in extensive detail, verified through primary research, and analyzed to obtain the final quantitative and qualitative data.
  • The research includes the study of reports, reviews, and newsletters of the key market players, along with extensive interviews for opinions with leaders such as directors and marketing executives.

Top - Down Approach

Heat Exchanger Market Size, and Share

To know about the assumptions considered for the study, Request for Free Sample Report

Bottom - Up Approach-

Heat Exchanger Market Size, and Share

Data Triangulation

After arriving at the total market size from the estimation process, the overall market has been split into several segments and sub-segments. To complete the overall market engineering process and arrive at the exact statistics for all the segments and sub-segments, the data triangulation and market breakdown procedures have been employed, wherever applicable. The data has been triangulated by studying various factors and trends from both the demand and supply sides. Along with this, the market size has been validated by using both the top-down and bottom-up approaches and primary interviews. Hence, for every data segment, there have been three sources—top-down approach, bottom-up approach, and expert interviews. The data was assumed correct when the values arrived from the three sources matched.

Market Definition

Heat exchangers are mechanical devices designed to transfer heat between two or more fluids or between a solid surface and a fluid, without the fluids mixing or coming into direct contact. They facilitate the efficient exchange of thermal energy from one fluid to another, typically to achieve heating, cooling, or temperature control in various industrial, commercial, and residential applications. Heat exchangers come in various types and configurations, including shell-and-tube heat exchangers, plate heat exchangers, finned-tube heat exchangers, spiral heat exchangers, and more. Each type has its own advantages and is chosen based on factors such as the fluid properties, temperature and pressure requirements, space limitations, and efficiency considerations.

Key Stakeholders

  • Senior Management
  • End User
  • Finance/Procurement Department
  • R&D Department
  • Manufacturers
  • Raw Material Suppliers

Report Objectives

  • To define, describe, and forecast the size of the heat exchangers market, in terms of value and units.
  • To provide detailed information regarding the major factors (drivers, opportunities, restraints, and challenges) influencing the growth of the market
  • To estimate and forecast the market size based on material, type, end-use industry, and region.
  • To forecast the size of the market with respect to major regions, namely, Europe, North America, Asia Pacific, Middle East & Africa, and South America, along with their key countries
  • To strategically analyze micro-markets with respect to individual growth trends, prospects, and their contribution to the overall market
  • To analyze opportunities in the market for stakeholders and provide a competitive landscape of market leaders.
  • To track and analyze recent developments such as expansions, new product launches, partnerships & agreements, and acquisitions in the market.
  • To strategically profile key market players and comprehensively analyze their core competencies.

Available Customizations

Along with the given market data, MarketsandMarkets offers customizations according to the company’s specific needs. The following customization options are available for the report:

Regional Analysis

  • Further breakdown of a region with respect to a particular country or additional application

Company Information

  • Detailed analysis and profiles of additional market players

Tariff & Regulations

  • Regulations and Impact on Heat exchangers Market
Custom Market Research Services

We will customize the research for you, in case the report listed above does not meet with your exact requirements. Our custom research will comprehensively cover the business information you require to help you arrive at strategic and profitable business decisions.

Request Customization

Instant Answers with GPT - Ask Now!

Ask real questions. Get complete answers !
Report Code
CH 3063
Published ON
May, 2024
Choose License Type
BUY NOW
  • SHARE
X
Request Customization
Speak to Analyst
Speak to Analyst
OR FACE-TO-FACE MEETING
PERSONALIZE THIS RESEARCH
  • Triangulate with your Own Data
  • Get Data as per your Format and Definition
  • Gain a Deeper Dive on a Specific Application, Geography, Customer or Competitor
  • Any level of Personalization
REQUEST A FREE CUSTOMIZATION
LET US HELP YOU!
  • What are the Known and Unknown Adjacencies Impacting the Heat Exchanger Market
  • What will your New Revenue Sources be?
  • Who will be your Top Customer; what will make them switch?
  • Defend your Market Share or Win Competitors
  • Get a Scorecard for Target Partners
CUSTOMIZED WORKSHOP REQUEST
+1-888-600-6441
  • Call Us
  • +1-888-600-6441 (Corporate office hours)
  • +1-888-600-6441 (US/Can toll free)
  • +44-800-368-9399 (UK office hours)
CONNECT WITH US
ABOUT TRUST ONLINE
©2024 MarketsandMarkets Research Private Ltd. All rights reserved
DMCA.com Protection Status Website Feedback