
Automotive Heat Exchanger Market Size, Share & Analysis

Automotive Heat Exchanger Market by Propulsion and Component (Radiator, Condenser, Chiller, Evaporator, Oil cooler, CAC, Heater, EGR), Design, OHV Type, Vehicle Type, EV Type (BEV, HEV, and PHEV), and Region - Global Forecast to 2032


OVERVIEW
Source: Secondary Research, Interviews with Experts, MarketsandMarkets Analysis
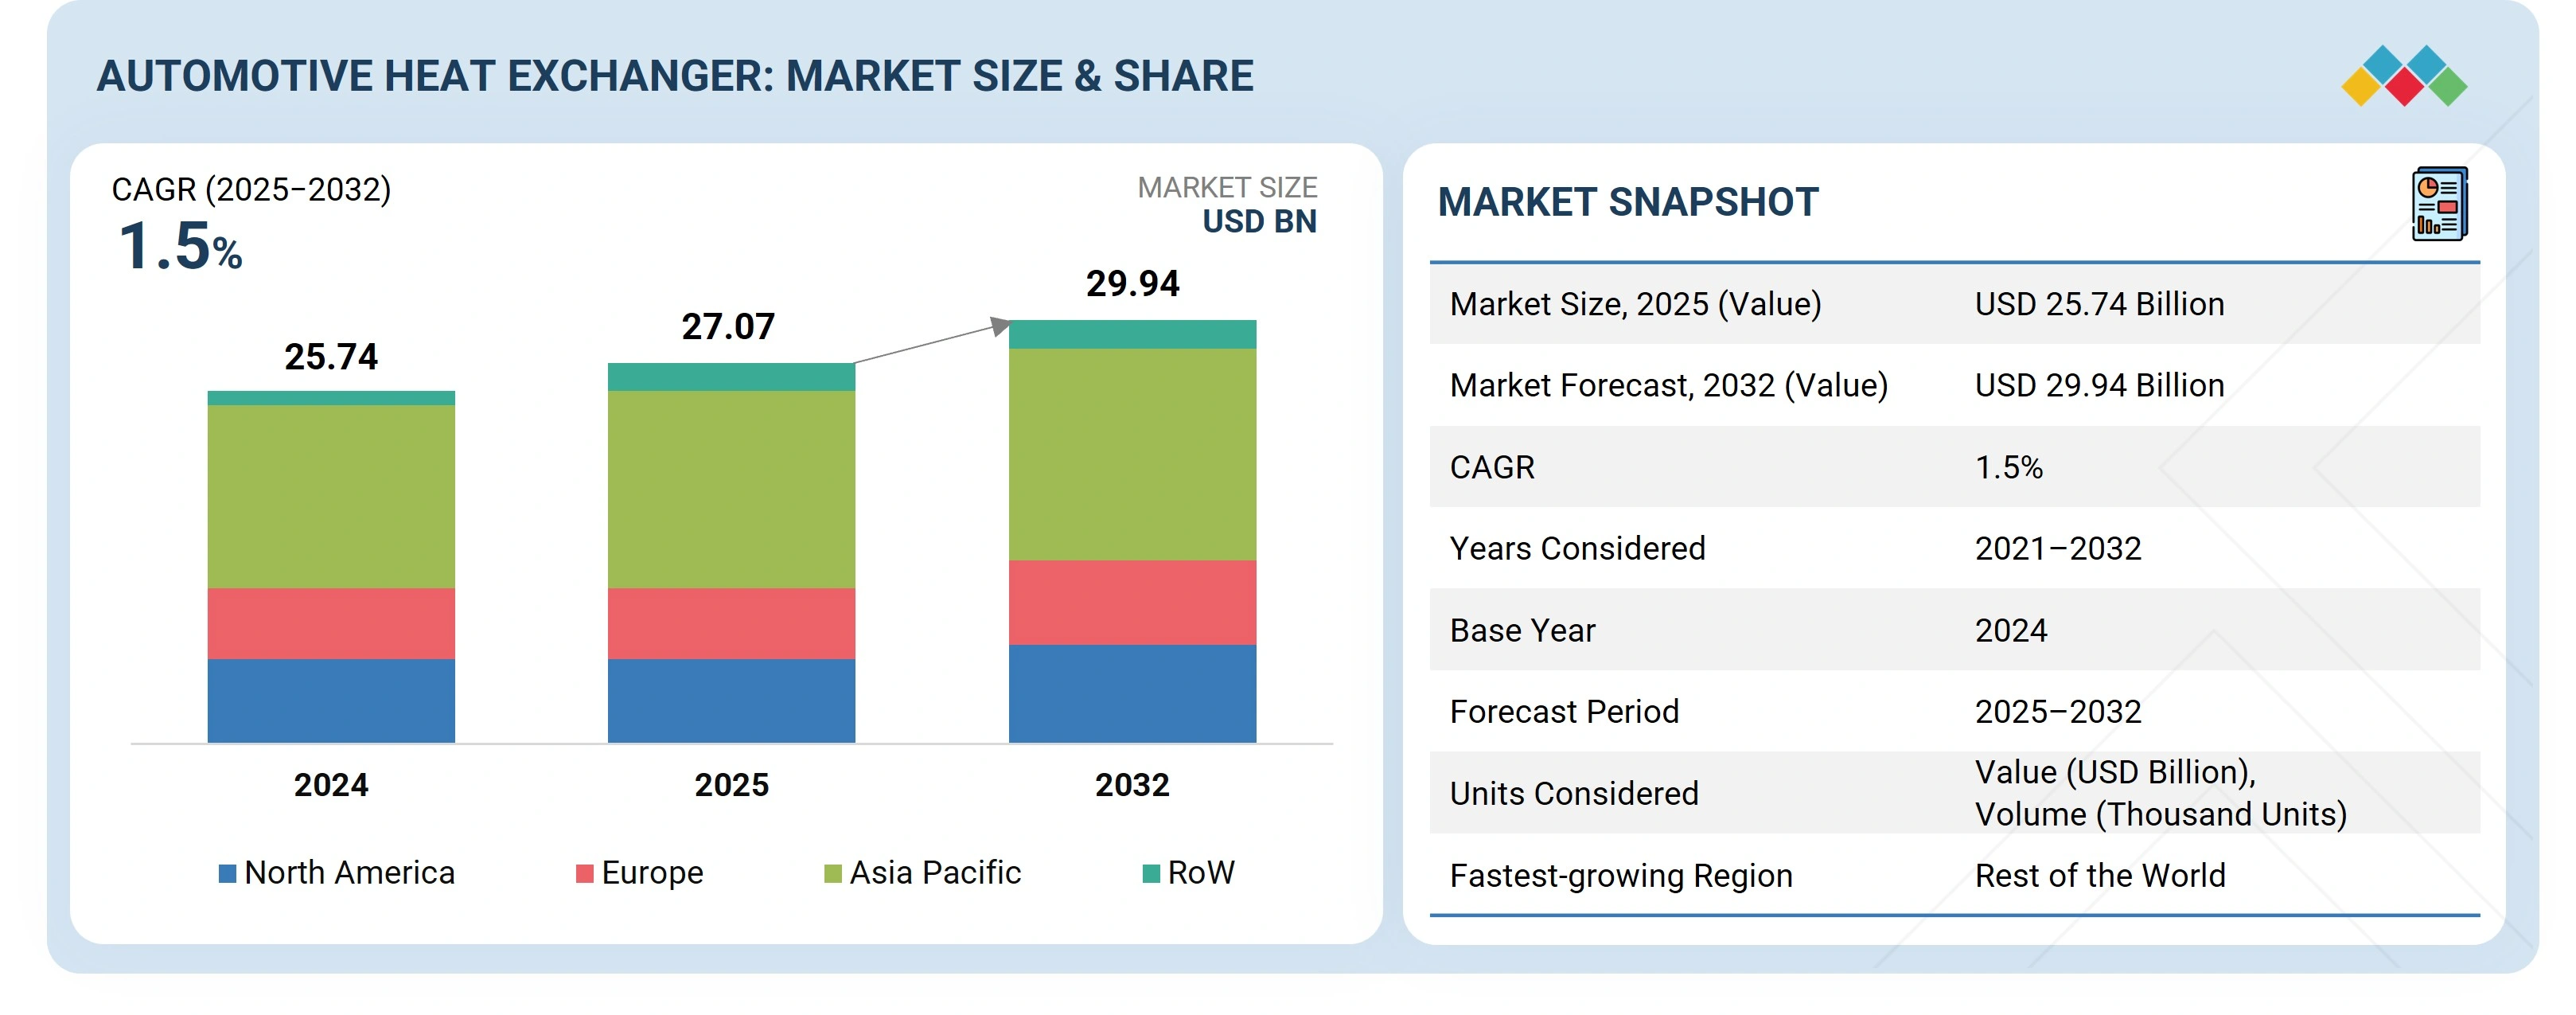
The Automotive Heat Exchanger market is projected to reach USD 29.94 billion by 2032, from USD 27.07 billion in 2025, at a CAGR of 1.5% during the forecast period. Automotive heat exchangers will adopt advanced materials such as nano-engineered composites and high-entropy alloys to handle extreme thermal loads and enhance durability. Designs are evolving toward bio-inspired and lattice-based geometries, driven by AI-enabled optimization and additive manufacturing, to enhance surface area utilization while minimizing pressure drop. Multi-functional exchangers capable of cooling multiple systems simultaneously will improve space and energy efficiency. Integration of sensors and intelligent controls will enable real-time thermal management, ensuring compliance to meet efficiency and emission standards.
Market Size and Forecast:
- Market Size Value in 2025: USD 27.07 Billion
- Revenue Forecast in 2032: USD 29.94 Billion
- Growth Rate: CAGR of 1.5% from 2025 to 2032
- Data available from 2021 to 2032
- Base year: 2024
- Forecast period: 2025–2032
Key Market Trends and Insights
- Market Growth: Growth is driven by rising vehicle production, increasing adoption of turbocharged and high-performance engines, and stringent fuel-efficiency and emission regulations requiring advanced thermal management solutions.
-
Technology Impact: Advancements in nano-engineered materials, AI-optimized heat exchanger designs, additive manufacturing, and intelligent thermal management systems are improving efficiency, durability, and heat transfer performance.
- Growing Trends: The market is witnessing increased adoption of lightweight aluminum heat exchangers, integrated thermal management systems, battery cooling technologies for electric vehicles, microchannel heat exchangers, and multifunctional cooling solutions.
- Growth Opportunities: Opportunities are driven by rapid vehicle electrification, expanding EV production, growing demand for battery thermal management systems, and the development of compact, high-efficiency heat exchangers for next-generation mobility platforms.
KEY TAKEAWAYS
-
BY VEHICLE TYPEThe vehicle types studied include passenger cars (PCs), light commercial vehicles (LCVs), trucks, and buses. The passenger cars segment is set to lead the automotive heat exchanger market, driven by sustained ICE production, greater use of turbocharged engines, and stricter emission norms requiring lightweight, compact, and efficient cooling solutions.
-
BY ELECTRIC VEHICLE TYPEThe main electric vehicle types are battery electric vehicles (BEVs), hybrid electric vehicles (HEVs), and plug-in hybrid electric vehicles (PHEVs). The growing adoption of HEVs and advancements in lightweight and high-performance materials are expected to drive innovation in the heat exchanger market, improving efficiency, durability, and overall vehicle performance.
-
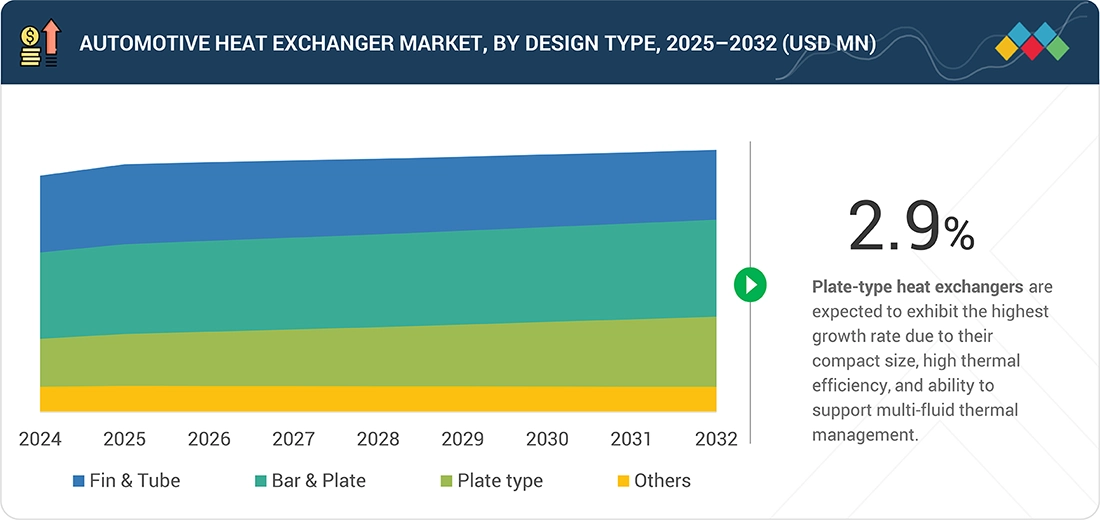
BY DESIGNBy design, heat exchangers are segmented into fin & tube, bar & plate, plate type, and others. Plate-type heat exchangers are set to grow the fastest due to their compact size, high efficiency, and suitability for EVs and hybrids requiring precise thermal control of batteries, inverters, and power electronics. Advances in brazing and sealing have improved durability and cost-effectiveness, driving adoption.
-
BY OFF-HIGHWAY VEHICLE TYPEOff-highway vehicles can be agricultural equipment and construction equipment. The demand for construction equipment and tractors is driven by heavy-duty operation, high engine loads, and harsh environments, requiring rugged, high-capacity, and corrosion-resistant heat exchangers. Growth is supported by infrastructure investment and agricultural mechanization, with strategic opportunities in modular, multi-functional thermal systems for both ICE and electrified off highway equipment.
-
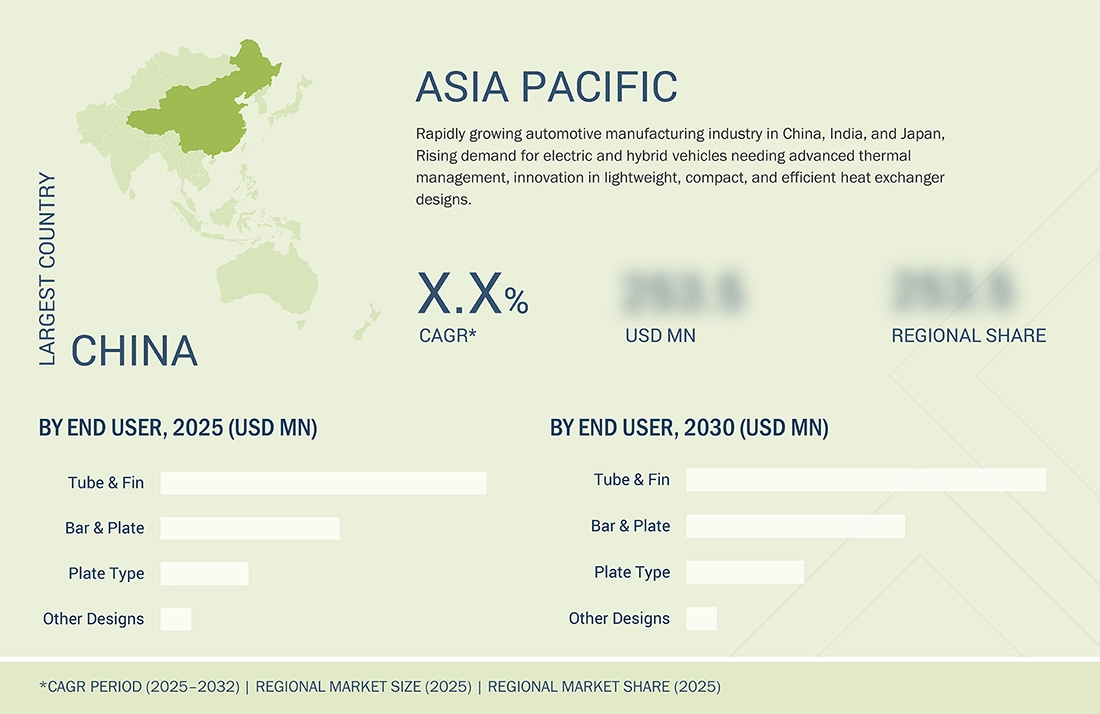
BY REGIONThe main regions covered are Asia Pacific, Europe, North America, and the Rest of the World. Asia Pacific is estimated as the largest market for automotive heat exchangers, driven by rapid EV adoption, government incentives, expanding local manufacturing, rising disposable incomes, and the development of advanced EV architectures in countries such as China, Japan, and India.
-
COMPETITIVE LANDSCAPEKey players such as MAHLE GmbH (Germany), Denso Corporation (Japan), Valeo (France), Hanon Systems (South Korea), and T.RAD Co., Ltd. (Japan) are focusing on innovations in various components of heat exchangers, both for ICE and EVs. Strategies include R&D investments, strategic partnerships, product diversification, and integration of modular, scalable solutions to meet the evolving demands of EV powertrains, battery management, and engines.
The rising vehicle production, increasing use of high-power engines such as turbocharged engines, and stricter fuel-efficiency regulations are driving the demand for compact and high-performance heat exchangers. These systems help improve thermal efficiency and reduce energy loss. As turbocharged engines, multi-speed transmissions, and hybrid powertrains become more common, the amount of heat generated in vehicles increases. This has led to the adoption of advanced heat exchanger designs, such as microchannel and brazed aluminum types, which offer better heat transfer in a smaller size.
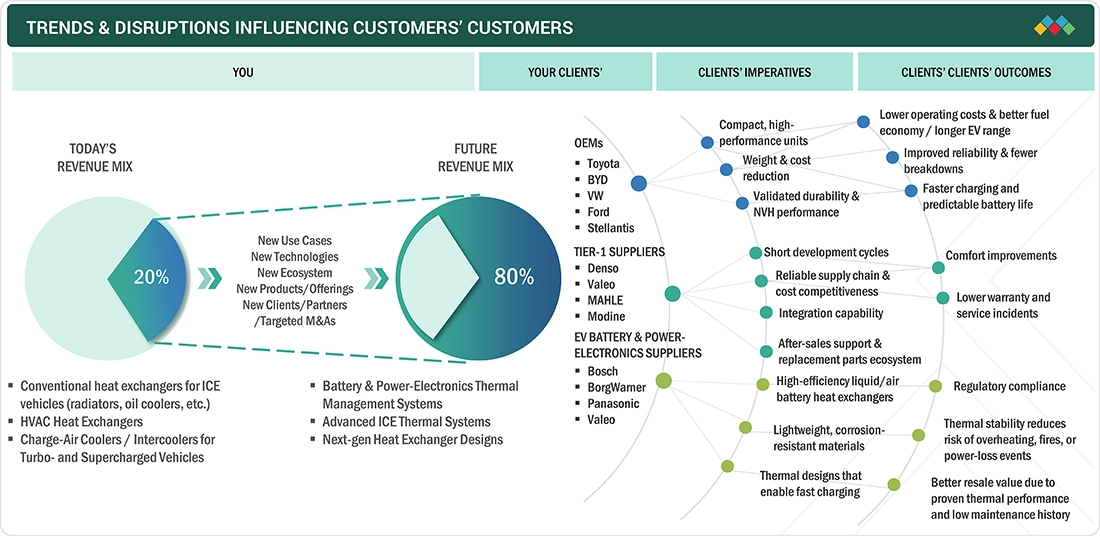
TRENDS & DISRUPTIONS IMPACTING CUSTOMERS' CUSTOMERS
The current revenue mix is dominated by heat exchangers and AC cores for ICE vehicles, but it is shifting toward EV thermal systems for batteries, motors, and power electronics, alongside HVAC heat pumps serving both ICE and EVs. Near-term growth will come from advanced components like battery thermal modules, multi-circuit radiators, and heat pump evaporators, while longer-term opportunities lie in fuel cell heat exchangers, waste-heat recovery, thermal storage, integrated e-axle cooling, and digital thermal management.
Source: Secondary Research, Interviews with Experts, MarketsandMarkets Analysis
MARKET DYNAMICS
Level
-
Increased cooling needs in high-performance and large-battery vehicles

-
Technological advancements in materials and design

Level
-
Decline in sales of ICE vehicles

Level
-
Innovations in microchannel and lattice heat exchanger designs

-
Development of advanced nanoparticle-based coolants

Level
-
Material compatibility and corrosion issues

-
Flow and distribution challenges with nanofluids

Source: Secondary Research, Interviews with Experts, MarketsandMarkets Analysis
Driver: Increased cooling needs in high-performance and large-battery vehicles
Rising EV power and charging speeds are driving advanced thermal management, with innovations like microchannel liquid cooling, multi-channel cold plates, immersion cooling, and nanocomposite coatings becoming essential for performance, safety, and fast charging. The Tesla Model S Plaid and the Semi truck highlight redesigned battery modules with improved heat removal capabilities, including features like dual-pass liquid-cooling tubes and large liquid-cooling setups.
Restraint: Decline in sales of ICE vehicles
Stricter emission norms and EV incentives are reducing demand for conventional ICE cooling systems such as radiators, oil coolers, and EGR coolers. The EU plans to phase out new ICE vehicle sales by 2035, and automakers like GM, Nissan, and Volvo aim to go fully electric within a decade. EVs require fewer and more compact thermal management systems, such as Tesla’s integrated “octovalve” and EV-specific solutions from MAHLE and Modine, including battery chillers and electric drive cooling systems, replacing traditional heat exchanger designs.
Opportunity: Innovations in microchannel and lattice heat exchanger designs
Microchannel heat exchangers with sub-1 mm channels enhance heat transfer, reduce refrigerant use, and lower pressure drops, making them popular in EV cooling systems like Tesla and BYD models. Lattice-structured exchangers produced via 3D printing maximize surface area, reducing pressure drop by up to 82% and weight by up to 40%, as demonstrated by Conflux Technology. Such innovations are gaining adoption in high-performance vehicles like Bugatti. These innovations enable smaller, lighter, and more efficient thermal systems for next-generation powertrains.
Challenge: Material compatibility and corrosion issues
Heat exchangers face corrosion risks from mixed materials and new cooling fluids, especially in hybrid and EV systems. Advanced solutions include nano-ceramic coatings, epoxy-zinc primers, corrosion-resistant alloys, and predictive simulations. Companies like MAHLE and Denso are enhancing durability through improved surface treatments, yet ensuring long-term reliability remains a key challenge as thermal systems grow more complex.
Automotive Heat Exchanger: COMMERCIAL USE CASES ACROSS INDUSTRIES
| COMPANY | USE CASE DESCRIPTION | BENEFITS |
|---|---|---|
 |
Supply high-performance polymers, coatings, and thermal interface materials used in heat exchanger manufacturing to improve durability, corrosion resistance, and thermal conductivity | Enables lightweight construction, extended lifecycle, and improved efficiency of heat exchangers under harsh thermal and chemical environments |
 |
Manufacture radiators, condensers, evaporators, EGR coolers, and battery cooling plates with precision brazing and advanced micro-channel designs | Provides high heat transfer efficiency, compact packaging for modern vehicles, and compliance with emission and fuel efficiency standards |
 |
Develop integrated thermal management modules for ICE, hybrid, and EV platforms, including battery thermal systems and cabin HVAC | Enhances vehicle performance, reduces emissions, and ensures thermal safety of batteries and power electronics in EVs |
 |
Integrate advanced heat exchangers into vehicle platforms to support combustion efficiency, lightweighting, and EV thermal management | Improves fuel economy in ICE vehicles, extends battery life in EVs, and ensures compliance with regulatory emission and safety standards |
Logos and trademarks shown above are the property of their respective owners. Their use here is for informational and illustrative purposes only.
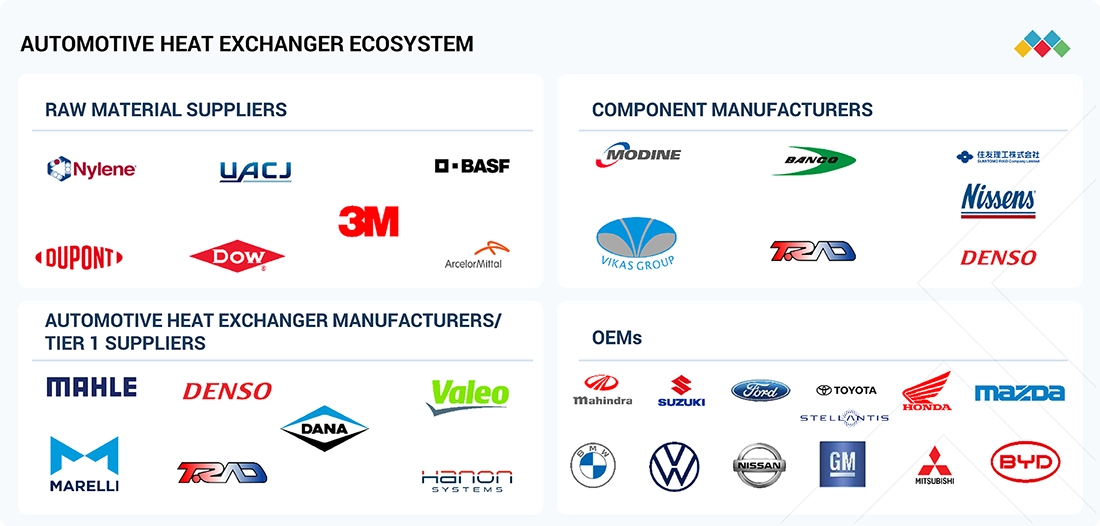
MARKET ECOSYSTEM
The ecosystem mapping highlights various players in the automotive heat exchanger market, mainly including raw material suppliers, Automotive heat exchanger manufacturers & distributors, and automotive OEMs. The leading players in the automotive heat exchanger market are Mahle GmbH (Germany), Denso Corporation (Japan), Valeo (France), Hanon Systems (South Korea), and T.RAD Co., Ltd. (Japan), among others, who offer advanced automotive heat exchanger solutions that improve thermal efficiency, support the performance of modern powertrains, and comply with evolving regulatory and industry requirements.
Logos and trademarks shown above are the property of their respective owners. Their use here is for informational and illustrative purposes only.
MARKET SEGMENTS
Source: Secondary Research, Interviews with Experts, MarketsandMarkets Analysis
Automotive Heat Exchanger Market, by Off-Highway Vehicle Type
Construction equipment is projected to lead the automotive heat exchanger market due to heavy-duty operations, higher engine capacities, and greater cooling needs for engines, transmissions, and hydraulics. Infrastructure expansion in roads, rail, housing, and water projects, particularly under China’s 14th Five-Year Plan, is driving sustained demand for excavators, loaders, and pavers. Manufacturers are likely to invest in increasing production. For instance, JCB is investing USD 500 million in expanding its US manufacturing facility. Modine, MAHLE, Denso, T.RAD, and others are key providers of rugged, high-capacity heat exchangers for this segment.
Automotive Heat Exchanger Market, by Design
Plate-type heat exchangers are projected to grow fastest due to their compact design, high thermal efficiency, and suitability for EVs and hybrids requiring precise thermal control of batteries, inverters, and power electronics. Advances in brazing have improved durability and cost-effectiveness, driving wider adoption. Key players include Marelli, MAHLE, Dana, ESTRA, and Banco Products. In April 2025, MAHLE showcased an EV demo vehicle with advanced thermal solutions, including a bionic battery cooling plate and liquid–liquid heat exchanger at Auto Shanghai.
Automotive Heat Exchanger Market, by Electric Vehicle Type
Battery electric vehicles (BEVs) hold the largest share of the automotive heat exchanger market due to the extensive thermal management needs of large battery packs, power electronics, and drivetrains. The shift is driven by emission norms, incentives, and advances in battery technology, with rising demand for fast charging, extended battery life, and efficiency. Mahle Anand Thermal supplied a battery thermal management system and chiller for Mahindra’s 2025 BE 6. BEVs increasingly adopt lightweight aluminum-based exchangers, with suppliers like MAHLE and Modine advancing aluminum-polymer composites, high-strength alloys, and compact designs such as stacked plates and multi-channel structures.
Automotive Heat Exchanger Market, by Vehicle Type
Passenger cars are estimated to lead the automotive heat exchanger market, supported by sustained ICE production and the growing use of thermally intensive technologies like turbocharging and EGR, which require air coolers, oil coolers, and radiators. Electrification, stricter emission norms, and fuel-efficiency needs further drive demand for advanced, lightweight, and compact exchangers. Key suppliers in the automotive heat exchanger market include MAHLE, Denso, Valeo, Hanon Systems, and T.RAD. These companies are developing various components. MAHLE is supplying compact oil coolers for the upcoming Audi A5 (2025), strengthening its position in premium passenger cars, while T.RAD continues to anchor its presence in the small car segment with radiator supplies for Daihatsu Rocky and Thor models.
REGION
Asia Pacific is expected to be the largest region in the global Automotive heat exchanger market during the forecast period.
The Asia Pacific region is projected to lead the automotive heat exchanger market, driven by strong vehicle production, government support, and cost advantages for OEMs. With a large consumer base, extensive vehicle production, and strong economic growth, Asia Pacific remains an attractive market for automotive OEMs and component suppliers. Rapid electrification and stringent emission norms such as China VI and Bharat VI are pushing the adoption of high-efficiency radiators and charge-air coolers. In February 2024, Danfoss (India) unveiled Microchannel Heat Exchanger (MCHE) technology at the ACREX India 2024 exhibition. This innovation aims to enhance HVAC system efficiency and reduce refrigerant consumption. Robust commercial vehicle demand in Southeast Asia and India, spurred by booming e-commerce logistics, has expanded aftermarket opportunities for heavy-duty oil and transmission coolers. Automotive heat exchanger manufacturers such as Denso Corporation (Japan), Marelli Holdings Co., Ltd. (Japan), Hanon Systems (South Korea), T.RAD Co., Ltd. (Japan), Sanden Corporation (Japan), and ESTRA (South Korea), among others, have a dominant presence in the Asia Pacific. All the above-mentioned factors are expected to drive the demand for automotive heat exchangers in Asia Pacific.
Automotive Heat Exchanger: COMPANY EVALUATION MATRIX
In the automotive heat exchanger market matrix, Mahle (Star) leads with a strong market presence and a wide product portfolio, enabling large-scale adoption across ICE and EVs. Dana Ltd. (Emerging Leader) is gaining traction with advanced automotive heat exchanger solutions, supporting diverse vehicle architectures and high-reliability applications.

Source: Secondary Research, Interviews with Experts, MarketsandMarkets Analysis
KEY MARKET PLAYERS
MARKET SCOPE
| REPORT METRIC | DETAILS |
|---|---|
| Market Size, 2024 (Value) | 25.74 Billion |
| Market Forecast, 2032 (Value) | 29.94 Billion |
| Growth Rate | CAGR of 1.5% from 2025 to 2032 |
| Years Considered | 2021–2032 |
| Base year | 2024 |
| Forecast period | 2025–2032 |
| Units considered | Value (USD Billion), Volume (Thousand Units) |
| Report Coverage | Revenue Forecast, Company Ranking, Competitive Landscape, Growth Factors, Trends |
| Segments Covered |
|
| Regional Scope | Asia Pacific, Europe, North America, Rest of the World |
WHAT IS IN IT FOR YOU: Automotive Heat Exchanger REPORT CONTENT GUIDE
DELIVERED CUSTOMIZATIONS
We have successfully delivered the following deep-dive customizations:
| CLIENT REQUEST | CUSTOMIZATION DELIVERED | VALUE ADDS |
|---|---|---|
| Granular insights on the shift from ICE to EV-specific heat exchangers | Segmented analysis of conventional vs. EV thermal systems (radiators, oil/EGR coolers vs. battery chillers, e-drive cooling, compact multifunctional exchangers) | Clear view of declining ICE demand and emerging EV-focused opportunities |
| Understand demand outlook for key heat exchanger products (radiators, oil/EGR coolers, condensers, battery chillers, cold plates, e-drive cooling systems) | Segmented analysis showing decline in ICE-dependent products (radiators, oil/EGR coolers) vs. growth in EV-specific solutions (battery chillers, cold plates, multi-functional exchangers, immersion cooling) | Enables clear product-level strategy, R&D focus, and portfolio realignment |
| Impact of stricter emission norms and OEM electrification on heat exchanger demand | Forecasts on revenue mix shift: ICE-heavy EV-focused thermal systems in future (e.g., Tesla Octovalve, CATL’s liquid microchannel plates, Modine’s battery chillers) | Helps align the client’s investment priorities with the long-term EV adoption curve |
RECENT DEVELOPMENTS
- March 2025 : Marelli Holdings Co., Ltd. (Japan) signed a strategic cooperation agreement with Hilite Automotive Systems (Changshu) Co., Ltd. at its Wuxi facility to work together on thermal management solutions for New Energy Vehicles (NEVs). The partnership would focus on developing integrated NEV thermal management modules, electronic expansion valves, and related technologies. By combining Marelli’s expertise in thermal systems with Hilite’s strengths in coolant and refrigeration valve technology, the two companies aim to create more competitive thermal management solutions.
- January 2025 : Valeo (France) supplied Renault 5 E-Tech electric with a high-voltage coolant heater, radiator, and electric oil pump for eAxle lubrication and cooling.
- January 2025 : Mahle GmbH (Germany) showcased a next-generation refrigerant thermal management module and the MAHLE e-compressor at CES 2025. The thermal management module featured a compact, "plug and play" design for easy vehicle installation. It helps reduce charging time and extends the battery driving range.
- January 2025 : Denso Corporation (Japan) showcased a water-cooled condenser/chiller and electric compressor at Bharat Mobility Global Expo 2025.
Table of Contents
 Exclusive indicates content/data unique to MarketsandMarkets and not available with any competitors.
Methodology
The study encompasses four primary tasks to determine the present and future scope of the automotive heat exchanger market. Initially, extensive secondary research has been conducted to gather data on the market, its related sectors, and overarching industries. Subsequently, primary research involving industry experts across the value chain corroborated and validated these findings and assumptions. The complete market size has been estimated by using both top-down and bottom-up methodology. Following this, a market breakdown and data triangulation approach were utilized to determine the size of specific segments and subsegments within the market.
Secondary Research
In the secondary research process, various secondary sources such as company annual reports/presentations, press releases, industry association publications [for instance, International Organization of Motor Vehicle Manufacturers (OICA), National Highway Traffic Safety Administration (NHTSA), International Energy Association (IEA)], articles, directories, technical handbooks, trade websites, technical articles, and databases (for instance, MarkLines and Factiva) have been used to identify and collect information useful for an extensive commercial study of the global automotive heat exchanger market.
Primary Research
In the primary research process, various primary sources from both the supply and demand sides have been interviewed to obtain qualitative and quantitative information on the market. The primary sources from the supply side included various industry experts, such as CXOs, vice presidents, directors from business development, marketing, product development/innovation teams, and related key executives from various key companies. Various system integrators, industry associations, independent consultants/industry veterans, and key opinion leaders were also interviewed.
Primary interviews have been conducted to gather insights such as sizing estimates on the automotive heat exchanger market and forecast, future technology trends, and upcoming technologies in the automotive heat exchanger market. Data triangulation of all these points has been done using the information gathered from secondary research and model mapping. Stakeholders from the demand and supply sides have been interviewed to understand their views on the abovementioned points.

Note 1: Others include sales managers, marketing managers, and product managers.
Note 2: Tier 1 companies’ revenues are more than USD 10 billion; tier 2 companies’ revenues range between USD 1 and 10 billion; and tier 3 companies’ revenues range between USD 500 million and USD 1 billion.
Source: Industry Experts
To know about the assumptions considered for the study, download the pdf brochure
Market Size Estimation
Both top-down and bottom-up approaches have been used to estimate and validate the total size of the automotive heat exchanger market. These methods have also been used extensively to estimate the size of various subsegments in the market. The research methodology used to estimate the market size includes the following:
Automotive Heat Exchanger Market : Top-Down and Bottom-Up Approach

Data Triangulation
After arriving at the overall market size, using the market size estimation processes as explained above, the market has been split into several segments and subsegments. To complete the overall market engineering process and arrive at the exact statistics of each market segment and subsegment, data triangulation and market breakdown procedures have been employed, wherever applicable. The data has been triangulated by studying various factors and trends from both the demand and supply sides.
Market Definition
Automotive heat exchangers are components used to transfer heat between fluids, such as coolants, oil, or refrigerants, to regulate temperatures in various vehicle systems. They play a critical role in engine cooling, air conditioning, battery thermal management, and power electronics in ICE and electric vehicles.
Stakeholders
- Automotive component manufacturers
- Associations, forums, and alliances related to automobiles
- Automotive original equipment manufacturers
- Automotive investors
- Raw material suppliers for automotive heat exchangers
- Automotive heat exchanger manufacturers
- Government agencies and policymakers
- Traders and distributors of automotive heat exchangers
Report Objectives
-
To define, segment, and forecast the size of the automotive heat exchanger market in terms of value (USD million) and volume (thousand units) from 2025 to 2032, based on
- Propulsion type (ICE and EV)
- Design (bar and plate, tube and fin, plate type, and others)
- Off-highway vehicle type (agricultural equipment and construction equipment)
- Vehicle type (passenger car, light commercial vehicle, truck, and bus)
- Electric vehicle type (BEV, PHEV, and HEV)
- Component (Radiator, condenser, evaporator, oil cooler (transmission & engine oil), heater, charge air cooler, exhaust gas recovery, battery cooling system, chiller, and water-cooled condenser)
- Region (Asia Pacific, Europe, North America, and the Rest of the World)
- To identify and analyze key drivers, restraints, opportunities, and challenges influencing market growth
- To strategically analyze the market for individual growth trends, prospects, and contributions to the total market
-
To study the following with respect to the market
- Supply Chain Analysis
- Ecosystem Analysis
- Technology Analysis
- Trade Analysis
- Pricing Analysis
- Case Study Analysis
- Patent Analysis
- Regulatory Framework
- Key Stakeholders and Buying Criteria
- Key Conferences and Events
- MNM Insights on Advancements in Heat Exchangers
- Future of Automotive Heat Exchangers for Alternative Fuel Technologies
- Key OEM Refrigerant Trend, By Region
- Supplier Analysis
- MNM Insights on Future Heat Exchanger Products
- To strategically profile key players and comprehensively analyze their market share and core competencies
- To analyze the opportunities for stakeholders and the competitive landscape for market leaders
- To track and analyze competitive developments such as deals (collaboration, agreement, and acquisition), product launches/developments, expansions, and other activities undertaken by the key industry participants
Available Customizations
With the given market data, MarketsandMarkets offers customizations in accordance with company-specific needs.
AUTOMOTIVE HEAT EXCHANGER MARKET BY EV TYPE, AT COUNTRY LEVEL
AUTOMOTIVE HEAT EXCHANGER MARKET BY COMPONENT TYPE, AT COUNTRY LEVEL
COMPANY INFORMATION
- Profiling of additional market players (up to five)
Key Questions Addressed by the Report
What is the current market size of the Automotive Heat Exchanger Market, and how is it expected to grow?
The Automotive Heat Exchanger Market is projected to grow from USD 27.07 billion in 2025 to USD 29.94 billion by 2032, at a CAGR of 1.5% during the forecast period.
What are the key factors driving the growth of the Automotive Heat Exchanger Market?
The market is driven by increasing vehicle production, growing demand for advanced thermal management systems, stricter emission regulations, and the rising adoption of electric and hybrid vehicles.
Which region is expected to dominate the Automotive Heat Exchanger Market during the forecast period?
Asia Pacific is expected to dominate the Automotive Heat Exchanger Market due to strong automotive manufacturing, rapid vehicle electrification, and stringent emission norms.
What are the latest trends shaping the Automotive Heat Exchanger Market?
Key trends include advanced battery cooling systems, AI-optimized heat exchanger designs, lightweight materials, multi-functional heat exchangers, and smart thermal management solutions.
Who are the leading companies in the Automotive Heat Exchanger Market, and what strategies are they adopting?
Leading companies are focusing on advanced thermal management technologies, lightweight heat exchanger designs, strategic partnerships, and expanding their product portfolios to support next-generation ICE and electric vehicles.
Need a Tailored Report?
Customize this report to your needs
Get 10% FREE Customization
Customize This ReportPersonalize This Research
- Triangulate with your Own Data
- Get Data as per your Format and Definition
- Gain a Deeper Dive on a Specific Application, Geography, Customer or Competitor
- Any level of Personalization
Let Us Help You
- What are the Known and Unknown Adjacencies Impacting the Automotive Heat Exchanger Market
- What will your New Revenue Sources be?
- Who will be your Top Customer; what will make them switch?
- Defend your Market Share or Win Competitors
- Get a Scorecard for Target Partners

Custom Market Research Services
We Will Customise The Research For You, In Case The Report Listed Above Does Not Meet With Your Requirements
Get 10% Free CustomisationTESTIMONIALS

JIM NAAS
PRODUCT DIRECTOR, WEASLER
Weasler Engineering, a CentroMotion organization
Global Provider of Industrial Actuation & Control Solutionswww.weasler.com
Our organization was interested in learning more about the attractiveness of a particular market space. We contacted MarketsandMarkets to help us based on previous positive experiences we had with them. The results did not disappoint! We discussed our objectives with them, and the team at MarketsandMarkets developed and executed a proposal that met our needs precisely. We were very impressed by their level of expertise, the quality of the analysis and their insightful recommendations. We would not hesitate in working with them again in the future.

Matt Kardel,
Vice President
Aptiv,
A global technology company that develops safer, greener and more connected solutions.www.aptiv.com
We contracted with
MarketsandMarkets to evaluate the value chain and potential go-to-market partners related to our
interest in the Fleet Management space. The team successfully completed the work on time and at the
pricing agreed. MarketsandMarkets listened and understood our objectives and collaborated well with
us to help us get the visibility we needed to make an investment.
We have subsequently used
MarketsandMarkets again related to Smart Cities to good results.


Growth opportunities and latent adjacency in Automotive Heat Exchanger Market