High Performance Alloys Market by Alloy Type (Wrought, Cast), by Product Type (Non-Ferrous Alloys, Refractory Alloys), by Alloying Element (Aluminum, Titanium, Magnesium), by Application (Aerospace, Industrial, Automotive), & Geography - Global Forecast to 2020


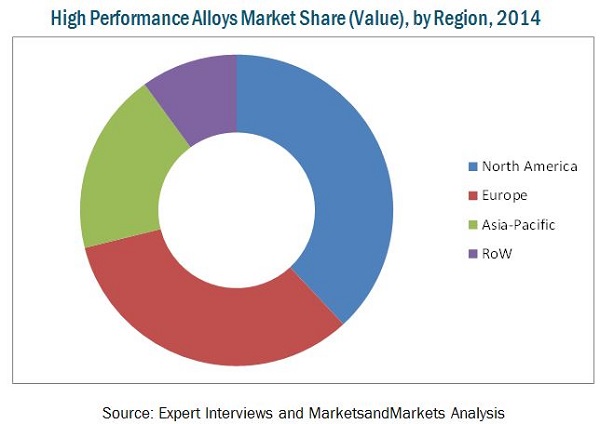
[235 Pages Report] The global market for high performance alloys witnessed rapid growth in 2013, and is projected to grow at a CAGR of 4.34% during the forecast period, that is, from 2015 to 2020, to reach USD 9,698.35 Million by 2020. North America dominated the market with a share of 38% in 2014; this market is driven by increasing competition, demand for value-added products, and technological advancements. The Asia Pacific region is projected to become the fastest-growing market for high performance alloys from 2015 to 2020. Moreover, with increasing awareness about environmental hazards, the market will adopt technologies to develop sustainable manufacturing processes, which are environment-friendly. The Asia-Pacific region accounted for around 19% of the total market share in terms of value. The high performance alloys market in developing countries such as China and India are estimated to grow at a higher rate from 2015 to 2020. China is estimated to grow faster than any other country because of its strong economic growth along with growing demand from the end-user industry and rapid urbanization.
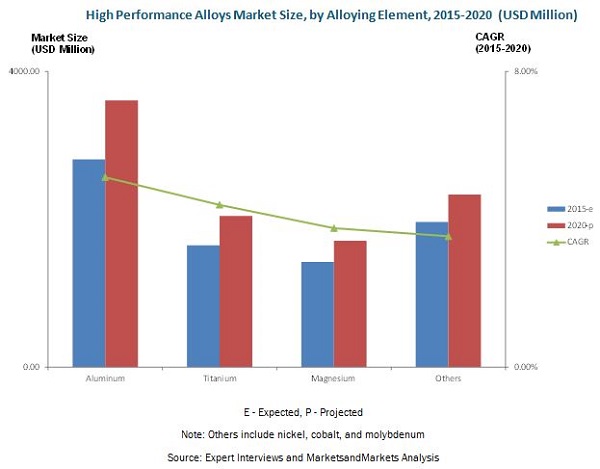
Wrought alloy accounted for the largest share of 63% of the high performance alloys market in 2014. Cast alloy is projected to be the fastest-growing alloy type from 2015 to 2020. Aluminum is projected to be the fastest-growing alloying element during the same period. Titanium as an alloying element will be the second-fastest growing alloying element from 2015 to 2020. Aerospace accounted for the largest share of the high performance alloys market in 2014.
This report estimates the market size of the global high performance alloys market in terms of value (USD million). In this report, the market is segmented based on product type, alloy type, alloying element, application, and region. Market drivers, restraints, challenges, and opportunities are discussed in detail. The global high performance alloys market has grown exponentially in the last few years and this trend is expected to continue.
Scope of the Report
This research study categorizes the global high performance alloys market based on product type, alloy type, alloying element, application, and region:
On the basis of product type, the high performance alloys market has been segmented as follows:
- Non-ferrous alloys
- Refractory alloys
- Others (hastelloy, inconel, waspaloy, rene alloys, haynes alloys, incoloy, MP98T, TMS alloys, CMSX single crystal alloys, platinum alloys)
On the basis of alloy type, the market has been segmented as follows:
- Wrought alloy
- Cast alloy
On the basis of alloying element, the high performance alloys market has been segmented as follows:
- Aluminum
- Titanium
- Magnesium
- Others (nickel, cobalt, molybdenum)
On the basis of application, the high performance alloys market has been segmented as follows:
- Aerospace
- Industrial
- Automotive
- Oil & gas
- Electronics & electrical
- Others (military and marine)
On the basis of region, the high performance alloys market has been segmented as follows:
- North America
- Europe
- Asia-Pacific
- Rest of the World (RoW)
The high performance alloys market has varied applications such as aerospace, industrial, automotive, oil & gas, electronics & electrical, and others. The aerospace segment accounted for around 54% of the global high performance alloys market in 2014. The industrial segment is expected to grow due to increase in demand from emerging economies. The automotive segment is also one of the major end users of the high performance alloys market and is expected to witness considerable growth.
The increase in demand for innovative and sustainable metals that are lightweight, corrosion resistant with good strength has led to the growth of the high performance alloys market. Growing demand for value-added products has resulted in the increase in the demand for high performance alloys. The growing preference for high performance alloys is also due to sustainable and innovative smelting, mining, mineral recovery, and recycling technology that the industry instills in its production methods, which is expected to drive this market.
The market for high performance alloys is observed to be ever increasing in developing economies such as the Asia-Pacific region. The reason behind this is the increased industrialization and improved standard of living in this region. The Asia-Pacific market for high performance alloys is projected to grow at the highest CAGR of 5.15% during the forecast period, in terms of value. It accounted for a market share of 19% in 2014. The North American region accounted for the largest market share for high performance alloys from 2015 to 2020. The global market for high performance alloys is projected to grow at a CAGR of 4.34% from 2015 to 2020 and is projected to reach USD 9,698.35 Million by 2020.
The high performance alloys market will be driven by the demand from the end-user industry and technological advancements. The development of economies plays an essential role in fueling the demand for high performance alloys in the global market. The key parameters that determine the growth of the high performance alloys in developing economies are increase in consumption and demand for value-added and sustainable products.
The high performance alloys market is dominated by several large players such as Aperam SA (Luxembourg), Alcoa Inc. (U.S.), Allegheny Technologies Incorporated (U.S.), Carpenter Technology (U.S.), Haynes International Inc. (U.S.), Hitachi Metals Ltd. (Japan), Outokumpu (Finland), Precision Castparts Corporation (U.S.), Timken Company (U.S.), and VSMPO-AVISMA Corporation (Russia).
 Exclusive indicates content/data unique to MarketsandMarkets and not available with any competitors.
Table of Contents
1 Introduction (Page No. - 24)
1.1 Objectives of the Study
1.2 Market Definition
1.3 Study Scope
1.3.1 Geographic Scope
1.3.2 Periodization Considered for This Study
1.4 Currency Considered
1.5 Unit Considered for the Study
1.6 Stakeholders
2 Research Methodology (Page No. - 27)
2.1 Research Data
2.1.1 Secondary Data
2.1.1.1 Key Data From Secondary Sources
2.1.2 Primary Data
2.1.2.1 Key Data From Primary Sources
2.1.2.2 Key Industry Insights
2.1.2.2.1 Breakdown of Primaries: By Company Type, Designation & Region
2.2 Factor Analysis
2.2.1 Introduction
2.2.2 Overview of the Parent Industry
2.2.3 Demand-Side Analysis
2.2.3.1 Rising Population
2.2.3.1.1 Increase in Middle-Class Population, 2009�2030
2.2.3.2 Increasing Urban Population
2.2.3.3 Developing Economies, GDP (Purchasing Power Parity), 2013
2.2.4 Supply-Side Analysis
2.2.4.1 Fluctuation in Raw Material Prices
2.2.4.2 Increasing Investment in Research & Development to Develop New and Innovative Technologies
2.3 Market Size Estimation
2.4 Market Breakdown & Data Triangulation
2.5 Research Assumptions
2.6 Limitations
3 Executive Summary (Page No. - 41)
3.1 Demand From End-User Markets to Drive High Performance Alloys Market
3.2 Evolution of High Performance Alloys
3.3 High Performance Alloys Market
3.4 Wrought Alloy is Widely Used Across the High Performance Alloys Industry
3.5 Asia-Pacific Market Projected to Grow at the Highest Rate Between 2015 & 2020
3.6 Leading Market Players Adopted Investments & Expansions as the Key Strategy
4 Premium Insights (Page No. - 46)
4.1 Attractive Opportunities in the High Performance Alloys Market
4.2 China is Estimated to Capture the Largest Share in the Asia-Pacific High Performance Alloys Market in 2015
4.3 Asia-Pacific Estimated to Dominate the High Performance Alloys Market in 2015, in Terms of Value
4.4 High Performance Alloys Market, By Application, 2015 vs. 2020
4.5 High Performance Alloys Market: Developed vs. Emerging Markets
4.6 Aluminum Market to Grow at the Highest Rate From 2015 to 2020
4.7 High Performance Alloys Market Life Cycle Analysis, By Region, 2014
5 Market Overview (Page No. - 52)
5.1 Introduction
5.2 Evolution of High Performance Alloys Market
5.3 Market Segmentation
5.3.1 High Performance Alloys Market, By Alloy Type
5.3.2 High Performance Alloys Market, By Product Type
5.3.3 High Performance Alloys Market, By Application
5.3.4 High Performance Alloys Market, By Alloying Element
5.4 Market Dynamics
5.4.1 Drivers
5.4.1.1 Growing Demand From End-User Industry
5.4.1.2 Technological Advancements in the High Performance Alloys Industry
5.4.2 Restraints
5.4.2.1 High Initial Capital Investment Required
5.4.3 Opportunities
5.4.3.1 Demand for High Performance Alloys in Emerging Economies
5.4.4 Challenges
5.4.4.1 Reducing Greenhouse Gas Emissions
5.4.4.2 Fluctuating Raw Material Prices
5.5 High Performance Alloys Market, Price Analysis, 2014
5.5.1 High Performance Alloys Market, By Region, 2014
5.5.2 High Performance Alloys, By Alloy Type, 2014
5.5.3 High Performance Alloys, By Product Type, 2014
5.5.4 High Performance Alloys, By Application, 2014
5.5.5 High Performance Alloys, By Alloying Element, 2014
6 Industry Trends (Page No. - 63)
6.1 Introduction
6.2 Value Chain Analysis
6.3 Recent Trends
6.4 Porter�s Five Forces Analysis
6.4.1 Threat of New Entrants
6.4.2 Threat of Substitutes
6.4.3 Bargaining Power of Suppliers
6.4.4 Bargaining Power of Buyers
6.4.5 Intensity of Competitive Rivalry
7 High Performance Alloys Market, By Alloy Type (Page No. - 70)
7.1 Introduction
7.2 Wrought Aluminum Alloy
7.2.1 Wrought Alloy: High Performance Alloys Market, By Alloy Type
7.2.1.1 Non-Ferrous Alloys Accounted for the Largest Market Share in Wrought Alloy Segment in 2014
7.3 Cast Aluminum Alloy
7.3.1 Cast Alloy: High Performance Alloys Market, By Alloy Type
7.3.1.1 Refractory Alloys Projected to Grow at Fastest Rate in Cast Alloy Segment
8 High Performance Alloys Market, By Product Type (Page No. - 75)
8.1 Introduction
8.2 Non-Ferrous Alloys
8.2.1 Non-Ferrous Alloys: High Performance Alloys Market, By Application
8.2.1.1 Aerospace Segment to Be the Biggest End User for Non-Ferrous Alloys
8.3 Refractory Alloys
8.3.1 Refractory Alloys: High Performance Alloys Market, By Application
8.3.1.1 Aerospace Segment to Be the Biggest Contributor to the Refractory Alloys Market
8.4 Others
8.4.1 Others: High Performance Alloys Market, By Application
8.4.1.1 Aerospace Segment to Dominate the Others Market
9 High Performance Alloys Market, By Application (Page No. - 82)
9.1 Introduction
9.2 Aerospace
9.3 Industrial
9.4 Automotive
9.5 Oil & Gas
9.6 Electronic & Electrical
9.7 Others
10 High Performance Alloys Market, By Alloying Element (Page No. - 86)
10.1 Introduction
10.2 Aluminum
10.2.1 Aluminum: High Performance Alloys Market, By Application
10.2.1.1 Aerospace Segment to Be the Biggest End-User for Aluminum
10.3 Titanium
10.3.1 Titanium: High Performance Alloys Market, By Application
10.3.1.1 Aerospace Segment to Be the Biggest Contributor to the Titanium Market
10.4 Magnesium
10.4.1 Magnesium: High Performance Alloys Market, By Application
10.5 Others
10.5.1 Others: High Performance Alloys Market, By Application
11 High Performance Alloys Market, By Region (Page No. - 96)
11.1 Introduction
11.2 Geographic Snapshot (2015�2020): Rapidly Growing Markets are Emerging as New Hot Spots
11.3 North America
11.3.1 Regulations in North America
11.3.2 North America: High Performance Alloys Market, By Country
11.3.3 North America: High Performance Alloys Market, By Country
11.3.3.1 U.S. Dominated the High Performance Alloys Market in North America
11.3.4 North America: High Performance Alloys Market, By Product Type
11.3.4.1 Market for Non-Ferrous Alloys Accounted for the Largest Share in High Performance Alloys Market in North America
11.3.5 North America: High Performance Alloys Market, By Alloy Type
11.3.5.1 Market for Wrought Alloy Accounted for the Largest Share in North America
11.3.6 North America: High Performance Alloys Market, By Alloying Element
11.3.6.1 Demand for Titanium as an Alloying Element to Drive the North American Market
11.3.7 North America: High Performance Alloys Market, By Application
11.3.7.1 Aerospace Dominated the North American in this Market
11.3.8 U.S.
11.3.8.1 U.S.: Market, By Product Type
11.3.8.1.1 Refractory Alloys to Grow at the Highest CAGR in the U.S. Market
11.3.8.2 U.S.: Market, By Alloy Type
11.3.8.2.1 Cast Alloy to Grow at the Highest CAGR in the U.S. Market
11.3.8.3 U.S.: Market, By Alloying Element
11.3.8.3.1 Aluminum as an Alloying Element to Grow at the Highest CAGR in the U.S. Market
11.3.9 U.S.: High Performance Alloys Market, By Application
11.3.9.1 Aerospace Segment to Be the Second-Fastest-Growing Market in the U.S.
11.3.10 Canada
11.3.10.1 Canada: Market, By Product Type
11.3.10.1.1 Growing Demand From End-Use Market is Expected to Drive the Market for High Performance Alloys Market in Canada
11.3.10.2 Canada: Market, By Alloy Type
11.3.10.2.1 Wrought Alloy as an Alloy Type has the Largest Market Share in the Canadian Market
11.3.10.3 Canada: Market, By Alloying Element
11.3.10.3.1 Titanium as an Alloying Element is the Second Fastest-Growing Segment in the Canadian Market
11.3.10.4 Canada: Market, By Application
11.3.10.4.1 Aerospace is the Fastest-Growing Segment in the Canadian Market
11.3.11 Mexico
11.3.11.1 Mexico: Market, By Product Type
11.3.11.1.1 Non-Ferrous Alloys Dominated the Mexican Market
11.3.11.2 Mexico: Market, By Alloy Type
11.3.11.2.1 Wrought Alloy Dominated the Mexican High Performance Alloys Market
11.3.11.3 Mexico: Market, By Alloying Element
11.3.11.3.1 Aluminum as an Alloying Element to Be the Fastest-Growing Segment in the Mexican Market
11.3.11.4 Mexico: Market, By Application
11.3.11.4.1 Industrial Segment to Grow at the Second-Highest CAGR in the Mexican Market
11.4 Europe
11.4.1 Regulations in Europe
11.4.2 Europe: Market, By Country
11.4.2.1 Germany Dominated the High Performance Alloys Market in the European Region in 2014
11.4.3 Europe: Market Size, By Product Type
11.4.3.1 The Non-Ferrous Alloys Segment is Estimated to Be the Largest in the European High Performance Market in 2015
11.4.4 Europe: Market Size, By Alloy Type
11.4.4.1 The Wrought Alloy Segment is Estimated to Be the Largest in the European Market in 2015
11.4.5 Europe: Market Size, By Alloying Element
11.4.5.1 Aluminum as an Alloying Element is Projected to Grow at the Highest CAGR From 2015 to 2020
11.4.6 Europe: Market Size, By Application
11.4.6.1 Aerospace Industry to Drive the European High Performance Alloys Market
11.4.7 Germany
11.4.7.1 Germany: High Performance Alloys Market Size, By Product Type
11.4.7.1.1 Non-Ferrous Alloys Projected to Be the Fastest-Growing Segment in Germany
11.4.7.2 Germany: Market Size, By Alloy Type
11.4.7.2.1 Cast Alloy is Projected to Be the Fastest-Growing Segment in Germany
11.4.7.3 Germany: Market Size, By Alloying Element
11.4.7.3.1 Aluminum as an Alloying Element Projected to Witness Growth in Germany�s High Performance Alloys Market
11.4.7.4 Germany: High Performance Alloys Market Size, By Application
11.4.7.4.1 Aerospace to Be the Fastest-Growing Segment in Germany
11.4.8 U.K.
11.4.8.1 U.K.: Market Size, By Product Type
11.4.8.1.1 Non-Ferrous Alloys Accounted for the Largest Share of the High Performance Alloys Market in 2014
11.4.8.2 U.K.: Market Size, By Alloy Type
11.4.8.2.1 Wrought Alloy Accounted for the Largest Share of the High Performance Alloys Market in 2014
11.4.8.3 U.K.: Market Size, By Alloying Element
11.4.8.3.1 Aluminum as an Alloying Element is Projected to Grow at A High Growth Rate in the U.K. Market
11.4.8.4 U.K.: Market Size, By Application
11.4.8.4.1 Aerospace to Be the Fastest-Growing Segment in the U.K.
11.4.9 Russia
11.4.9.1 Russia: High Performance Alloys Market Size, By Product Type
11.4.9.1.1 Non-Ferrous Alloys Dominated the High Performance Alloys Market in Russia
11.4.9.2 Russia: Market Size, By Alloy Type
11.4.9.2.1 Wrought Alloy Dominated the Market in the U.K.
11.4.9.3 Russia: Market Size, By Alloying Element
11.4.9.3.1 Aluminum as an Alloying Element Projected to Grow at the Highest CAGR From 2015 to 2020
11.4.9.4 Russia: Market Size, By Application
11.4.9.4.1 Aerospace Segment Projected to Grow at the Highest Rate
11.4.10 France
11.4.10.1 France: High Performance Alloys Market Size, By Product Type
11.4.10.1.1 Non-Ferrous Alloys Accounted for the Largest Share in France in 2014
11.4.10.2 France: Market Size, By Alloy Type
11.4.10.2.1 Wrought Accounted for the Largest Share in France in 2014
11.4.10.3 France: Market Size, By Alloying Element
11.4.10.3.1 Magnesium as an Alloying Element Projected to Grow at A Comparatively Lower Rate in France
11.4.10.4 France: Market Size, By Application
11.4.10.4.1 Aerospace Segment Projected to Witness the Highest Growth in France
11.4.11 Rest of Europe
11.4.11.1 Rest of Europe: High Performance Alloys Market, By Product Type
11.4.11.2 Rest of Europe: Market, By Alloy Type
11.4.11.3 Rest of Europe: Market, By Alloying Element
11.4.11.4 Rest of Europe: Market, By Application
11.5 Asia-Pacific
11.5.1 Regulations in Asia-Pacific
11.5.2 Asia-Pacific: High Performance Alloys Market, By Country
11.5.2.1 China and Japan Will See Remarkable Growth in the High Performance Alloys Market
11.5.3 Asia-Pacific: Market, By Product Type
11.5.3.1 Non-Ferrous Alloys has the Largest Market Share in Asia-Pacific
11.5.4 Asia-Pacific: Market, By Alloy Type
11.5.4.1 Cast Alloy Projected to Grow at the Highest CAGR in Asia-Pacific
11.5.5 Asia-Pacific: Market, By Alloying Element
11.5.5.1.1 Aluminum as an Alloying Element is Projected to Lead the Market in Asia-Pacific
11.5.6 Asia-Pacific: Market, By Application
11.5.6.1 Aerospace to Be the Fastest-Growing Segment in Asia-Pacific
11.5.7 China
11.5.7.1 China: High Performance Alloys Market, By Product Type
11.5.7.1.1 Refractory Alloys to Be the Fastest-Growing Segment in China
11.5.7.2 China: Market, By Alloy Type
11.5.7.2.1 Cast Alloy to Be the Fastest-Growing Segment in China
11.5.7.3 China: Market, By Alloying Element
11.5.7.3.1 Aluminum as an Alloying Element Dominated the Market in China in 2014
11.5.7.4 China: Market, By Application
11.5.7.4.1 Aerospace Segment Accounted for the Largest Share in China in 2014
11.5.8 Japan
11.5.8.1 Japan: High Performance Alloys Market, By Product Type
11.5.8.1.1 Non-Ferrous Alloys Find Wide Application in Japan
11.5.8.2 Japan: Market, By Alloy Type
11.5.8.2.1 Wrought Alloy Finds Wide Application in Japan
11.5.8.3 Japan: Market, By Alloying Element
11.5.8.3.1 Magnesium as an Alloying Element Accounted for the Second-Largest Share in Japan�s Market
11.5.8.4 Japan: Market, By Application
11.5.8.4.1 Aerospace Segment Accounted for the Largest Share in Japan�s Market
11.5.9 India
11.5.9.1 India: High Performance Alloys Market, By Product Type
11.5.9.1.1 Refractory Alloys Segment Projected to Grow at the Highest CAGR
11.5.9.2 India: Market, By Alloy Type
11.5.9.2.1 Cast Alloy Projected to Grow at the Highest CAGR
11.5.9.3 India: Market, By Alloying Element
11.5.9.3.1 Magnesium as an Alloying Element Segment Projected to Grow at Relatively Low Rate
11.5.9.4 India: Market, By Application
11.5.9.4.1 Application of High Performance Alloys in Industrial Sector Accounted for the Second-Largest Share
11.5.10.1 Rest of Asia-Pacific: High Performance Alloys Market, By Product Type
11.5.10.2 Rest of Asia-Pacific: Market, By Alloy Type
11.5.10.3 Rest of Asia-Pacific: Market, By Alloying Element
11.5.10.4 Rest of Asia-Pacific: Market, By Application
11.6 Rest of the World
11.6.1 Regulations in the Rest of the World
11.6.2 RoW: High Performance Alloys Market, By Country
11.6.3 RoW: High Performance Alloys Market, By Product Type
11.6.3.1 Refractory Alloys as Alloying Element to Grow at the Highest CAGR From 2015 to 2020
11.6.4 RoW: High Performance Alloys Market, By Alloy Type
11.6.4.1 Wrought Alloy Segment to Grow at A Considerable Rate in the RoW Market
11.6.5 RoW: High Performance Alloys Market, By Alloying Element
11.6.5.1 Aluminum as an Alloying Element to Grow at the Highest CAGR From 2015 to 2020
11.6.6 RoW: High Performance Alloys Market, By Application
11.6.6.1 Oil & Gas Segment Projected to Grow at A Relatively Low CAGR From 2015 to 2020
11.6.7 Brazil
11.6.7.1 Brazil: High Performance Alloys Market, By Product Type
11.6.7.1.1 Demand From End-Use Market is Projected to Drive the Non-Ferrous Alloys Market in Brazil
11.6.7.2 Brazil: Market, By Alloy Type
11.6.7.2.1 Wrought Alloy as an Alloy Type Segment Projected to Grow at A Lower Rate
11.6.7.3 Brazil: Market, By Alloying Element
11.6.7.3.1 Titanium as an Alloying Element Segment Projected to Grow at A Higher Rate
11.6.7.4 Brazil: Market, By Application
11.6.7.4.1 Demand for Aviation Services Projected to Drive Aerospace Segment in Brazil
11.6.8 Argentina
11.6.8.1 Argentina: High Performance Alloys Market, By Product Type
11.6.8.1.1 Non-Ferrous Alloys Segment Accounted for the Largest Share in Argentina in 2014
11.6.8.2 Argentina: Market, By Alloy Type
11.6.8.2.1 Wrought Alloy Segment Accounted for the Largest Share in Argentina in 2014
11.6.8.3 Argentina: Market, By Alloying Element
11.6.8.3.1 Titanium as an Alloying Element Accounted for the Second-Largest Share in Argentina in 2014
11.6.8.4 Argentina: Market, By Application
11.6.8.4.1 High Performance Alloys Segment Projected to Grow at the Highest Rate in Argentina
11.6.9 South Africa
11.6.9.1 South Africa: High Performance Alloys Market, By Product Type
11.6.9.1.1 Refractory Alloys Segment Projected to Grow at the Highest Rate in South Africa
11.6.9.2 South Africa: Market, By Alloy Type
11.6.9.2.1 Cast Alloy Segment Projected to Grow at the Highest Rate in South Africa
11.6.9.3 South Africa: Market, By Alloying Element
11.6.9.3.1 Aluminum as an Alloying Element Accounted for the Largest Share in South Africa
11.6.9.4 South Africa: Market, By Application
11.6.9.4.1 Oil & Gas Segment Projected to Witness Lower Growth Rate
11.6.10 Others in RoW
11.6.10.1 Others in RoW: High Performance Alloys Market, By Product Type
11.6.10.2 Others in RoW: Market, By Alloy Type
11.6.10.3 Others in RoW: Market, By Alloying Element
11.6.10.4 Others in RoW: Market, By Application
12 Competitive Landscape (Page No. - 191)
12.1 Introduction
12.2 Strategic Overview
12.3 Market Ranking of Key Players in the High Performance Alloys Market (2015)
12.4 Competitive Situation and Trends
12.4.1 Agreements
12.4.2 Acquisitions
12.4.3 Expansion
12.4.4 Joint Ventures
12.4.5 New Product Launches
13 Company Profiles (Page No. - 198)
(Company at A Glance, Recent Financials, Products & Services, Strategies & Insights, & Recent Developments)*
13.1 Introduction
13.2 Alcoa Inc.
13.3 Precision Castparts Corp.
13.4 Outokumpu
13.5 Hitachi Metals Ltd.
13.6 Aperam SA
13.7 Allegheny Technologies Incorporated
13.8 Carpenter Technology
13.9 Haynes International Inc.
13.10 Timken Company
13.11 VSMPO-Avisma Corporation
*Details on Company at A Glance, Recent Financials, Products & Services, Strategies & Insights, & Recent Developments Might Not Be Captured in Case of Unlisted Companies.
14 Appendix (Page No. - 227)
14.1 Insights of Industry Experts
14.2 Discussion Guide
14.3 Company Developments
14.3.1 Agreements
14.3.2 Acquisitions
14.3.3 Expansions
14.3.4 Joint Ventures
14.3.5 Joint Ventures
14.4 Introducing RT: Real-Time Market Intelligence
14.5 Available Customizations
14.6 Related Reports
List of Tables (207 Tables)
Table 1 Asia-Pacific: Urbanization Prospects
Table 2 High Performance Alloys Market, By Alloy Type
Table 3 High Performance Alloys Market, By Product Type
Table 4 High Performance Alloys Market, By Application
Table 5 High Performance Alloys Market, By Alloying Element
Table 6 High Performance Alloys Market Size, By Alloy Type,2013�2020 (USD Million)
Table 7 High Performance Alloys Market Size, By Alloy Type, 2013�2020 (KT)
Table 8 High Performance Wrought Alloys Market Size, By Product Type,2013�2020 (USD Million)
Table 9 High Performance Wrought Alloys Market Size, By Product Type,2013�2020 (KT)
Table 10 High Performance Cast Alloys Market Size, By Product Type,2013�2020 (USD Million)
Table 11 High Performance Cast Alloys Market Size, By Product Type,2013�2020 (KT)
Table 12 High Performance Alloys Market Size, By Product Type,2013�2020 (USD Million)
Table 13 High Performance Alloys Market Size, By Product Type, 2013�2020 (KT)
Table 14 High Performance Non-Ferrous Alloys Market Size, By Application, 2013�2020 (USD Million)
Table 15 High Performance Non-Ferrous Alloys Market Size, By Application, 2013�2020 (KT)
Table 16 High Performance Refractory Alloys Market Size, By Application,2013�2020 (USD Million)
Table 17 High Performance Refractory Alloys Market Size, By Application,2013�2020 (KT)
Table 18 Other High Performance Alloys Market Size, By Application,2013�2020 (USD Million)
Table 19 Other High Performance Alloys Market Size, By Application,2013�2020 (KT)
Table 20 High Performance Alloys Market Size, By Application,2013�2020 (USD Million)
Table 21 High Performance Alloys Market Size, By Application, 2013�2020 (KT)
Table 22 High Performance Alloys Market Size, By Alloying Element,2013�2020 (USD Million)
Table 23 High Performance Alloys Market Size, By Alloying Element,2013�2020 (KT)
Table 24 High Performance Aluminum Alloys Market Size, By Application,2013�2020 (USD Million)
Table 25 High Performance Aluminum Alloys Market Size, By Application,2013�2020 (KT)
Table 26 High Performance Titanium Alloys Market Size, By Application,2013�2020 (USD Million)
Table 27 High Performance Titanium Alloys Market Size, By Application,2013�2020 (KT)
Table 28 High Performance Magnesium Alloys Market Size, By Application,2013�2020 (USD Million)
Table 29 High Performance Magnesium Alloys Market Size, By Application,2013�2020 (KT)
Table 30 Other High Performance Alloys Market Size, By Application,2013�2020 (USD Million)
Table 31 Other High Performance Alloys Market Size, By Application,2013�2020 (KT)
Table 32 High Performance Alloys Market Size, By Region,2013�2020 (USD Million)
Table 33 High Performance Alloys Market Size, By Region, 2013�2020 (KT)
Table 34 North America: High Performance Alloys Market Size, By Country,2013�2020 (USD Million)
Table 35 North America: Market Size, By Country,2013�2020 (KT)
Table 36 North America: Market Size, By Product Type, 2013�2020 (USD Million)
Table 37 North America: Market Size, By Product Type, 2013�2020 (KT)
Table 38 North America: Market Size, By Alloy Type, 2013�2020 (USD Million)
Table 39 North America: Market Size, By Alloy Type, 2013�2020 (KT)
Table 40 North America: Market Size, By Alloying Element, 2013�2020 (USD Million)
Table 41 North America: Market Size, By Alloying Element, 2013�2020 (KT)
Table 42 North America: Market Size, By Application, 2013�2020 (USD Million)
Table 43 North America: Market Size, By Application, 2013�2020 (KT)
Table 44 U.S.: High Performance Alloys Market Size, By Product Type,2013�2020 (USD Million)
Table 45 U.S.: Market Size, By Product Type,2013�2020 (KT)
Table 46 U.S.: Market Size, By Alloy Type,2013�2020 (USD Million)
Table 47 U.S.: Market Size, By Alloy Type, 2013�2020 (KT)
Table 48 U.S.: Market Size, By Alloying Element,2013�2020 (USD Million)
Table 49 U.S.: Market Size, By Alloying Element,2013�2020 (KT)
Table 50 U.S.: Market Size, By Application,2013�2020 (USD Million)
Table 51 U.S.: Market Size, By Application,2013�2020 (KT)
Table 52 Canada: High Performance Alloys Market Size, By Product Type,2013�2020 (USD Million)
Table 53 Canada: Market Size, By Product Type,2013�2020 (KT)
Table 54 Canada: Market Size, By Alloy Type,2013�2020 (USD Million)
Table 55 Canada: Market Size, By Alloy Type,2013�2020 (KT)
Table 56 Canada: Market Size, By Alloying Element, 2013�2020 (USD Million)
Table 57 Canada: Market Size, By Alloying Element, 2013�2020 (KT)
Table 58 Canada: Market Size, By Application,2013�2020 (USD Million)
Table 59 Canada: Market Size, By Application,2013�2020 (KT)
Table 60 Mexico: High Performance Alloys Market Size, By Product Type,2013�2020 (USD Million)
Table 61 Mexico: Market Size, By Product Type,2013�2020 (KT)
Table 62 Mexico: Market Size, By Alloy Type,2013�2020 (USD Million)
Table 63 Mexico: Market Size, By Alloy Type,2013�2020 (KT)
Table 64 Mexico: Market Size, By Alloying Element, 2013�2020 (USD Million)
Table 65 Mexico: Market Size, By Alloying Element, 2013�2020 (KT)
Table 66 Mexico: Market Size, By Application,2013�2020 (USD Million)
Table 67 Mexico: Market Size, By Application,2013�2020 (KT)
Table 68 Europe: High Performance Alloys Market Size, By Country,2013�2020 (USD Million)
Table 69 Europe: Market Size, By Country,2013�2020 (KT)
Table 70 Europe: Market Size, By Product Type,2013�2020 (USD Million)
Table 71 Europe: Market Size, By Product Type,2013�2020 (USD Million)
Table 72 Europe: Market Size, By Alloy Type,2013�2020 (USD Million)
Table 73 Europe: Market Size, By Alloy Type,2013�2020 (KT)
Table 74 Europe: Market Size, By Alloying Element, 2013�2020 (USD Million)
Table 75 Europe: Market Size, By Alloying Element, 2013�2020 (KT)
Table 76 Europe: Market Size, By Application,2013�2020 (USD Million)
Table 77 Europe: Market Size, By Application,2013�2020 (KT)
Table 78 Germany: High Performance Alloys Market Size, By Product Type,2013�2020 (USD Million)
Table 79 Germany: Market Size, By Product Type,2013�2020 (KT)
Table 80 Germany: Market Size, By Alloy Type,2013�2020 (USD Million)
Table 81 Germany: Market Size, By Alloy Type,2013�2020 (KT)
Table 82 Germany: Market Size, By Alloying Element, 2013�2020 (USD Million)
Table 83 Germany: Market Size, By Alloying Element, 2013�2020 (USD Million)
Table 84 Germany: Market Size, By Application,2013�2020 (USD Million)
Table 85 Germany: Market Size, By Application,2013�2020 (USD Million)
Table 86 U.K.: High Performance Alloys Market Size, By Product Type,2013�2020 (USD Million)
Table 87 U.K.: Market Size, By Product Type,2013�2020 (KT)
Table 88 U.K.: Market Size, By Alloy Type,2013�2020 (USD Million)
Table 89 U.K.: Market Size, By Product Type,2013�2020 (KT)
Table 90 U.K.: Market Size, By Alloying Element,2013�2020 (USD Million)
Table 91 U.K.: Market Size, By Alloying Element,2013�2020 (KT)
Table 92 U.K.: Market Size, By Application,2013�2020 (USD Million)
Table 93 U.K.: Market Size, By Application,2013�2020 (KT)
Table 94 Russia: High Performance Alloys Market Size, By Product Type,2013�2020 (USD Million)
Table 95 Russia: Market Size, By Product Type,2013�2020 (KT)
Table 96 Russia: Market Size, By Alloy Type,2013�2020 (USD Million)
Table 97 Russia: Market Size, By Alloy Type,2013�2020 (KT)
Table 98 Russia: Market Size, By Alloying Element, 2013�2020 (USD Million)
Table 99 Russia: Market Size, By Alloying Element, 2013�2020 (KT)
Table 100 Russia: Market Size, By Application,2013�2020 (USD Million)
Table 101 Russia: Market Size, By Application,2013�2020 (KT)
Table 102 France: High Performance Alloys Market Size, By Product Type,2013�2020 (USD Million)
Table 103 France: Market Size, By Product Type,2013�2020 (KT)
Table 104 France: Market Size, By Alloy Type,2013�2020 (USD Million)
Table 105 France: Market Size, By Alloy Type,2013�2020 (KT)
Table 106 France: Market Size, By Alloying Element, 2013�2020 (USD Million)
Table 107 France: Market Size, By Alloying Element, 2013�2020 (KT)
Table 108 France: Market Size, By Application,2013�2020 (USD Million)
Table 109 France: Market Size, By Application,2013�2020 (KT)
Table 110 Rest of Europe: High Performance Alloys Market Size, By Product Type, 2013�2020 (USD Million)
Table 111 Rest of Europe: Market Size, By Product Type, 2013�2020 (KT)
Table 112 Rest of Europe: Market Size, By Alloy Type, 2013�2020 (USD Million)
Table 113 Rest of Europe: Market Size, By Alloy Type, 2013�2020 (KT)
Table 114 Rest of Europe: Market Size, By Alloying Element, 2013�2020 (USD Million)
Table 115 Rest of Europe: Market Size, By Alloying Element, 2013�2020 (KT)
Table 116 Rest of Europe: Market Size, By Application, 2013�2020 (USD Million)
Table 117 Rest of Europe: Market Size, By Application, 2013�2020 (KT)
Table 118 Asia-Pacific: High Performance Alloys Market Size, By Country,2013�2020 (USD Million)
Table 119 Asia-Pacific: Market Size, By Country,2013�2020 (KT)
Table 120 Asia-Pacific: Market Size, By Product Type, 2013�2020 (USD Million)
Table 121 Asia-Pacific: Market Size, By Product Type, 2013�2020 (KT)
Table 122 Asia-Pacific: Market Size, By Alloy Type,2013�2020 (USD Million)
Table 123 Asia-Pacific: Market Size, By Alloy Type,2013�2020 (KT)
Table 124 Asia-Pacific: Market Size, By Alloying Element, 2013�2020 (USD Million)
Table 125 Asia-Pacific: Market Size, By Alloying Element, 2013�2020 (KT)
Table 126 Asia-Pacific: Market Size, By Application,2013�2020 (USD Million)
Table 127 Asia-Pacific: Market Size, By Application,2013�2020 (KT)
Table 128 China: High Performance Alloys Market Size, By Product Type,2013�2020 (USD Million)
Table 129 China: Market Size, By Product Type,2013�2020 (KT)
Table 130 China: Market Size, By Alloy Type,2013�2020 (USD Million)
Table 131 China: Market Size, By Alloy Type,2013�2020 (KT)
Table 132 China: Market Size, By Alloying Element,2013�2020 (USD Million)
Table 133 China: Market Size, By Alloying Element,2013�2020 (KT)
Table 134 China: Market Size, By Application,2013�2020 (USD Million)
Table 135 China: Market Size, By Application,2013�2020 (KT)
Table 136 Japan: High Performance Alloys Market Size, By Product Type,2013�2020 (USD Million)
Table 137 Japan: Market Size, By Product Type,2013�2020 (KT)
Table 138 Japan: Market Size, By Alloy Type,2013�2020 (USD Million)
Table 139 Japan: Market Size, By Alloy Type,2013�2020 (KT)
Table 140 Japan: Market Size, By Alloying Element,2013�2020 (USD Million)
Table 141 Japan: Market Size, By Alloying Element,2013�2020 (KT)
Table 142 Japan: Market Size, By Application,2013�2020 (USD Million)
Table 143 Japan: Market Size, By Application,2013�2020 (KT)
Table 144 India: High Performance Alloys Market Size, By Product Type,2013�2020 (USD Million)
Table 145 India: Market Size, By Product Type,2013�2020 (KT)
Table 146 India: Market Size, By Alloy Type,2013�2020 (USD Million)
Table 147 India: Market Size, By Alloy Type,2013�2020 (KT)
Table 148 India: Market Size, By Alloying Element,2013�2020 (USD Million)
Table 149 India: Market Size, By Alloying Element,2013�2020 (KT)
Table 150 India: Market Size, By Application,2013�2020 (USD Million)
Table 151 India: Market Size, By Application,2013�2020 (KT)
Table 152 Rest of Asia-Pacific: High Performance Alloys Market Size, By Product Type, 2013�2020 (USD Million)
Table 153 Rest of Asia-Pacific: Market Size, By Product Type, 2013�2020 (KT)
Table 154 Rest of Asia-Pacific: Market Size, By Alloy Type, 2013�2020 (USD Million)
Table 155 Rest of Asia-Pacific: Market Size, By Alloy Type, 2013�2020 (KT)
Table 156 Rest of Asia-Pacific: Market Size, By Alloying Element, 2013�2020 (USD Million)
Table 157 Rest of Asia-Pacific: Market Size, By Alloying Element, 2013�2020 (KT)
Table 158 Rest of Asia-Pacific: Market Size, By Application, 2013�2020 (USD Million)
Table 159 Rest of Asia-Pacific: Market Size, By Application, 2013�2020 (KT)
Table 160 RoW: High Performance Alloys Market Size, By Country,2013�2020 (USD Million)
Table 161 RoW: Market Size, By Country, 2013�2020 (KT)
Table 162 RoW: Market Size, By Product Type,2013�2020 (USD Million)
Table 163 RoW: Market Size, By Product Type,2013�2020 (KT)
Table 164 RoW: Market Size, By Alloy Type,2013�2020 (USD Million)
Table 165 RoW: Market Size, By Alloy Type, 2013�2020 (KT)
Table 166 RoW: Market Size, By Alloying Element,2013�2020 (USD Million)
Table 167 RoW: Market Size, By Alloying Element,2013�2020 (KT)
Table 168 RoW: Market Size, By Application,2013�2020 (USD Million)
Table 169 RoW: Market Size, By Application,2013�2020 (KT)
Table 170 Brazil: High Performance Alloys Market Size, By Product Type,2013�2020 (USD Million)
Table 171 Brazil: Market Size, By Product Type,2013�2020 (KT)
Table 172 Brazil: Market Size, By Alloy Type,2013�2020 (USD Million)
Table 173 Brazil: Market Size, By Alloy Type,2013�2020 (KT)
Table 174 Brazil: Market Size, By Alloying Element, 2013�2020 (USD Million)
Table 175 Brazil: Market Size, By Alloying Element, 2013�2020 (KT)
Table 176 Brazil: Market Size, By Application,2013�2020 (USD Million)
Table 177 Brazil: Market Size, By Application,2013�2020 (KT)
Table 178 Argentina: High Performance Alloys Market Size, By Product Type,2013�2020 (USD Million)
Table 179 Argentina: Market Size, By Product Type,2013�2020 (KT)
Table 180 Argentina: Market Size, By Alloy Type,2013�2020 (USD Million)
Table 181 Argentina: Market Size, By Alloy Type,2013�2020 (KT)
Table 182 Argentina: Market Size, By Alloying Element, 2013�2020 (USD Million)
Table 183 Argentina: Market Size, By Alloying Element, 2013�2020 (KT)
Table 184 Argentina: Market Size, By Application,2013�2020 (USD Million)
Table 185 Argentina: Market Size, By Application,2013�2020 (KT)
Table 186 South Africa: High Performance Alloys Market Size, By Product Type, 2013�2020 (USD Million)
Table 187 South Africa: Market Size, By Product Type, 2013�2020 (KT)
Table 188 South Africa: Market Size, By Alloy Type,2013�2020 (USD Million)
Table 189 South Africa: Market Size, By Alloy Type,2013�2020 (KT)
Table 190 South Africa: Market Size, By Alloying Element, 2013�2020 (USD Million)
Table 191 South Africa: Market Size, By Alloying Element, 2013�2020 (KT)
Table 192 South Africa: Market Size, By Application, 2013�2020 (USD Million)
Table 193 South Africa: Market Size, By Application, 2013�2020 (KT)
Table 194 Others in RoW: High Performance Alloys Market Size, By Product Type, 2013�2020 (USD Million)
Table 195 Others in RoW: Market Size, By Product Type, 2013�2020 (KT)
Table 196 Others in RoW: Market Size, By Alloy Type, 2013�2020 (USD Million)
Table 197 Others in RoW: Market Size, By Alloy Type, 2013�2020 (KT)
Table 198 Others in RoW: Market Size, By Alloying Element, 2013�2020 (USD Million)
Table 199 Others in RoW :Market Size, By Alloying Element, 2013�2020 (KT)
Table 200 Others in RoW: Market Size, By Application, 2013�2020 (USD Million)
Table 201 Others in RoW: Market Size, By Application, 2013�2020 (KT)
Table 202 Rank of Companies in the High Performance Alloys Market, 2015
Table 203 Agreements, 2013�2015
Table 204 Acquisitions, 2013�2015
Table 205 Expansion, 2013�2015
Table 206 Joint Ventures, 2013�2015
Table 207 New Product Launches, 2013�2015
List of Figures (54 Figures)
Figure 1 High Performance Alloys
Figure 2 Research Design
Figure 3 Global Population Projected to Reach ~9.5 Billion By 2050
Figure 4 Middle Class Population, 2009�2030
Figure 5 Projected GDP Per Capita, By Region
Figure 6 Fluctuation in Price of Aluminum From 2011 to 2015
Figure 7 Market Size Estimation Methodology: Bottom-Up Approach
Figure 8 Market Size Estimation Methodology: Top-Down Approach
Figure 9 Asia-Pacific Projected to Grow at the Highest CAGR Due to Rising Demand From End-User Industries
Figure 10 High Performance Alloys Market Snapshot, 2015 vs. 2020 (USD Million)
Figure 11 North America Accounted for the Largest Share in 2014
Figure 12 Key Strategies of Various Competitors, 2012�2015
Figure 13 Emerging Economies Offer Attractive Opportunities in the High Performance Alloys Market
Figure 14 Aerospace the Top Application for High Performance Alloys in 2015
Figure 15 China is Projected to Be the Fastest-Growing Country-Level Market in Asia-Pacific for High Performance Alloys
Figure 16 Aerospace Segment is Expected to Grow at the Highest Rate From2015 to 2020
Figure 17 Emerging Markets to Grow at A Higher Rate Than Developed Markets Between 2015 and 2020
Figure 18 Aluminum Market in High Performance Alloys is Projected to Grow at the Highest Rate
Figure 19 High Performance Alloys Market in Asia-Pacific is Experiencing High Growth
Figure 20 Evolution of High Performance Alloys
Figure 21 High Performance Alloys Market Segmentation
Figure 22 Rising Demand From End-Use Industry is the Key Driver for this Market
Figure 23 High Performance Alloys Prices, By Region, 2014 (USD Per KT)
Figure 24 High Performance Alloys Prices, By Alloy Type, 2014 (USD Per KT)
Figure 25 High Performance Alloys Prices, By Product Type, 2014 (USD Per KT)
Figure 26 High Performance Alloys Prices, By Application, 2014 (USD Per KT)
Figure 27 High Performance Alloys Prices, By Alloying Element, 2014 (USD Per KT)
Figure 28 Manufacturing Process Contributes the Most to the Value of the Overall High Performance Alloys Market
Figure 29 Porter�s Five Forces Analysis
Figure 30 High Performance Alloys Market Size, By Alloy Type,2015 vs. 2020 (USD Million)
Figure 31 High Performance Alloys Market Size, By Product Type,2015 vs. 2020 (USD Million)
Figure 32 High Performance Alloys Market Size, By Application,2015 vs. 2020 (USD Million)
Figure 33 High Performance Alloys Market Size, By Alloying Element,2015 vs. 2020 (USD Million)
Figure 34 High Performance Alloys Market Growth Analysis, 2015�2020
Figure 35 North America: Market Snapshot
Figure 36 Asia-Pacific: Market Snapshot
Figure 37 Agreements is the Key Growth Strategy Adopted By Players in the High Performance Alloys Market (2012-2015)
Figure 38 Battle for Market Share: Agreements, Acquisitions, Expansions & Joint Ventures, and New Product Launches Were the Key Strategies Adopted By Players, January 2012-August 2015
Figure 39 Geographical Revenue Mix of Top Five Players (2015)
Figure 40 Alcoa Inc.: Company Snapshot
Figure 41 Alcoa Inc.: SWOT Analysis
Figure 42 Precision Castparts Corporation: Company Snapshot
Figure 43 Precision Castparts Corporation: SWOT Analysis
Figure 44 Outokumpu: Company Snapshot
Figure 45 Outokumpu: SWOT Analysis
Figure 46 Hitachi Metals Ltd.: Company Snapshot
Figure 47 Hitachi Metals Limited: SWOT Analysis
Figure 48 Aperam SA: Company Snapshot
Figure 49 Aperam SA: SWOT Analysis
Figure 50 Allegheny Technologies Incorporated: Company Snapshot
Figure 51 Carpenter Technology: Company Snapshot
Figure 52 Haynes International Inc.: Company Snapshot
Figure 53 Timken Company: Company Snapshot
Figure 54 VSMPO-Avisma Corporation: Company Snapshot


Growth opportunities and latent adjacency in High Performance Alloys Market